|
|
AIR POLLUTION IN THE CZECH REPUBLIC IN 2004 Czech Hydrometeorological Institute - Air Quality Protection Division |
|
|
|
|
1. ATMOSPHERIC POLLUTANTS EMISSION IN THE CZECH REPUBLIC
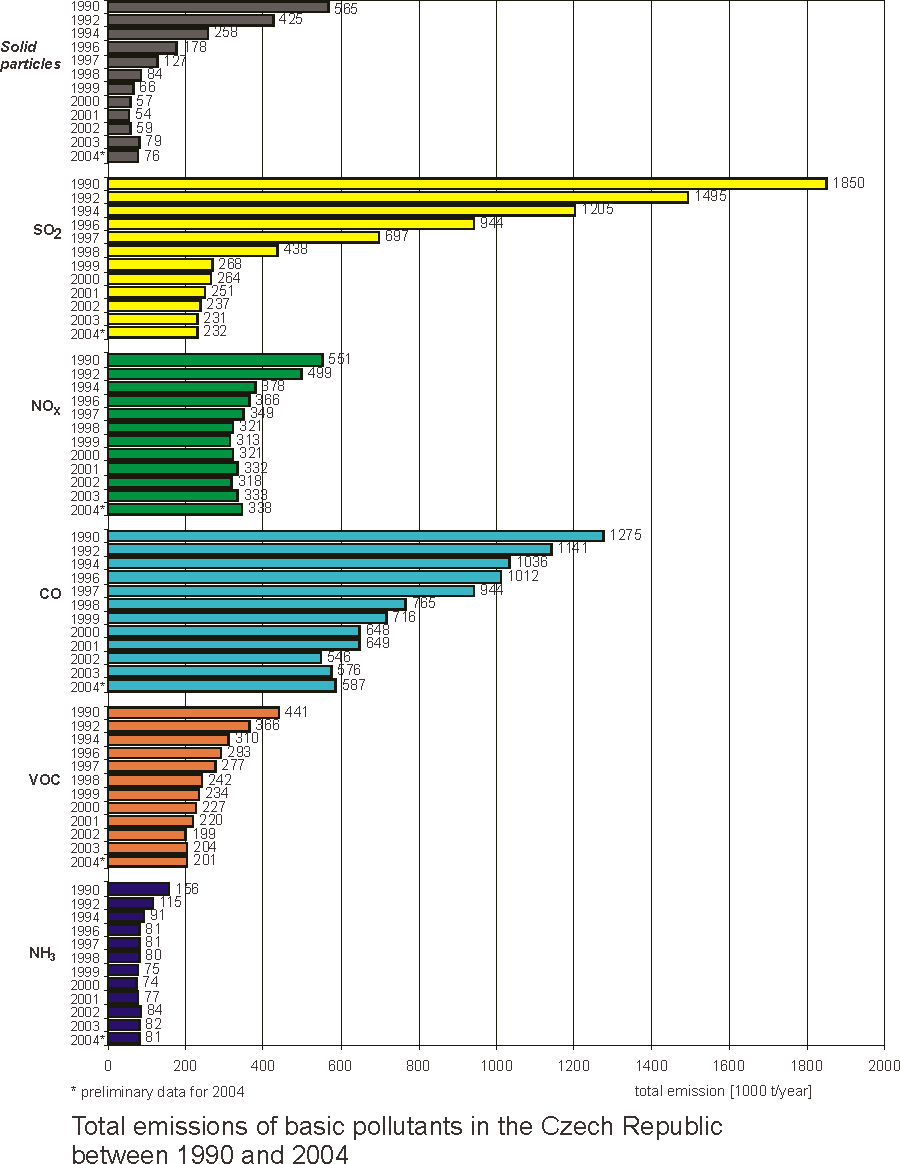
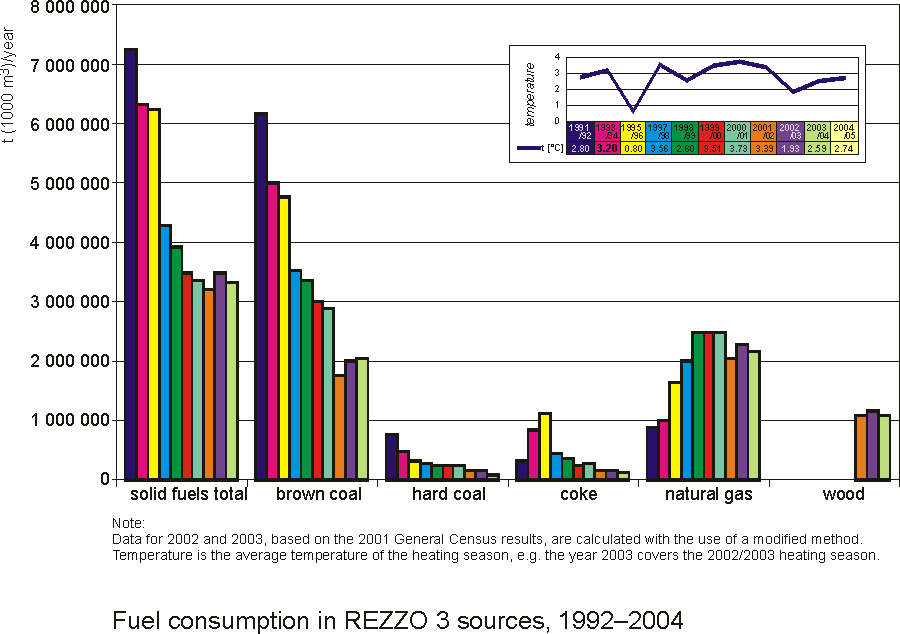
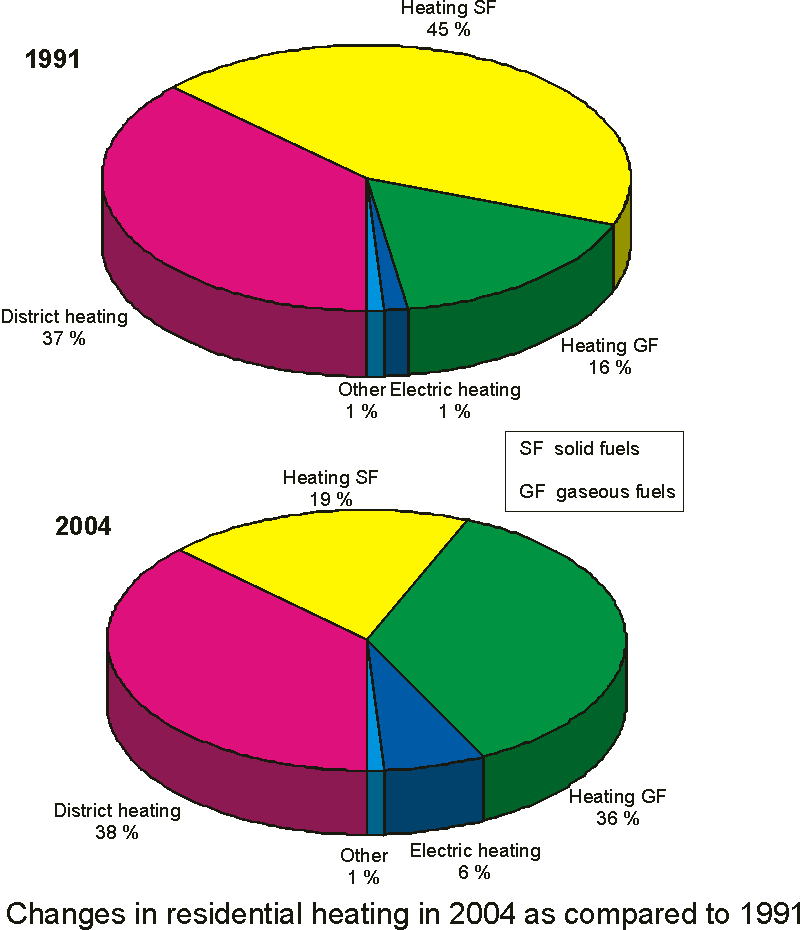
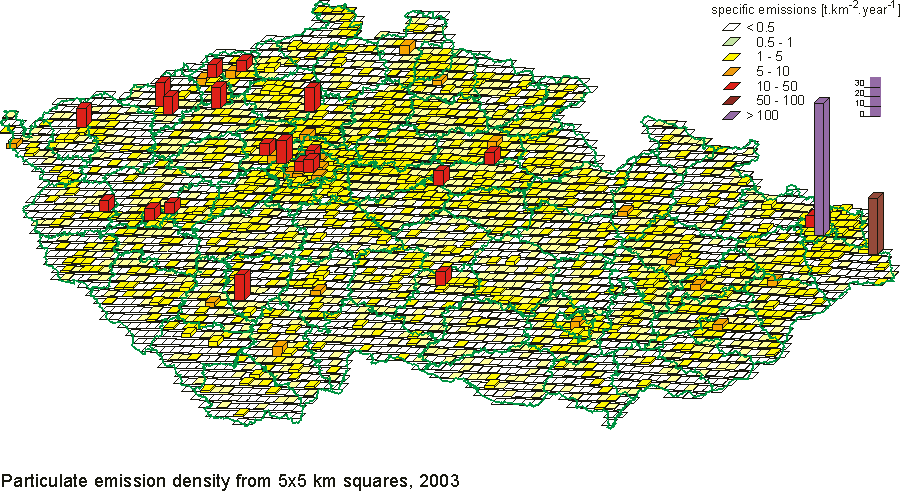
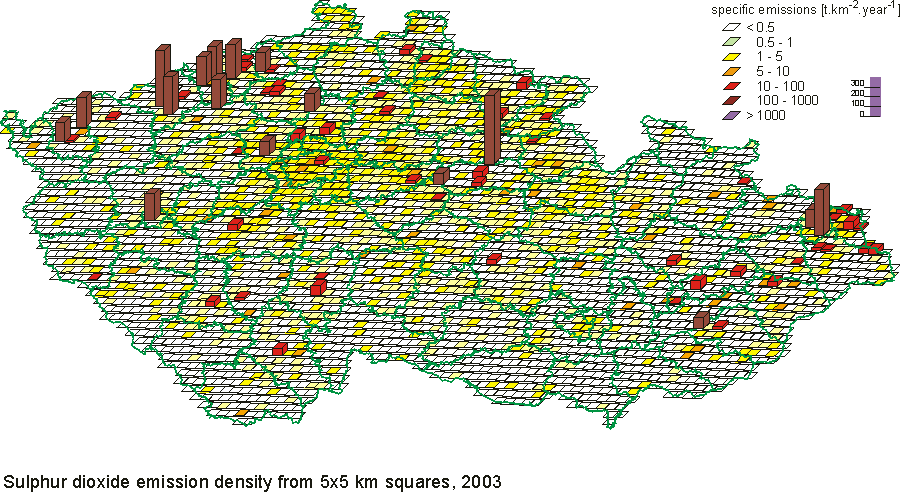
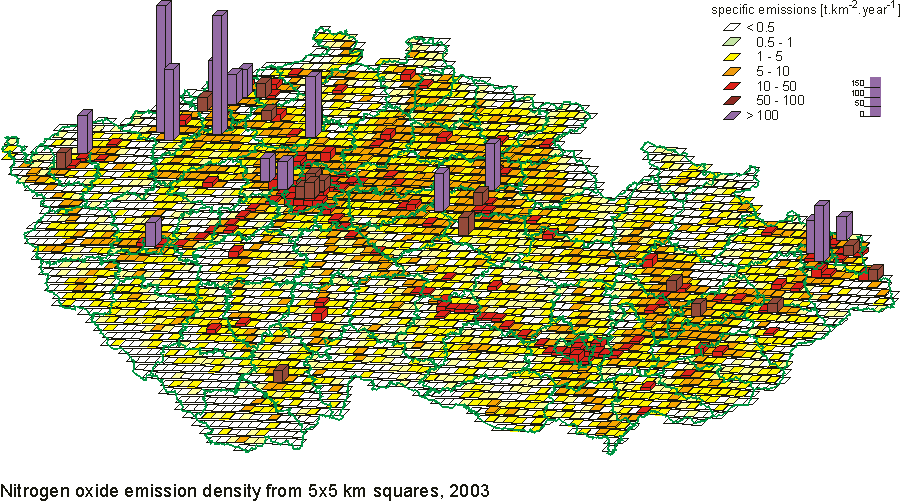
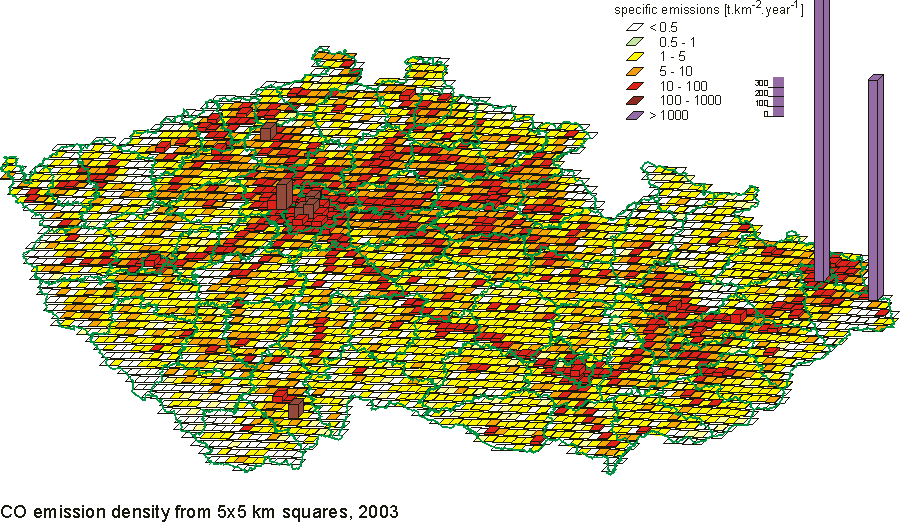
Pursuant to the legislation which came into force in 2002 air pollution sources are divided into several categories to carry out emission inventories. Complying with this categorisation, the ISKO system operated by CHMI includes REZZO 1–4 databases (Register of Emissions and Air Pollution Sources) which serve for archiving and presenting data on stationary and mobile air pollution sources. Extra large, large and medium-sized air pollution sources are monitored individually as point sources, small sources at local level as area sources and mobile sources as line sources (road transport in sections controlled by vehicle census) and as area sources at district level (other mobile sources). I. Extra large and large pollution sources - REZZO 1 The data used in the 2004 emission inventory of air pollutants from extra large and large sources (c. 3500 sources) are extracted from the summary operational inventory submitted by source operators to the Czech Environmental Inspection Office (ČIŽP) which is in charge of data collection and verification. Based on these data the REZZO 1 database is also updated, i.e. constant and variable data on operation of air pollution sources (categorisation of sources, parameters, fuel consumption and emission quantity). The medium-sized sources category includes data on about 30,000 sources. Data processing for emission inventory and REZZO 2 database is in charge of the authorities of the basic administrative units with extended competences. Final data on emissions from REZZO 1 and REZZO 2 sources were not available by the deadline of the Yearbook. Consequently, emission data for the year 2004 presented in the tables are preliminary. Emissions from small sources (local heating units) have been inventoried based on the 1991 and 2001 General Census. Emission inventory is based on the model using updated data on climatic conditions, figures on heat requirements for household heating and on consumption of particular fuel types calculated from them. Fuel composition is based on General Census information on the prevailing way of household heating and on the used types of energy, updated annually according to data submitted by fuels and energy central suppliers. Inventories of emissions from transport, falling within the competency of the Ministry of Transport, have been processed by the Transport Research Centre (CDV) Brno based on the method of determination of transport emissions. Emissions from agricultural and forest machines and other vehicles were calculated with the use of the data on sale and consumption of fuels for the year 2004. Table 1.1 documents preliminary data on total emissions of basic air pollutants in 2004, and namely solid particles, SO2, NOx , CO, volatile organic compounds (VOC) and ammonia (NH3) and the shares contributed by each of the emission source categories to total air pollutant emissions. More detailed data on regionally distributed emissions are shown in the CHMI website. The development of total emissions of basic pollutants in 1990–2004 is shown in Fig. 1.1. The emissions and removals inventory of gases influencing the climatic system of the Earth is carried out in accordance with continuously improved international IPCC methodology. This inventory will be also used for checking the complying with the international obligations set by the Kyoto Protocol. The Czech Republic will have to reduce the total GHG emissions by 8 % as compared with the reference year 1990 by 2008–2012. The regular monitoring of GHG emissions meets also the requirements of the Decision No. 280/2004/EC of the European Parliament and of the Council. Due to continual development of the methods and the rigorous implementation of QA/QC mechanisms the values are recalculated if necessary and therefore minor changes may occur in the shown data. In the Czech Republic, the total GHG emissions including their removals expressed as equivalent values of CO2 declined from 189.9 mil. tons in 1990 to 143.4 mil. tons in 2003 (see Tab. 1.2) and compared with the reference year 1990 they declined by 24.5%. Since 1995 emissions of HFC, PFC and SF6 (substances containing fluorine, the so-called F-gases), the influence of which is also controlled by the Kyoto Protocol, have been included. Their current share in total GHG emissions amounts to 1.2 % in the Czech Republic. In 2003, the relevant shares in total emissions were 86.0 % for CO2, 7.1 % for CH4 and 5.7 % for N2O. No significant changes have been observed during recent years. Table 1.3 covers heavy metals (HM) and POPs emissions. The emission inventories were produced mainly with the use of activity data (fuel and propellant consumption, incinerated waste quantity, statistical data on the production of selected technologies) and of the respective emission factors. In addition to Pb, Hg and Cd emissions presented until 2000 emissions of further monitored heavy metals have been calculated since 2001. In 2003 the methods of HM and POPs emissions calculation and estimates were verified pursuant to internationally recommended procedures and for the first time the updated emission factors were used for the calculations for the year 2002. The recalculation of data on POPs emissions for the previous periods is carried out at present. Table 1.4 demonstrates the consumption development of principal fuels of REZZO 1 sources in the period 1990–2003. A trend of marked decrease in brown coal and residual oil consumption by large emission sources contributed to a long-term decline in SO2 and particulates, mainly in the 1990–1997 period. The development of consumption of principal fuels of REZZO 3 sources between 1992 (data based on the inventory carried out by TECO Milevsko) and 2004 is shown in Fig. 1.2. Changes in residential heating in 2004 (updated situation) as compared to 1991 (data provided by General Census) are shown in Fig. 1.3. Emission data processed into charts with the help of GIS are shown in Figs. 1.4, 1.5, 1.6 and 1.7. Emission densities for solid particles, SO2, NOx and CO are plotted in 5x5-km grid-squares. The charts are based on current emissions from stationary sources (REZZO 1 to 3) and mobile sources (REZZO 4) for 2003, with regional disaggregation of emissions from line sources according to the 2000 vehicle census. The region of the Capital City of Prague, Ústí nad Labem Region and the Moravian-Silesian Region are still counted as the most polluted regions of the Czech Republic with regard to emissions of air pollutants. Comparison of the specific emissions in particular regions in 1990 and 2003 (Table 1.5 and Table 1.6) shows that in case of this coefficient expressive improvements occurred, especially reduction of SO2 and particulate emissions. Tab. 1.1 Total emissions of principal air pollutants in 2004 – preliminary data Tab. 1.2 Total emissions of greenhouse gases, 1990 to 2003 [Mt CO2ekv.] Tab. 1.3 Total emissions of HMs and POPs between 1990 and 2003 Tab. 1.4 Fuel consumption in REZZO 1 sources between 1990 and 2003 Tab. 1.5 Specific emission from stationary sources, 1990 Tab. 1.6 Specific emission from stationary sources, 2003 Fig. 1.1 Total emissions of basic pollutants in the Czech Republic between 1990 and 2004
Fig. 1.2 Fuel consumption in REZZO 3 sources, 1992–2004
Fig. 1.3 Changes in residential heating in 2004 as compared to 1991
Fig. 1.4 Particulate emission density from 5x5 km squares, 2003
Fig. 1.5 Sulphur dioxide emission density from 5x5 km squares, 2003
Fig. 1.6 Nitrogen oxide emission density from 5x5 km squares, 2003
Fig. 1.7 CO emission density from 5x5 km squares, 2003
|