|
|
AIT POLLUTION IN THE CZECH REPUBLIC IN 2000 Czech Hydrometeorological Institute - Air Quality Protection Division |
|
|
|
|
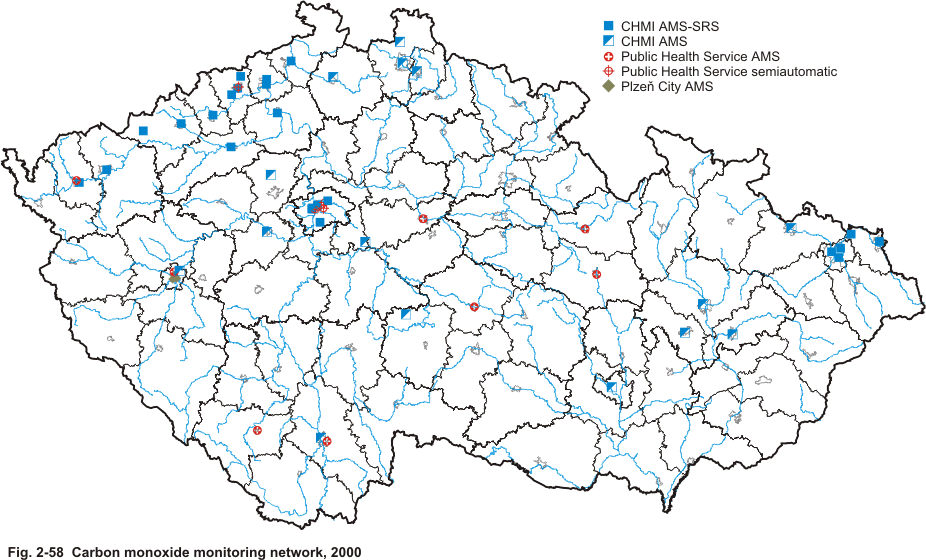
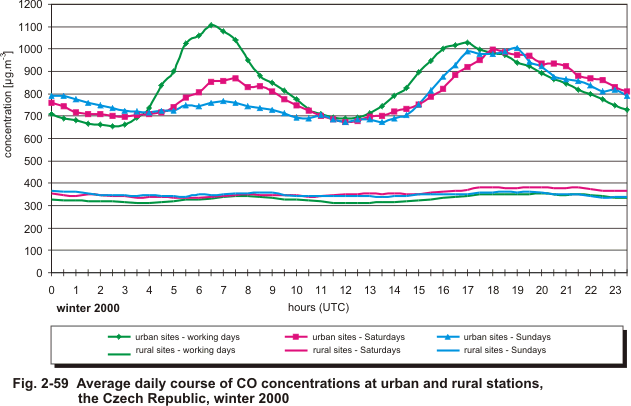
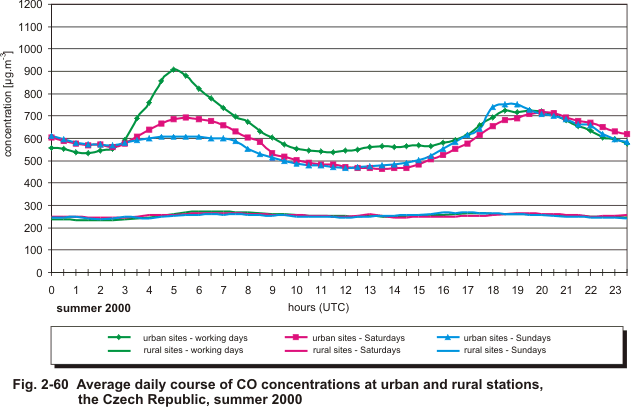
2.3.3 Carbon Monoxide
Carbon monoxide measurements have been taken in the country�s automated ambient air pollution monitoring system since 1993. In 2000, they were recorded at 55 sites throughout the Czech Republic. The sites and their numerical codes are shown in Fig. 2-58. The main sources of CO emissions include road transport and combustion of fossil fuels. CO emissions from road transport do not change much during the year, while those produced by burning fossil fuels are heavier in winter than in summer, leading to increased CO concentrations in winter, especially in urban areas. Figs. 2-59 and 2-60 illustrate average daily courses of CO concentrations calculated on data from selected urban and rural stations, for a kind of an �urban� and a �rural� station, separately for the winter and summer seasons. Obvious from the Figures is both the considerable difference between the concentrations measured, and carbon monoxide�s different behaviour at these two types of station. CO levels exhibit distinct diurnal variations in urban areas because they are closely related to the intensity of road transport. Elevated CO concentrations can be observed on working days during rush hours in the morning and in the evening. Hours on the x-axis in the Figure denote UTC (Universe Time Co-ordinated). Diurnal changes in CO levels are not so prominent during weekends. On Saturdays, CO concentrations show maximums in the morning and early evening. However, the maximum concentrations are in general lower than on working days, and the times of their occurrence vary greatly from station to station, especially in the morning. On Sundays, the maximum concentrations are observed from late afternoon to early night, which is probably attributable to the return of city dwellers back home in automobiles. No diurnal profile is discernible in rural areas, with their almost identical working-day and week-end concentration profiles. Winter months see levels somewhat higher than the summer. Only CHMI stations were included in the analysis of daily courses. Prague Public Health Service stations (in spite of the highest concentrations recorded and highest limit values exceedence frequency observed) were not considered due to their atypical behaviour. At present validation of measurements is carried out withrespect to the correctness and accuracy of the measured values and representativeness with respect to the measured localities. Table 2-71 indicates carbon monoxide concentrations� annual courses and calculated annual statistics for CO at measuring stations. The method used for CO analysis at all of the sites plotted in the Figure is infra-red correlation photometry. CO levels are evidently higher in winter, at monitoring stations in typically urban areas. This is due to heavier CO emissions from burning fossil fuels in winter. CO ambient air pollution limit values in place in the Czech Republic are set as a 24-hour ambient air pollution limit value (IHd) at 5,000 μg.m-3, and a half-hour ambient air pollution limit value (IHk) at 10,000 μg.m-3. The analysis of the 2000 data file has revealed that IHk was exceeded in 1,917 cases, at 6 stations. Five of these stations are operated by the Public Health Service, one by CHMI (Brno- Kroftova). The following table shows the exceedence frequencies.
The absolute IHk maxima were recorded at Public Health Service station in Prague 5-Svornosti and Prague 8-Sokolovská. Concentrations presented in the database (62–500 μg.m-3) correspond to the gauge of the used measuring instruments. Thus it is probable that some of the stated concentrations might have been higher and remained unrecorded. The daily limit value was exceeded at 2 stations in 261 cases. The highest frequency of exceedence was recorded at Public Health Service stations Prague 8- Sokolovská and Prague 5-Svornosti with IHd 39.4 % and 34.8 % respectively. None of the remaining stations reported any exceedences of IHd. The highest 24-hour average level was measured at Prague 5- Svornosti station on 13 December and amounted to 17,540 μg.m-3 (the 1999 24-hour maximum concentration was 14,754 μg.m-3 measured at the same station). The high levels of relative IHd exceedence frequencies for CO correspond to those for NOx and SPM at these stations. In general, the number of limit values exceedences was lower in 2000 than in 1999; the measured maximum value was somewhat higher.
|