AIR POLLUTION IN THE CZECH REPUBLIC IN 2012

Czech Hydrometeorological Institute - Air Quality Protection Division


III. ATMOSPHERIC DEPOSITION IN THE CZECH REPUBLIC

Chemical composition (precipitation quality) and atmospheric deposition have been monitored in the long term at relatively large number of stations in the Czech Republic. In 2012 the Air Quality Information System (ISKO/AQIS) database obtained data on precipitation quality from 44 localities in total (13 ÄŚGS, 14 CHMI, 8 VĂšLHM, 1 VĂšV TGM, 6 HBĂš AV ÄŚR and 2 KRNAP, see Fig. III.1). Further, data from 5 German (by LfuG) and 3 Polish localities (by WIOS) in boundary areas were submitted. Most of the CHMI stations measure wet-only samples in weekly interval (monthly interval was switched over to weekly interval in 1996 in line with the EMEP methodology). Further, from 1997 to 2010 the weekly precipitation sampling, “bulk” type (with non-specified content of dustfall), for heavy metals analysis was carried out at these stations. Since 2011 the analyses of heavy metals at CHMI stations have been carried out from wet-only precipitation sampling, “bulk” type sampling was closed down. In the localities of other organizations monthly sampling (or irregular sampling) is used for measuring concentrations in precipitation (“bulk” type) in the open area (or throughfall). The detailed information on individual localities and sampling types is presented in Table III.4.

Wet deposition charts were compiled for selected ions on the basis of all-round chemical analyses of wet only precipitation samples, specifically for SO42-- S, NO3-- N, NH4+- N, H+ (pH), F-, Pb2+, Cd2+ and Ni2+ .

The above ions were selected to represent deposition fields with regard to their considerable impact on the various spheres of the environment. Wet deposition charts for each of the ions were derived from the field of ion concentrations in precipitation (based on annual mean concentrations weighted by precipitation totals calculated from the data observed), and from the field of annual precipitation totals which was generated on data from 750 precipitation gauging stations, taking into account the altitude’s effect on precipitation amount. When constructing wet deposition fields, results of wet-only samples analysis are preferred to “bulk” samples with dustfall, and weekly samples are preferred to monthly samples. Data from the network stations operated by ÄŚGS, VĂšV, VĂšLHM and KRNAP based on monthly “bulk” sampling with dustfall (see Table III.4) are modified by empirical coefficients expressing the individual ions’ ratios in “wet-only” and “bulk” samples (values for each of the ions from 0.74 for NH4+ to 1.06 for H+) for the purpose of the development of the wet deposition charts. The fact that in case of H+ cations the ratio is higher than 1, can be explained in the following way: the solid particles contained in the “bulk” type samples react with hydrogen cations, which results in their decreasing concentration [48].

In addition to wet deposition, also dry deposition charts are presented for sulphur, nitrogen, hydrogen ions, lead and cadmium. The maps of total annual deposition are presented for sulphur, nitrogen and hydrogen ions.

Dry sulphur and nitrogen deposition was calculated using fields of annual mean SO2 and NOx concentrations for the Czech Republic, and the deposition rates for SO2 0.7 cm.s-1/0.35 cm.s-1, and NOx 0.4 cm.s-1 / 0.1 cm.s-1, for the forested/unforested areas [49].

Total deposition charts were produced by adding S and N wet and dry deposition charts. The wet hydrogen ion deposition chart was compiled on the base of pH values measured in precipitation. Dry hydrogen ion deposition reflects SO2 and NOx deposition based on stechiometry, assuming their acid reaction in the environment. The total hydrogen ion deposition chart was developed by summation of wet and dry deposition charts.

The average deposition fluxes of S, N and H are presented in the Table III.1.

Throughfall sulphur deposition chart was generated for forested areas from the field of sulphur concentrations in throughfall and a verified field of precipitation, which was modified by a percentage of precipitation amounts measured under canopy at each station (61–90 % of precipitation totals in an open area for the year 2012). Throughfall deposition generally includes wet vertical and horizontal deposition (from fogs, low clouds and rime) and dry deposition of particles and gases in forests. In case of sulphur, its circulation within the forests is negligible; it should provide a good estimate of total deposition.

The fields of dry deposition of Pb and Cd contained in SPM (dry Pb and Cd deposition) were derived from the fields of these metals’ concentrations in the ambient air (or on the basis of air pollution field of annual average of PM10 concentrations and values of IDW interpolation of the shares of the respective metal in dust). The deposition rate of Cd contained in SPM was taken as 0.27 cm.s-1 for a forest and 0.1 cm.s-1 for unforested terrain; the figures for Pb are 0.25 cm.s-1 for a forest and 0.08 cm.s-1 for unforested terrain [49].

The data on precipitation quality are controlled routinely using the method of ion balance calculation. The difference between the sum of cations and the sum of anions in the sample should meet the allowable criteria which differ slightly in various organizations.

Another control is carried out by comparing the calculated conductivity and the measured conductivity which both should also meet the allowable criteria.

Analysis of the blank laboratory samples is also used and blank field samples are monitored and assessed continuously. This enables the control of work during sampling and the control of changes occurring due to transport, manipulation, storage and preparation of the samples prior to the chemical analysis.

Results

  • The precipitation in the year 2012 for the territory of the Czech Republic was slightly above the long-term normal; it amounted to 689 mm in the average, which represents 102 % of the long-term normal (for the years 1961–1990). As compared with the year 2011 the total precipitation was higher.
     

  • Wet sulphur deposition decreased after 1997 below 50,000 t and this trend continued up to 1999. In 1999–2005 the values remained more or less at the level of 1999 with the exception of lower depositions in 2003 when there was recorded subnormal total precipitation. Starting from 2005 the decreasing trend continued. In 2012 the level of wet deposition in the territory of the Czech Republic was somewhat higher as compared with the year 2011. However, the 2012 level was the third lowest value measured since 1995 (after the year 2003 and 2011). In 2012, the highest values of wet sulphur deposition were recorded in the mountainous areas (the JizerskĂ© hory Mts., the Krkonoše Mts., the OrlickĂ© hory Mts. and the MoravskoslezskĂ© Beskydy Mts.).
     

  • Dry sulphur deposition recorded its most significant decline in the year 1998 (the value decreased by 45 % in comparison with the average for the period 1995–1997), and continued to decline in 1999–2000. In 2000–2006 the deposition field remained at the same level, which is coherent with SO2 concentrations in the ground-level ambient air. In 2007 the dry sulphur deposition further decreased, which resulted from the reduction of air pollution concentrations due to more favourable meteorological and dispersion conditions. Beginning from 2008 the levels of dry deposition remained at the level of the year 2007, the slight increase in 2010 was connected with the growth of the measured SO2 concentrations. In 2011 dry sulphur deposition slightly decreased again and this decreasing trend continued in 2012. The field of total sulphur deposition represents the sum of wet and dry depositions and it shows the total sulphur deposition amounting to 45,675 t for the Czech Republic’s territory for the year 2012 (see Table III.2). After the previous decrease from the values markedly above 100,000 t, in 2000–2006 the sulphur deposition remained within the range from 65,000 to 75,000 t per year with the exception of the year 2003 which was markedly below normal as for the precipitation (see Fig. III.21–22). Since 2007 the value of total sulphur deposition has ranged around 50,000 t of sulphur for the Czech Republic’s territory. The total sulphur deposition reached the maximum values in the KrušnĂ© hory Mts. area.
     

  • The throughfall sulphur deposition, similarly as in the previous years, reached the maximum values in the KrušnĂ© hory Mts. In some parts of the mountains in the Czech Republic the values of throughfall deposition reach, in the long-term, higher values than the values of the total sulphur deposition determined as the sum of wet (only vertical) and dry deposition from SO2. The increased contribution can be attributed to deposition from fog, low clouds and rime (horizontal deposition) which is not included in total summary deposition because of uncertainties. Hoarfrost and fog are normally highly concentrated and may significantly contribute to sulphur and other elements’ deposition in mountainous areas and areas with frequent fogs (valley fogs, fogs near water courses and lakes). The problem is in a very erratic character of this type of deposition from place to place where some uncertainties may occur when extrapolating to a wider area. For sulphates, the deposition from fogs and rime in the mountain areas is stated in the range 50–90 % of the “bulk” type deposition in the average for a longer period (several years) [50, 51]. In some individually assessed years the relation of the sulphates deposition from fog and rime and “bulk“ type deposition exceeded even 100 %.

    Further, the throughfall deposition includes also the contribution from dry deposition of S from SO4-2 of suspended particles. Based on the data on sulphates concentration in aerosol for the year 2012 from two stations (Svratouch and Košetice) and on the application of the deposition rate 0.25 cm.s-1[49] dry deposition of S from SO4-2 reached the average value 0.06 g.m-2.year-1 for forested areas. Due to the limited number of localities monitoring the sulphates concentrations in aerosol, this is a very rough estimate.

    The map of throughfall deposition can be regarded as an illustration what values the total sulphur deposition (including the horizontal deposition and dry deposition of S from SO4-2 of suspended particles) can reach, because in sulphur, unlike other pollutants, the inner circulation in vegetation is negligible.

    Since 2008 the throughfall deposition is calculated with the use of the layer from the geodatabase ZABAGED of the Czech Office for Surveying, Mapping and Cadastre – ČÚZK (a finer grid 500x500 m) with the total forests area achieving 26,428 km2. Therefore, also total values of throughfall deposition since 2001 were recalculated with the use of the new layer of forests, in order to carry out the comparison with the data after the year 2007 (see Table III.3). Throughfall sulphur deposition on the forested surface of the Czech Republic reached the amount of 19,079 t in 2012.
     

  • The map of wet deposition of reduced (N/NH4+) and mainly oxidized (N/NO3-) forms of nitrogen shows their apparent increase in comparison with the year 2011 caused by higher total precipitation. The maximum values of wet deposition of oxidized forms were reached in the territory of the Krkonoše Mts. (the localities HříbÄ›cĂ­ and RĂ˝chory), the values of wet deposition of reduced forms were recorded also in the Krkonoše Mts. (the locality HříbÄ›cĂ­). The highest values of total wet nitrogen deposition were recorded in the area of the Krkonoše Mts., and further in the OrlickĂ© hory Mts., the JizerskĂ© hory Mts., the HrubĂ˝ JesenĂ­k Mts. and the Ĺ umava Mts. The total wet deposition of the oxidized forms of nitrogen amounted to 23,796 t in for the area of .the Czech Republic. Dry deposition of oxidized forms of nitrogen was declining up to the year 2002 (when the value reached 48 % of the value of the average for the years 1995–1997). Afterwards, certain stagnation was recorded. After a slight increase of dry deposition of oxidized forms of nitrogen in 2010–2011 there occurred the decrease in 2012.

    In 2012 the total nitrogen deposition reached 75,133 t of N (ox+red). year-1 for the area of the Czech Republic (see Table III.2) and thus in comparison with the year 2011 it increased. The highest values of total nitrogen deposition were reached in the Krkonoše Mts., the Orlické hory Mts., the Jizerské hory Mts., the Moravskoslezské Beskydy Mts. and the Krušné hory Mts.
     

  • The wet deposition of hydrogen ions markedly decreased over the recent 15 years; it reached the lowest value in 2011 In 2012 there occurred a slight increase probably due to higher total precipitation. The highest values were reached in the territory of the Krkonoše Mts., the JizerskĂ© hory Mts., the OrlickĂ© hory Mts., the HrubĂ˝ JesenĂ­k Mts., the MoravskoslezskĂ© Beskydy Mts. and the Ĺ umava Mts. The map of dry deposition of hydrogen ions shows the similar character as in the previous years. The maximum values were reached in the KrušnĂ© hory Mts. and in the territory of the Moravian-Silesian Region. In the second half of the 90’s of the last century both wet and dry depositions of hydrogen ions decreased by 50 % per the whole area of the Czech Republic, the decrease of dry deposition of hydrogen ions values was in coherence with the decrease of dry deposition of SO2–S and NOx–N. Fig. III.21 shows a gradual decrease of deposition of hydrogen ions since 1996.
     

  • After the year 2000 when the distribution of leaded petrol was finished the values of the deposition of lead ions markedly decreased. Wet deposition of lead decreased in 2012 in the whole territory of the Czech Republic as compared with the year 2011. The highest values were reached in the territory of the MoravskoslezskĂ© Beskydy Mts. Dry deposition of lead reached the same level in 2012 as in 2011 when the highest values were reached in the area of Ostrava and the MoravskoslezskĂ© Beskydy Mts.
     

  • The wet deposition of cadmium increased as compared with the year 2011. The highest values were reached in the territory of the Krkonoše Mts. (locality Souš) and OrlickĂ© hory Mts. (the locality U dvou koÄŤek). The map of dry deposition of cadmium ions shows also the slight increase in comparison with the previous year.
     

  • The 2012 map of annual wet deposition of nickel ions shows the apparent increase. The highest values were reached in the territory of the JizerskĂ© hory Mts., Krkonoše Mts., KrušnĂ© hory Mts., SlavkovskĂ˝ les Mts., ÄŚeskĂ˝ les Mts. and Ĺ umava Mts.
     

  • The highest levels of wet deposition of chloride ions were recorded similarly as in the previous years in the locality Podbaba.
     

  • The wet deposition of fluoride ions shows the highest values in southern Bohemia and in the MoravskoslezskĂ© Beskydy Mts.

The development of annual wet deposition of the main elements as measured at selected stations in the Czech Republic (Fig. III.23) after the decrease of wet deposition of several components (mainly sulphates, hydrogen ions and lead ions) in the second half of the 90’s, shows stagnation instead. The decrease of sulphate deposition was apparent both at the relatively exposed suburban stations and at the background stations, e.g. Košetice and Svratouch.

With the development of sulphur and nitrogen deposition the development of the proportion of both elements can be observed in atmospheric precipitation connected with the development of emissions of individual pollutants. Since the second half of the 90’s a slight increase of nitrates and sulphates proportion has been observed at some stations The development of this proportion over the recent 15 years for the CHMI stations is shown in Fig. III.22.

Tab. III.1 Average deposition fluxes of S, N and H in the Czech Republic, 2012

Tab. III.2 Estimate of the total annual deposition of the given elements on the area of the Czech Republic (78,841 sq. km) in tonnes, 2012

Tab. III.3 Estimate of the total annual deposition of sulphur on the forested part of the Czech Republic (26,428 sq. km) in tonnes, 2001–2012

Tab. III.4 Station networks monitoring atmospheric precipitation quality and atmospheric deposition, 2012


Fig. III.1 Station networks monitoring atmospheric precipitation quality and atmospheric deposition, 2012

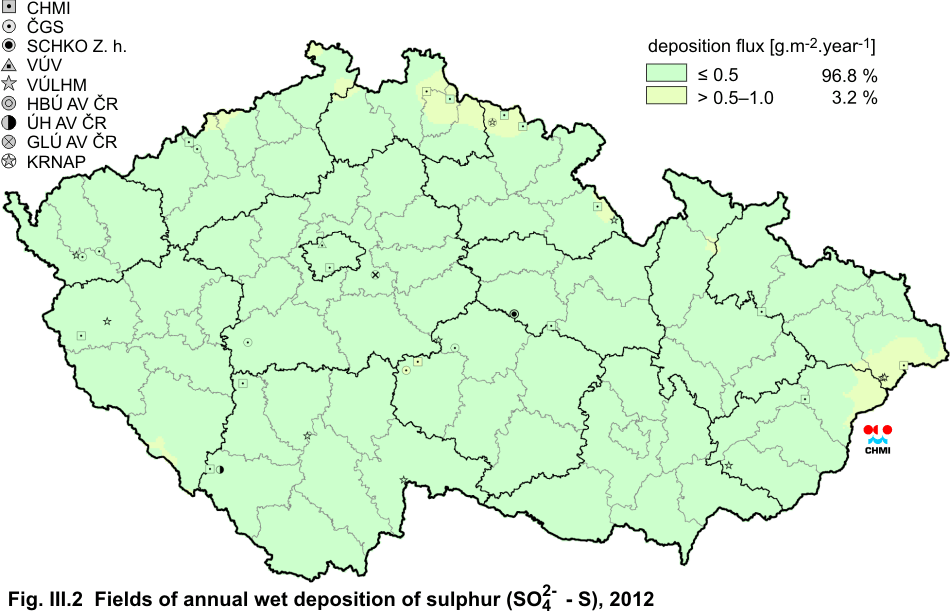
Fig. III.2 Fields of annual wet deposition of sulphur (SO42-–S), 2012

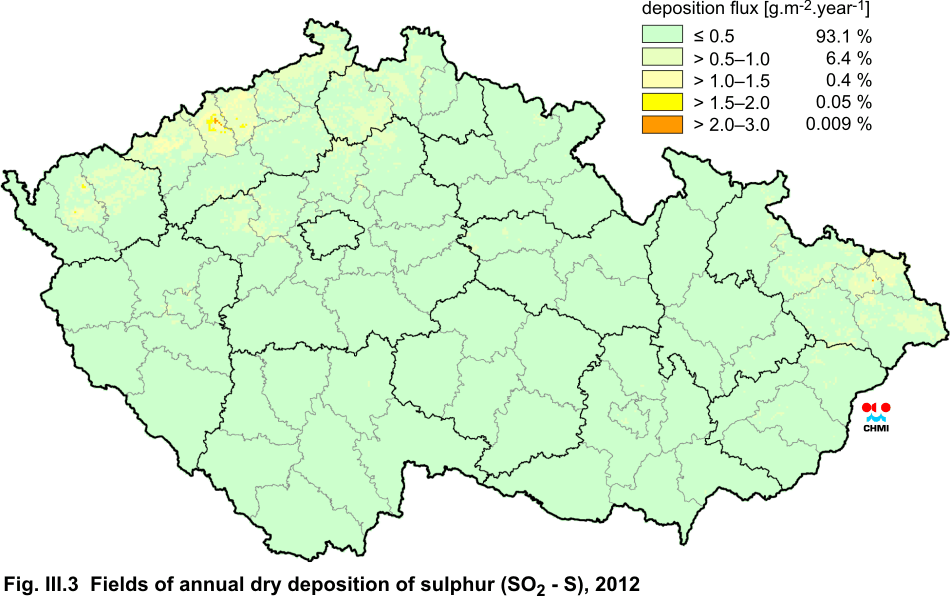
Fig. III.3 Fields of annual dry deposition of sulphur (SO2–S), 2012

Fig. III.4 Fields of annual total deposition of sulphur, 2012

Fig. III.5 Fields of annual throughfall deposition of sulphur, 2012

Fig. III.6 Fields of annual wet deposition of nitrogen (NO3-–N), 2012

Fig. III.7 Fields of annual wet deposition of nitrogen (NH4+–N), 2012

Fig. III.8 Fields of annual total wet deposition of nitrogen, 2012

Fig. III.9 Fields of annual dry deposition of nitrogen (NOx–N), 2012

Fig. III.10 Fields of annual total deposition of nitrogen, 2012

Fig. III.11 Fields of annual wet deposition of hydrogen ions, 2012

Fig. III.12 Fields of annual dry deposition of hydrogen ions corresponding to SO2 and NOx deposition, 2012

Fig. III.13 Fields of annual total deposition of hydrogen ions, 2012

Fig. III.14 Fields of annual wet deposition of fluoride ions, 2012

Fig. III.15 Fields of annual wet deposition of chloride ions, 2012

Fig. III.16 Fields of annual wet deposition of lead ions, 2012

Fig. III.17 Fields of annual dry deposition of lead, 2012

Fig. III.18 Fields of annual wet deposition of cadmium ions, 2012

Fig. III.19 Fields of annual dry deposition of cadmium, 2012

Fig. III.20 Fields of annual wet deposition of nickel ions, 2012

Fig. III.21 The development of annual deposition of sulphur (SO42-–S, SO2–S) and oxidated forms of nitrogen (NO3-–N, NOx–N)  and hydrogen in the Czech Republic, 1995–2012

Fig. III.22 The development of the ratio of nitrate/sulphate concentrations in atmospheric deposition (expressed as μeq. l-1) at the CHMI stations, 1998–2012

Fig. III.23 The development of annual wet deposition at selected stations in 1991–2012, Czech Republic