|
|
AIR POLLUTION IN THE CZECH REPUBLIC IN 2002 Czech Hydrometeorological Institute - Air Quality Protection Division |
|
|
|
|
2.3. Assessment of Air Pollution in the Czech Republic Based on the
Federal Committee for the Environment Decree of 1991
Assessment of the status of the air pollution is based on air pollution limit
values as specified in the Decree of the Federal Committee for the Environment
of October 1, 1991, attached to Act No. 309/1991 Coll., the Clean Air Act in the
wording of Act No. 211/94 Coll. (This Table has been copied over from the above
Decree, with some formal modifications.)
The field of annual arithmetic means of NOx concentrations was produced by combining the measured NOx concentrations with statistically supported estimates of ambient air pollution level in localities not covered by adequate measurements, taking into account the categorisation of the country�s territory in terms of emission densities and Symos�97 model. Combined map presentation using an estimation of the spatial distribution of fields of the ambient air pollution characteristics along with an indication of data measured at measuring stations (spot symbols method1) [6] was used in 2002 for the presentation of the spatial distribution of annual arithmetic means of NOx. In case of SPM annual mean concentration and 95th percentiles of NOx only spot symbols were used. In the maps automated monitoring stations (AMS) are differentiated from manually operated stations. When constructing the map of NOx concentration field, the main emphasis was laid on AMS stations. In most cases, values collected from manually operated stations were used solely as complementary information, especially in less afflicted areas. The share taken by the respective concentration category, expressed as a percentage of the area afflicted is specified for each category on the map showing the field of NOx concentrations. In the map presenting the annual arithmetic mean of suspended particles with the use of spot symbols the AMS stations measuring PM10 fraction were converted to SPM (coefficient 1.2) and identified with other symbol. Presented in this part are also tables that list stations with the highest relative frequency of short-term IHk exceedence and with the highest values of 95th percentiles of half-hour SPM and NOx concentrations. Also tabulated are overviews of the maximum daily concentrations (including date of occurrence), highest annual arithmetical means, highest relative frequency of IHd exceedence, and the highest values of 95th percentiles of daily SPM and NOx concentrations. When the frequency of the daily ambient air pollution limit exceedence was markedly higher for only one pollutant in a given region, the table contains, for the purpose of clarity, the values for the other pollutant as well. This part also contains a table of the highest half-hour SPM and NOx concentrations recorded at Czech stations in 2002. The maps and tables list only the stations for which the calculated ambient
air pollution characteristics have satisfied the conditions of publication (see
the Tabular Survey [2]).
Note: 2.3.1 Air pollution situation based on individual pollutants Suspended particulate matter SPM pollution in the Czech Republic in 2002 is illustrated in the spot symbols map of annual arithmetic means with the depiction of the measured and recalculated concentration values at the stations (Fig. 2.3.1). In 2002, similarly as in previous years, the highest SPM limit values
exceedences occurred in Prague and at two Public Health Service stations exposed
to traffic (Prague 8-Sokolovská and Prague 5-Svornosti). These stations recorded
a five-fold increase in exceedence of the relative frequency (daily limit value)
as compared with the previous year 2001 (Table 2.3.4). Exceeded SPM values were
also recorded in Vyškov (South Moravian Region), three Public Health Service
stations in Kladno and three stations in the eastern part of the Moravian-Silesian
Region (Tables 2.3.3,
2.3.4, and 2.3.5). Especially in the Moravian-Silesian Region the exceedence of the SPM limit value (annual arithmetic mean) was recorded at
several AMS after recalculation from PM10 fraction (Fig. 2.3.1). Nitrogen oxides Maps of annual arithmetic means and 95th percentiles of daily concentrations with the indication of the measured values at the stations illustrate NOx pollution in the Czech Republic in 2002 (Figs. 2.3.2 and 2.3.3). On 88 % of the country�s territory the annual arithmetic means of NOx concentrations reached 20 μg.m-3 at the maximum. The heaviest NOx pollution has always been recorded in Prague, where in the
past years the daily air pollution limits were exceeded in more than 5 % of
cases at almost all stations. This is characteristic also for 2002: the highest
exceedences were recorded again at two Prague Public Health Service stations
exposed to traffic, this year together with the AMS Beroun (Tables
2.3.3, 2.3.4, and
2.3.5).
These exceedences (95th percentile) were recorded also at other stations in
Prague, at some urban stations in northwestern and central Bohemia, in the
eastern part of the Moravian-Silesian Region and in Hradec Králové, Brno and
Zlín. Carbon monoxide The highest relative exceedence frequency of the daily limit value (IHd) was recorded again at two Public Health Service stations: Prague 5-Svornosti (31.6 %) and Prague 8-Sokolovská (19.6 %). Close below the tolerated number of IHd exceedences was the station Prague 5-Řeporyje (4.6 %). The high relative frequencies of CO limit values exceedences correspond to the high relative exceedence frequencies of limit values for NOx and SPM at these stations. The absolute half-hour maxima were recorded at Public Health Service stations
Svornosti and Řeporyje in Prague 5, Prague 8-Sokolovská and Národní muzeum and
Rytířská in Prague 1. Concentrations presented in the database (62–500 μg.m-3)
correspond to the gauge of the used measuring instruments at the above Public
Health Service stations. Thus it is probable that in a number of cases even
higher half-hour maxima might have been recorded. The AMS CHMI stations in
Prague and other stations in the Czech Republic did not record such high short-term
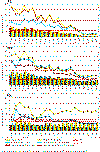
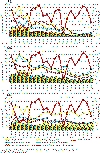
CO concentrations. 2.3.2 Development of air pollution over the longer term based on the limit values set in the Federal Committee for the Environment Decree of 1991 Fig. 2.3.4 illustrates the development of annual air pollution characteristics of basic pollutants monitored in the long term (1982–2002) for the northwest area, Prague and the Moravian-Silesian Region. Generally, beginning from the year 1988 a downward trend can be observed, both in SO2 and SPM, in air pollution of the Czech Republic and this decrease is markedly significant after 1996. After 1996 the decrease in NOx pollution is apparent in the northwest area and in the Moravian-Silesian Region as well. In Prague this trend was observed from 1997 until 2001. In 2002 this decreasing trend was broken by a slight increase of NOx concentrations. In respect to air pollution caused by SO2 the monitored areas reported stagnation of this type of air pollution in 2002. A slight increase of air pollution caused by SPM occurred in the Moravian-Silesian Region and in Prague. Fig. 2.3.5 presents the long-term development of air pollution and the course
of temperatures in winter seasons. When comparing the course of temperature of
the winter season of 2002/2003 with comparable winter seasons of 1992/1993 and
1983/1984 a marked decrease of SO2 is evident in Prague, northwest Bohemia and
in the Moravian-Silesian Region. Also evident is the decrease of air pollution
caused by SPM in Prague and the Moravian-Silesian Region. In northwestern
Bohemia the recorded values of air pollution caused by SPM are equal in the
monitored periods. This applies also to nitrogen oxides: the three areas
reported equivalent NOx levels during the comparable winter seasons 1992/1993
and 2002/2003. Tab. 2.3.2 Highest daily pollutant concentrations at stations in the Czech Republic in 2002 Tab. 2.3.4 Stations with highest relative frequency of IHd exceedence, the Czech Republic, 2002 Tab. 2.3.8 Highest half-hour (3-hour) pollutant concentrations at stations, the Czech Republic, 2002 Fig. 2.3.1 Annual arithmetic means of concentrations at stations, SPM, 2002 Fig. 2.3.2 Fields of annual arithmetic means of concentrations with presentation of measured values at stations, nitrogen oxides, 2002 Fig. 2.3.3 95th percentiles of daily concentrations at stations, nitrogen oxides, 2002 Fig. 2.3.4 Annual assessment for 1982–2002 in Prague, Northwest Region and Moravian-Silesian Region Fig. 2.3.5 Assessment of 1982/1983–2002/2002 winter seasons in Prague,
Northwest Region and Moravian-Silesian Region
|


