XI. AIR QUALITY EVALUATION
XI.1 BASIC SOURCES FOR AMBIENT AIR QUALITY EVALUATION
The evaluation of air quality set forth in this yearbook covers the entire territory of the Czech Republic. Documentation of compliance with legal requirements including areas where none of the pollution limit values are exceeded is one of the fundamental principles of Directive 2008/50/ES. Where the targets for ambient air quality stipulated in this Directive are not met, the member states are obliged to take measures towards compliance with the pollution limit values and long-term air pollution targets.
In this yearbook, the level of air pollution is documented mainly by maps of the territorial distribution of air pollution characteristics. The monitoring stations are represented in the maps by differently shaped symbols, where the colours of the symbols are differentiated according to the levels of the measured concentrations. Red symbols indicate substantial exceeding of the pollution limit level; other basic thresholds between categories consist in the lower and upper assessment limits.
The diagram maps clearly depict the trends in pollution level characteristics in 2006–2016 where the name of the station is highlighted in red when the pollution level limit was exceeded in 2016.
The graphs of trends in the pollution characteristics of selected pollutants in agglomerations and over the entire territory of the Czech Republic since 2000 show long-term trends in the air pollution levels. The depicted values were calculated as the average of the average concentrations at only those monitoring stations in the relevant territory that measured the monitored substance throughout the entire evaluated period.
The tables in the Annexes for the individual pollutants list locations with the highest values of the air pollution characteristics in 2016. The values are ordered according to decreasing values, where a grey background indicates exceeding of the pollution limit level.
The concentrations measured at the monitoring stations form the basis for evaluation of the air quality. The monitoring network is densest in areas with the highest pollution concentrations but nonetheless covers the entire Czech Republic. The National Air Quality Monitoring Network (NAQMN), operated by CHMI, forms the backbone of monitoring stations. It consists of both automated monitoring stations (AIM) and manual monitoring stations (MIM), from which samples are analysed in the CHMI laboratories. At many locations, the air pollution is monitored simultaneously by both automatic and manual methods. The national pollution monitoring network is supplemented by the monitoring stations of other organisations and their measurements are also employed in evaluating the air quality. In 2015, NAQMN was entirely updated, with modernisation of measuring and laboratory techniques and construction of new stations, with modification of the measuring programme (Chap. XI.7).
The air quality was evaluated for this yearbook em-ploying the calculation criteria in Annex I of Directive 2008/50/ES and Annex IV of Directive 2004/107/ES. These annexes set the data quality targets for ambient air quality assessment. According to Annex I of Directive 2008/50/ES and Annex IV of Directive 2004/107/ES, air quality may be evaluated only using data from monitoring stations at which the requirement of minimum data collection of 90% was met, not including losses of data as a consequence of regular calibration or normal maintenance of the instrumental technology. Without prejudice to Annex I of Directive 2008/50/ES, data collection and calculation of statistical parameters are based on the criteria set forth in Annex XI of this Directive. As a consequence of these changes, some of the data presented in earlier yearbooks may differ slightly from the data pre-sented in this yearbook.
XI.2 CLASSIFICATION OF STATIONS
The Eol classification of measuring stations forms an important basis in creation of maps of pollution characteristics and evaluation of ambient air quality. This official European classification has been applied to all locations in the Czech Republic registered in the Air Quality Information System (AQIS). Complete classification of locations according to Eol consists of three basic letters separated by a stroke, specifying the type of location, type of area and characteristics of the area. The third column only gives examples of combinations of area characteristics; in fact, any logical combination is possible, where the first letter has the highest priority (Tab. XI.2). Further information on the classification of stations, including the legislation, is presented in the 2016 Summary Tabular Survey (CHMÚ 2017).
The number of air quality monitoring stations for basic pollutants of selected organisations whose data are stored in AQIS has changed continuously since 1969. The greatest number of stations was in operation in the 1980's and 1990's. At the present time, most stations in the territory of the Czech Republic are operated by CHMI within the National Air Quality Monitoring Network (Fig. XI.2).
NAQMN also includes four stations designated as “hot spots”, which is generally used to designate locations or areas with high air pollution. In AQIS and the yearbook, this term refers to stations focused exclusively towards monitoring the effects of traffic on air pollution (par. A.2 of Annex No. 3 to Decree No. 330/2012 Coll.). CHMI operates "hot spot" monitoring stations at locations with heavy traffic levels in Prague, Brno, Ostrava and Ústí nad Labem.
XI.3 AIR QUALITY INFORMATION SYSTEM – AIR POLLUTION DATABASE AND
DATABASE OF THE CHEMICAL COMPOSITION OF PRECIPITATION
The concentrations measured at the pollution monitoring stations are stored in the AQIS air pollution database. Data have been stored in AQIS since the beginning of monitoring. Concentrations of sulphur dioxide and suspended particulate matter obtained from stations of the CHMI network in northern Bohemia, Prague and the O/K/F-M agglomeration have been stored since 1969. AQIS also administers detailed descriptive data on the monitoring locations, on monitoring programmes and methods and on monitoring classification and quality.
AQIS is being continuously developed and operated using state-of-the-art information technology such as the integrated system for country-wide comprehensive evaluation of the state and trends in air pollution; this includes collection, storage and processing of data from the automated and manual monitoring network of the Czech Republic (air pollution database and database of the chemical composition of precipitation) and also storage and processing of data on emissions and air pollution sources (emission database). Together with the air pollution data, the accompanying meteorological data, measured at a major number of automated CHMI monitoring stations and used for evaluation of air pollution – meteorological relationships, are also stored in the air pollution database.
In addition to the results of CHMI monitoring, carried out by the pollution monitoring staff at the headquarters and at regional branches, the AQIS air pollution database and the database of the chemical composition of precipitation also include data provided by cooperating institutions. These mainly comprise the health institutes, ČEZ, a. s., the Forestry and Game Management Research Institute, v.v.i., the Czech Geological Survey, the Institute of Hydrobiology, municipal authorities and other contributors (Tab. XI.1). AQIS also collects information from border areas of Germany and Poland, obtained through reciprocal data exchange.
XI.4 AIR QUALITY INFORMATION SYSTEM – EMISSION DATABASE
CHMI is responsible for methodical development and annual country-wide processing and storage of records in an emission database. In a time series since 1984, the emissions part of AQIS stores reported annual emission data and accompanying technical data for the most important group of operators (formerly very large and large sources, designated as REZZO 1). Since the 1990's, the database has also encompassed data on sources classified by the previous legislation among medium- sized pollution sources (formerly REZZO 2 sources). Collection of reported data on stationary sources specified in Annex No. 2 to the Air Protection Act is performed through the Integrated System of Fulfilment of Notification Obligations (ISPOP), introduced by Act No. 25/2008 Coll., on the integrated register of environmental pollution and integrated system of fulfilling notification obligations in the area of the environment and amending some laws.
The classification of facilities into categories REZZO 1 and REZZO 2 is based on the form for data reported in the summary operating records for 2016, where the simplified form was used for approx. 40% of the reports (the conditions are stipulated in the introductory text to Annex No. 11 of Decree No. 415/2012 Coll., on the permissible level of pollution and its ascertainment and on implementation of some other provisions of the Air Protection Act, describing the list of data for summary operating records).
XI.5 EMISSION BALANCE
Since 1997, a methodology based on the data from the Census of the Population, Buildings and Apartments (CPBD) has been used for inventories of emissions from local household heating units. CPBD data are updated annually in cooperation with regional suppliers of fuel and energy. At the present time, the modified methodology of 2006 is used (Machálek, Machart 2007), including the CPBD 2011 results. The final output of the model consists in data on pollutant emissions and fuel composition for household heating units at the level of the individual municipalities contained in the REZZO 3 database. In addition to local household heating, the REZZO 3 database also contains recalculated data on emissions from other stationary sources not mentioned in Annex No. 2 of the Air Protection Act, which include large-scale use of solvents and agricultural and construction activities.
The inventory of mobile sources (REZZO 4) includes emissions in the exhaust gases of road, rail, water and air transport, calculated according to the internal method of the Transport Research Centre (CDV) in Brno, v.v.i., emissions from abrasion of tyres, brakes and roadways and petrol emissions from fuel systems, both calculated according to international methodologies. It also includes inventories for off-road mobile sources (agriculture, construction, etc.), processed using data on fuel consumption (CSO) and emission factors (e.g. for agricultural machinery according to them methodology of the Research Institute of Agricultural Engineering Prague, v.v.i.).
XI.6 AQIS TIES TO DATA SOURCES AND THE PRESENTATION OF DATA
AQIS is linked to data sources and cooperating systems, primarily to air quality monitoring systems, sources of the reported data and cross-sectional information systems. The interconnection takes place particularly through exchange of data by e-mail, on magnetic media, over switched data lines and, for data from the automated monitoring network, primarily through the use of radio transmissions (Fig. XI.1).
Selected information, tables, graphs and map presentations from the Summary Tabular Survey and from the graphic yearbook of Air Pollution in the Czech Republic in 2016 are available on the CHMI website (www.chmi.cz), along with other surveys, including graphical depiction related to air pollution. With a brief delay, the Air Quality selection also provides up-to-date results of measurements from the CHMI automated monitoring stations and other organisations in tables, the air quality index, graphs and estimates of the spatial distribution of PM10, SO2, NO2 and O3 concentrations.
XI.7 UPGRADING OF THE NATIONAL
AIR QUALITY MONITORING
NETWORK
The National Air Quality Monitoring Network (NAQMN) underwent a major upgrading in 2015, the largest one since the establishment of countrywide automated air quality monitoring in the first half of the 1990's. Within the Operational Programme Environment, CHMI implemented a project of comprehensive upgrading of the air quality monitoring and evaluating technology throughout all of the Czech Republic. In addition to the instrumentation, the containers of the automated stations were also upgraded, including the masts for meteorological sensors. The monitored locations and scope of measurements were selected in accordance with the valid legislation, in particular in relation to the need for country-wide air quality evaluation. Optimisation of the monitoring network led both to reduction or termination of measurements at some locations and also to the moving or construction of 10 completely new monitoring stations at sites where continuous air quality monitoring was lacking and where it is required for mapping and evaluating air quality in the territory of the Czech Republic. Thus, the monitoring programs at five locations were changed from manual to automatic, providing not only more detailed information on air quality but also ensuring greater public awareness of the current air pollution situation. Upgrading of NAQMN was commenced in the middle of February and completed on 30 September 2015.
Within the project, 98 monitoring stations were updated (Fig. XI.3) and new samplers were separately installed at a further 27 locations for taking samples intended for detailed laboratory analysis (Fig. XI.4). In addition, 14 precipitation collectors were acquired for subsequent chemical analysis of precipitation water. Nearly 500 devices were replaced. The replacement of containers at automated stations placed great demands on the logistical aspects of the whole undertaking, where it was necessary to coordinate the work of several suppliers and frequently also overcome adverse weather conditions, which complicated transport and installation of containers, especially at rural locations.
New analytical instruments were acquired for the air quality laboratory, to increase the precision and reliability of laboratory analyses. The new automatic weighing boxes (Fig. XI.5), which substantially accelerated the process of weighing exposed filters, should especially be mentioned. A new workplace for identification of air pollution sources was created and was equipped with a scanning electron microscope (SEM) and an X-ray fluorescence spectrometer (Figs. Fig. XI.6 and Fig. XI.7).
The Tušimice observatory was equipped with special meteorological technology for monitoring the relations in the boundary layer of the atmosphere (meteorological sensors at several levels above the ground and acoustic radar – SODAR). The boundary layer of the atmosphere is newly monitored at AMS Třinec-Kosmos and Věřňovice using ceilometers (devices for measuring the height of the lower cloud base using a laser beam). Information from these devices is important for the work of the Smog Warning and Regulatory System and for improving the quality of air quality evaluations, especially using mathematical models of pollution transport and dispersion. A new computation server was purchased for the latter purpose.
Successful implementation of the project enables CHMI to continue to maintain a high standard of air quality monitoring and evaluation in the Czech Republic and to further improve and develop key activities in this area.
Tab. XI.1 Air pollution monitoring localities, based on the
owner, Czech Republic, 2016
Tab. XI.2 Exchange of Information (EoI) station classification

Fig. XI.1 Ties of the AQIS to data sources and co-operating
systems, 2016
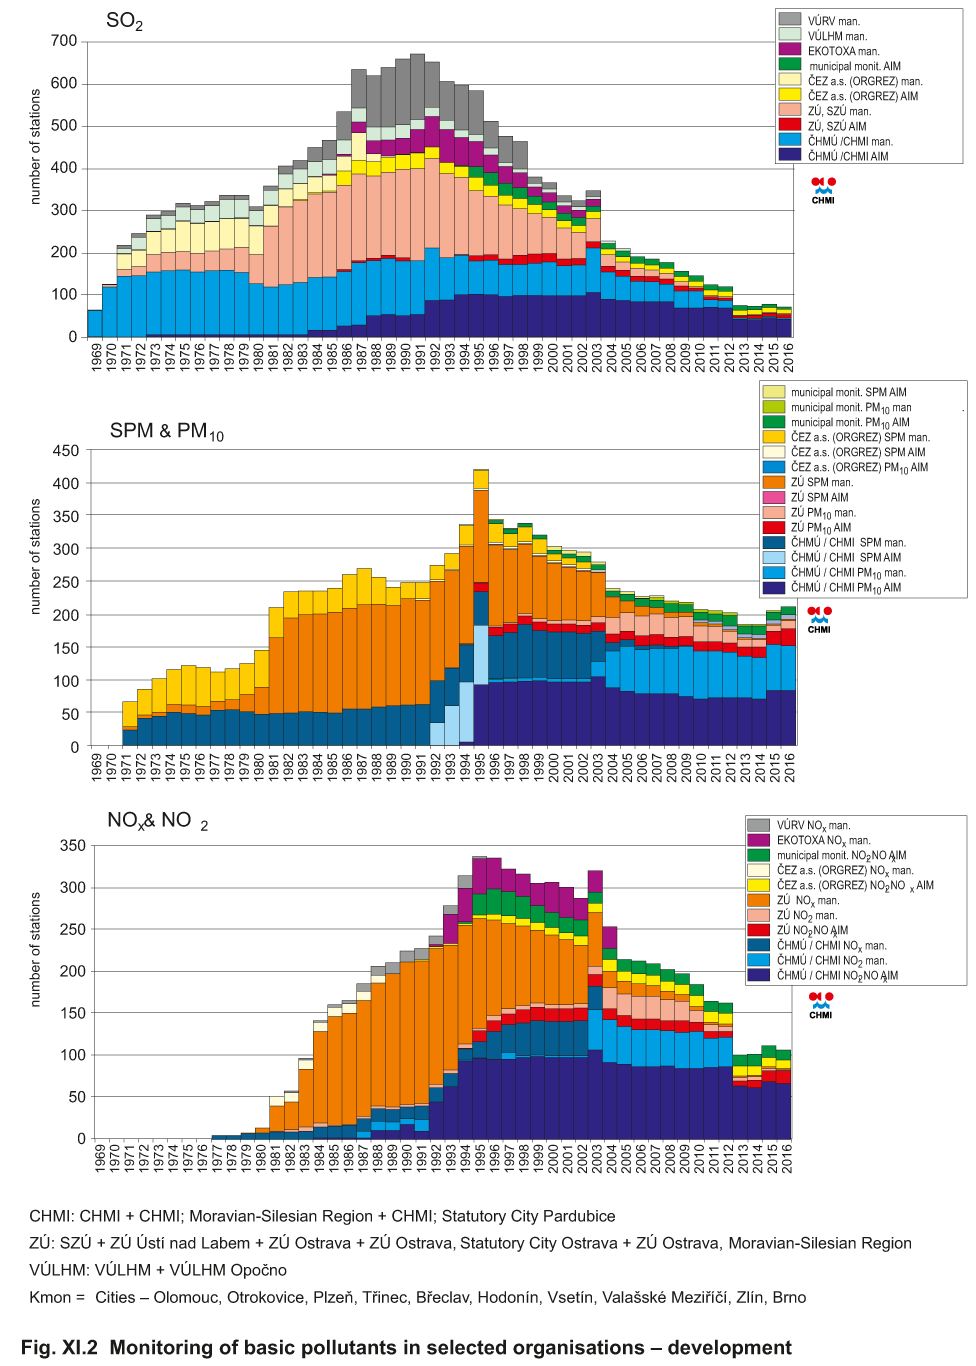
Fig. XI.2 Monitoring of basic pollutants in selected
organisations – development
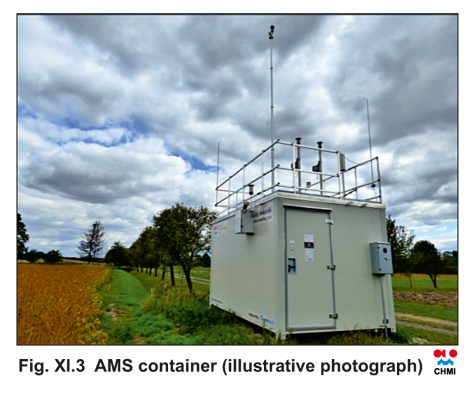
Fig. XI.3 AMS container (illustrative photograph)
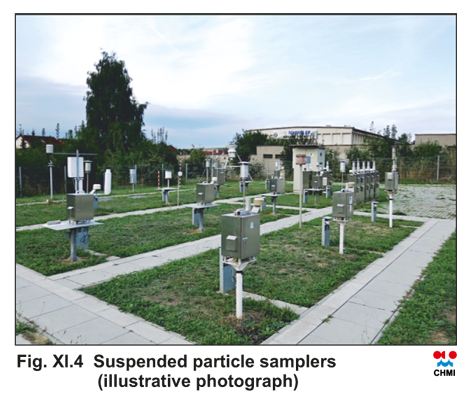
Fig. XI.4 Suspended particle samplers (illustrative photograph)
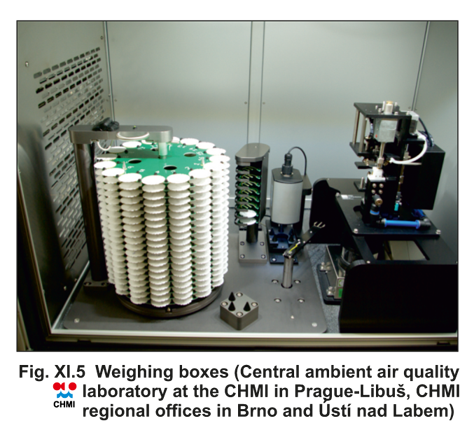
Fig. XI.5 Weighing boxes (Central ambient air quality laboratory at the CHMI in Prague-Libuš, CHMI
regional offices in Brno and Ústí nad Labem)

Fig. XI.6 Electron scanning microscope (CHMI regional office in Brno)
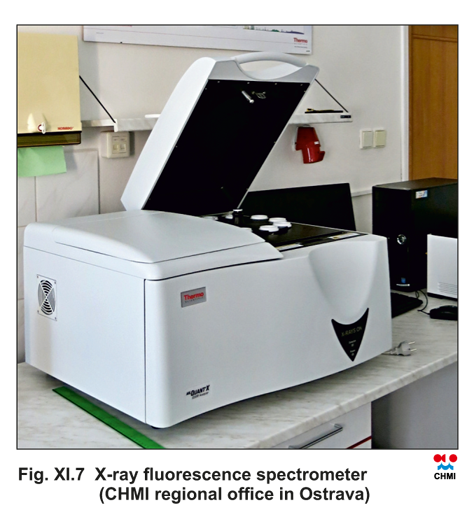
Fig. XI.7 X-ray fluorescence spectrometer (CHMI regional office in Ostrava)