X. GREENHOUSE GASES EMISSIONS
The climate system of the Earth is influenced by a number of
human activities, and the prevailing role in climate change is
ascribed to the anthropogenic emissions of greenhouse gases (GHG),
which cause the increase of the so called greenhouse effect. The
most serious impacts of the proceeding climate change include
the growing frequency of extreme climatic events (floods,
draught, windstorms), sea level rise, decreasing drinking water
availability, desertification, biodiversity reduction etc. Even
in the conditions of the Czech Republic, the progressing climate
change is manifested first and foremost by the increased
frequency of floods or by extreme temperature levels.
In 1992 the UN Conference on Environment and Development in Rio
de Janeiro developed the UN Framework Convention on Climate
Change (hereafter the Convention), which entered into force in
1994. The basic objective of the Convention was to create the
prerequisites for the timely stabilization of GHG global
concentrations in the atmosphere at a level that would prevent
dangerous interference of anthropogenic influences with the
climate system. The Convention member states meet every year at
conferences and review the accomplished progress or accept the
strategies aimed at the meeting of the set objectives.
However, as soon as in 1995 it was apparent that the commitments
set by the Convention have no specific definition, and thus the
global effect would not be sufficient. Therefore negotiations
were started with the aim to strengthen the common response to
the climate change, and two years later the so called Kyoto
Protocol, as the amendment to the Convention, was adopted at the
Third Conference of the Parties to the Convention in Kyoto in
1997. The Kyoto Protocol has its own system of meetings to
review the implementation of its commitments. With regard to the
fact that the Parties to the Kyoto Protocol are also the Parties
to the Convention, the conferences take place usually
simultaneously.
By the adoption of the Kyoto Protocol the industrialized
countries are legally bound to reduce during the first
commitment period (2008–2012), individually or jointly, their
GHG emissions in total volume by at least 5.2 % as against the
1990 levels. This reduction refers to emissions and removals of
carbon dioxide (CO2), methane (CH4), nitrous oxide (N2O), partially (HFC) and totally (PFC) fluorinated hydrocarbons and
sulphur hexafluoride (SF6), expressed in the form of aggregated
emissions of CO2. As concerns the CR there was the commitment to
reduce total GHG emissions by 8 % as against the reference year
1990 (for HFC, PFC and SF6 the year 1995 was set as the
reference year).
In December 2012 the 18th Conference of the Parties to the
Convention (COP-18) in Doha adopted the amendment confirming the
extension of the Kyoto Protocol and its second commitment period
for eight years (2013–2020). Within the second period some of
the countries agreed to accept new reduction commitments which
should contribute to the reduction of GHG emissions by at least
18 % below the level of the year 1990. As concerns the CR the
reduction commitment was set to 20 %, the EU will fulfil the
commitment set by the Convention or Kyoto Protocol within the
community.
At present the EU is engaged both in the question of emission
reduction and the possibilities of adaptation to the climate
change. The EU and its (at that time) 27 member states committed
themselves to reduce by 2020 the emissions of GHG by 20 % as
compared with the year 1990 and it even offered to increase this
commitment up to 30 % on the condition that also other world’s
top economies accept the stricter commitment. However, the
reduction by 20 % corresponds to the objective formulated in the
respective EU legislation adopted in 2009 within the so-called
climate and energy package. The climate and energy package
contains inter alia the directive updating and extending the
European Emission Trading Scheme (EU ETS). In May 2013 the text
of the new Regulation of the European Parliament and of the
Council (EU) No. 525/2013 was adopted on a mechanism for
monitoring and reporting greenhouse gas emissions and for
reporting other information at the level of EU member states.
One of the key requirements of the Convention, Kyoto Protocol
and other potential amendments is to provide timely, precise,
transparent and consistent monitoring of GHG emissions
comparable at the international level. The body responsible for
the proper operation of the national inventory system in the CR
is the Ministry of the Environment. The ministry authorized the
CHMI to coordinate the preparations of the inventory process and
be in charge of the delivery of the requested data and text
outputs published on the Convention website (http://unfccc.int)
as well as the outputs of all other member states.
Results of National GHG Inventory
In 2014 numerous recalculations were carried out which
resulted in the improvement of the quality of GHG emission
reporting. Primarily the new country-specific emission factors
for CO2 were included (sector Energy) and the improvement of the
level of quality of calculation, the so-called tier (sector
Industrial processes and Agriculture).
The total GHG emissions including their removals from the sector
Land use, land-use change and forestry (LULUCF) expressed in
equivalents of carbon dioxide (CO2 eq.), decreased in the CR
from the level 192.7 mil. tonnes in 1990 to 124.2 mil. tonnes in
2012 (Table X.1 and
Table X.2). The emissions (without LULUCF)
decreased from 196.2 mil. tonnes to 131.5 mil. tonnes, i.e.
compared with the reference year 1990 they decreased by 33 %.
Consequently, the Czech Republic fulfilled its commitment
towards the Kyoto Protocol to reduce its emissions by 8 % as
against the reference year by the year 2012.
The inventory also includes emissions of HFC, PFC and SF6 (fluorine
containing substances, so called F-gases), covered also by the
Kyoto Protocol. Their share in total GHG emissions was 1.7 % in
2012. The share of CO2 emissions in total GHG emissions (without
LULUCF) in 2012 was 84.6 %, the share of CH4 emissions was 7.8 %
and the share of N2O emissions was 5.9 %.
More detailed data on GHG emissions and removals in the CR are
presented at the CHMI website:
www.chmi.cz or in the
National Inventory Report of the Czech Republic, CHMI 2014a.
Similar information from all EU states is regularly collected
and published by EEA as reports (Annual European Community
greenhouse gas inventory 1990–2012 and inventory report 2012,
EEA 2014) and also the interactive internet database (http://www.eea.europa.eu/
data-and-maps/).
Carbon dioxide
Carbon dioxide (CO2) is the most important anthropogenic
greenhouse gas. In most industrialized countries it has the
greatest share in total aggregated emissions. In the CR the 2012
share was 84.62 % (incl. LULUCF). CO2 emissions are caused
mainly by the combustion of fossil fuels, other contributing
processes are: desulphurization, carbonate decomposition in the
production of cement, lime and glass, metallurgical and chemical
productions. Emissions and sinks (CO2 removals) occur in the
LULUCF sector. Due to forrest management policy the sinks are
still larger than emissions. Sinks or CO2 storage in industrial
processes does not take place in the CR. In the CR the largest
shares of CO2 emissions from combustion processes are
contributed by solid fuels, to a less extent liquid and gaseous
fuels.
Between 1990 and 2012 CO2 emissions decreased by 30.65 % (Fig.
X.1) which was contributed mainly by the decrease in the sectors
Energy – Manufacturing industries and Other sectors (Residential,
Commercial/Institutional). The decrease of emissions during
combustion in the sector Manufacturing industries in the early
90s was given by the depression and re-structuring of several
industrial branches, at the end of the monitored period the
emissions decreased due to saving policy and implementation of
new technologies. The emission reduction in Other sectors is the
result of more effective energy use (growing energy efficiency,
mainly thermo-insulation of buildings and economical use of
energies). On the contrary, the situation in the sector
Transport is quite different; the emissions increased more than
2.5 times as compared with the year 1990, which is given by the
development of transport, mainly of individual automobile
transport and road truck transport. The CO2 emissions
development was positively influenced by the decreasing share of
solid fuels and by the growth of the share of natural gas, and
beginning from 2003 also by the use of biomass. During the
recent years, however, the gas prices have markedly increased,
which in some localities resulted in the switch to other type of
fuels.
Methane
Anthropogenic emissions of methane (CH4) in the Czech
Republic have their origin mainly in mining and processing and
distribution of fuels; this type of source is called a fugitive
source. Other significant CH4 emission sources are as follows:
animal breeding, anaerobic decomposition of biowaste during
landfilling and treatment of waste water. Methane is created in
animal breeding during digestion processes (mainly in cattle)
and during decomposition of manure.
Methane is the second significant greenhouse gas with regard to
the production in the CR. Its share in total aggregated
greenhouse gas emissions (including LULUCF) represented in 2012
roughly 8 %. In 1990–2012 CH4 emissions decreased by 42.57 % (Fig.
X.2), which was caused mainly by the reduction of coal mining
and of the livestock numbers, to a lesser extent also by lower
consumption of solid fuels in households. The increase of
emissions in the Waste sector is reduced by the use of landfill
gas or biogas for energy production.
Nitrous oxide
The largest amount of nitrous oxide (N2O) emissions has its
origin in agricultural activities, mainly in denitrification of
nitrogen supplied to the soil in artificial fertilizers or
manure and other organic material. The production of nitric acid
is another major source of nitrous oxide; and, to a lesser
extent, also the Transport sector (cars with catalytic
converters).
The share of N2O emissions in total aggregated GHG emissions
represented in 2012 roughly 6 %. In 1990–2012 N2O emissions
decreased by 41.77 % (Fig. X.3), mainly as a result of the
reduction of artificial fertilizers used in agriculture, the
decrease of the livestock numbers, and recently also due to the
implementation of technologies aimed at N2O emissions abatement
in the production of nitrous acid.
Fluorinated gases
The emissions of fluorinated gases (F-gases) increased since 1995 from 79 to 3,141.38 Gg CO2 eq. in 2012 (Fig. X.4). Similarly, the share in total aggregated emissions increased as well (from 0.05 % in 1995 to 12.4 % in 2012). Fluorinated gases are not produced in the Czech Republic and all their consumption is covered by import. They are used mainly in the refrigeration and air conditioning equipments (mainly HFC), in electrical equipments (mainly SF6), and in a number of other branches (e.g. as sound-proof windows, plasma etching, fire extinguisher charges, aerosol propellants, blowing agents). The growth of emissions from fluorinated gases is caused by their use as substitutes for substances depleting the Earth’s ozone layer (CFC, HCFC – mainly as refrigerants), large-scale use of modern technologies (air conditioning) and the production specialization in the Czech Republic (production of cars, air conditioning systems). In some cases, e.g. in sound-proof windows, plasma etching and blowing agents, the used amount has stagnated or decreased, which is connected with the implementation of the new technologies and/or the use of substitutes. The decline in the years 2007–2012 is caused partly by economic crisis connected with the decline of production of passenger cars and the production processes in general.
Emission trading system
The greenhouse gas emission (CO2) allowance trading scheme is
regarded as an effective economic tool for the reduction of GHG
emissions. At present there are two integrated systems in the
Czech Republic – The European Union Emission Trading Scheme (EU
ETS) and flexible mechanisms of the Kyoto Protocol: Clean
Development Mechanism, Joint Implementation and International
Emission Trading. The flexible mechanisms of the Kyoto Protocol
are repealed by the new Regulation of the European Parliament
and the Council (EU) No. 525/2013.
The CHMI experts have participated from the very beginning in
the preparation and implementation of the EU ETS in the Czech
Republic, mainly as concerns the methods (monitoring, reporting
and verifying greenhouse gases emissions). The interaction of
the national GHG emissions inventory and EU ETS has a mutual
character: national inventory brings several data for emission
calculation from selected processes and, on the other hand, the
selected data obtained through the EU ETS are used when
processing the national inventory.
As concerns the use of flexible mechanisms of the Kyoto Protocol,
the implementation and operation of the National Inventory
System were the fundamental and inevitable conditions for the
possibility to use the International Emission Trading. As for
the Joint Implementation projects, this practice resulted in a
markedly lower administrative burden, and consequently, lower
costs for their implementation.
In 2012 the amount of greenhouse gases produced by the Czech
enterprises involved in EU ETS was by 6.85 % lower than in 2011.
The 2012 emissions amounted to 69.31 Mt CO2, which is a markedly
lower value than expected by the National Allocation Plan for
the Czech Republic which distributed 85.45 million allowances
among GHG emitters. The results are presented in
Table X.3, the
development of CO2 emissions within EU ETS is apparent from
Fig.
X.5.
Tab. X.1 Total emissions of greenhouse gases, 1990, 1995, 2000, 2005, 2010–2012 [Mt CO2 eq.]
Tab. X.2 Emissions of greenhouse gases, 1990, 1995, 2000, 2005, 2010–2012 [Mt CO2 eq.]
Tab. X.3 Verified emissions of CO2 reported in the ETS scheme, 2005–2013 [Mt CO2 eq.]

Fig. X.1 Emissions of carbon dioxide structured by sectors,
1990–2012
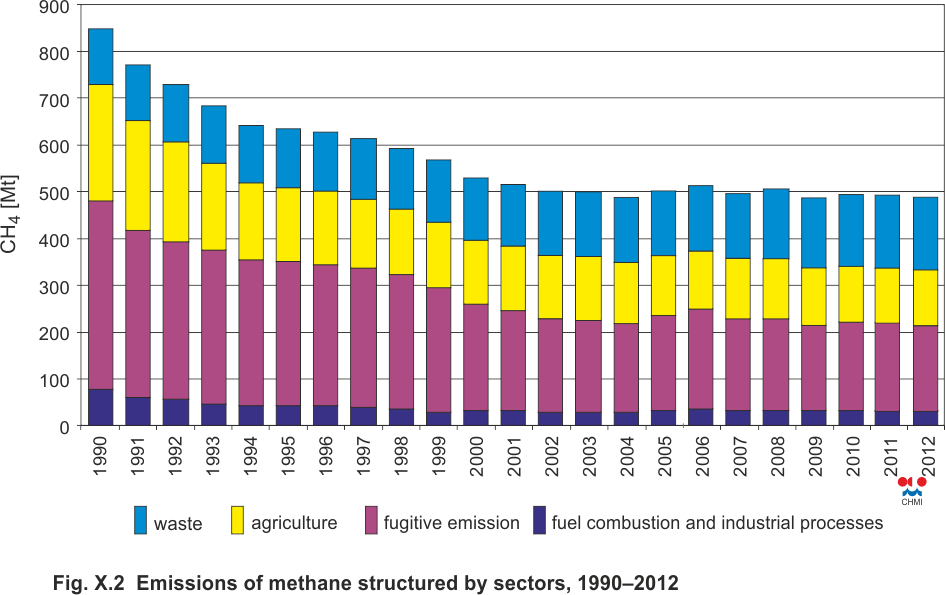
Fig. X.2 Emissions of methane structured by sectors, 1990–2012
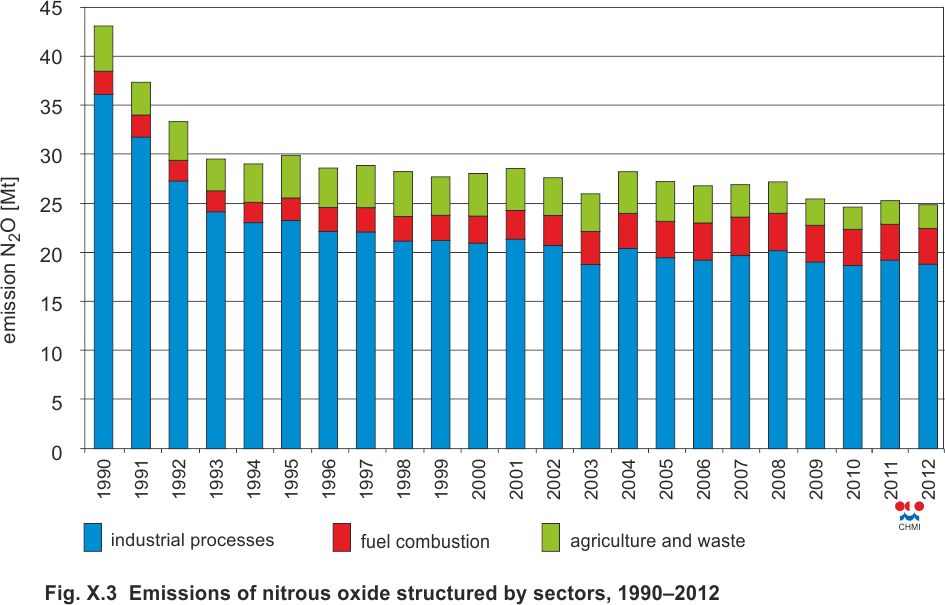
Fig. X.3 Emissions of nitrous oxide structured by sectors,
1990–2012
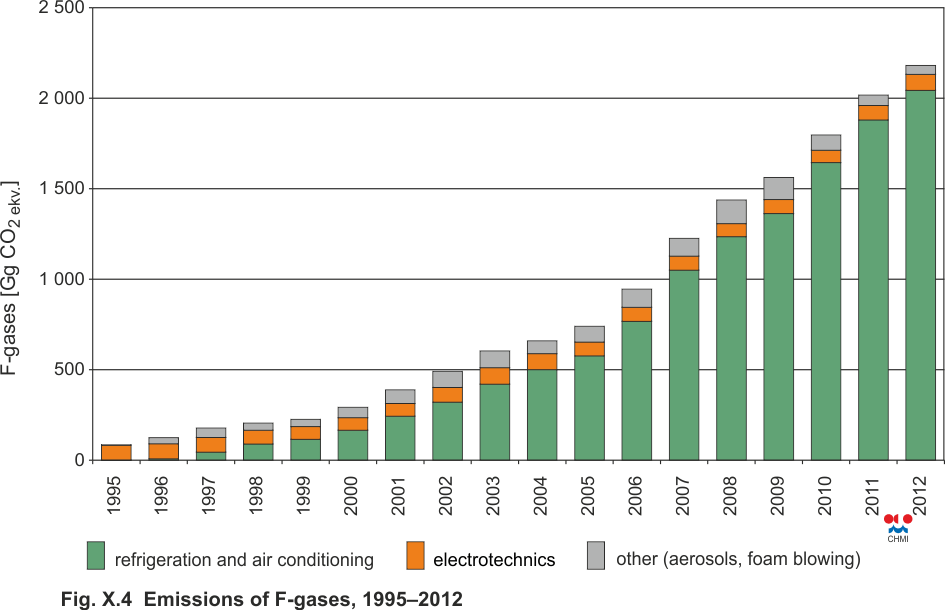
Fig. X.4 Emissions of F-gases, 1995–2012
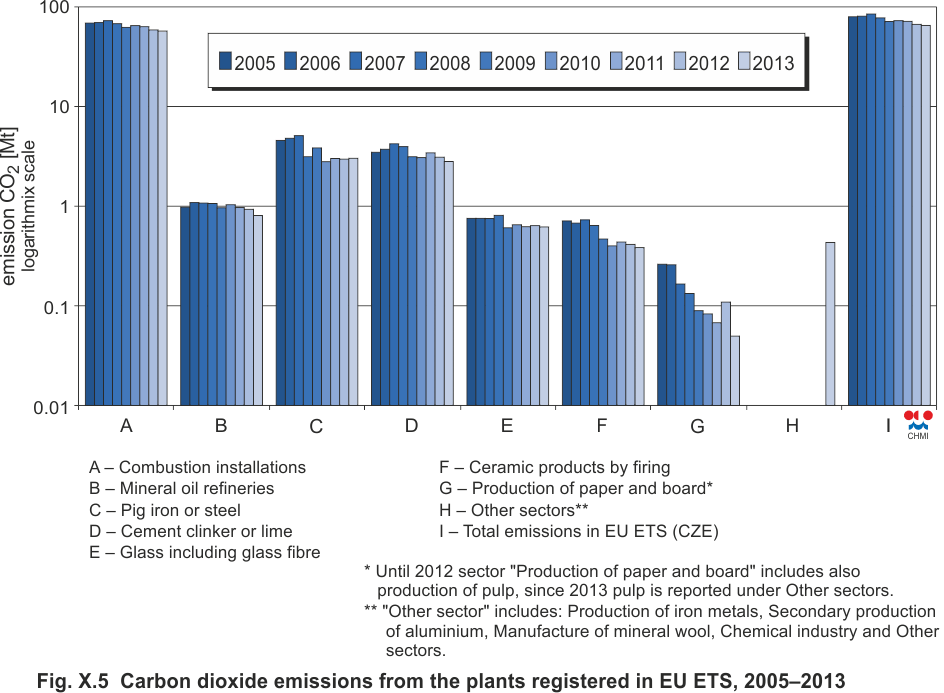
Fig. X.5 Carbon dioxide emissions from the plants registered in EU ETS, 2005–2013