| AIR POLLUTION IN THE CZECH REPUBLIC IN 2010 Czech Hydrometeorological Institute - Air Quality Protection Division |
|
|
|
|
|
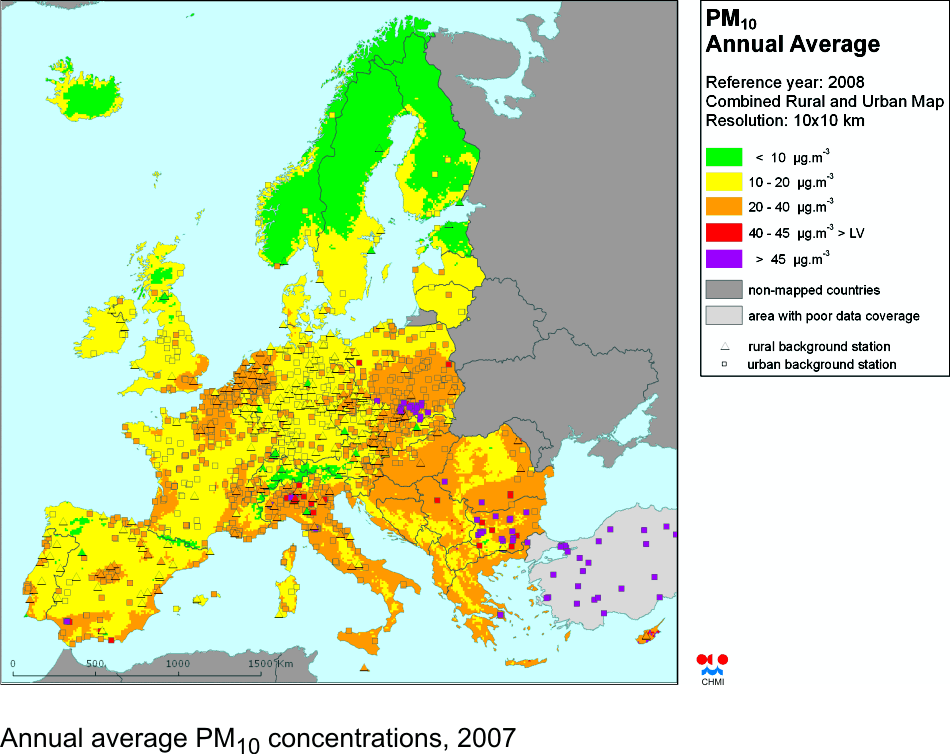
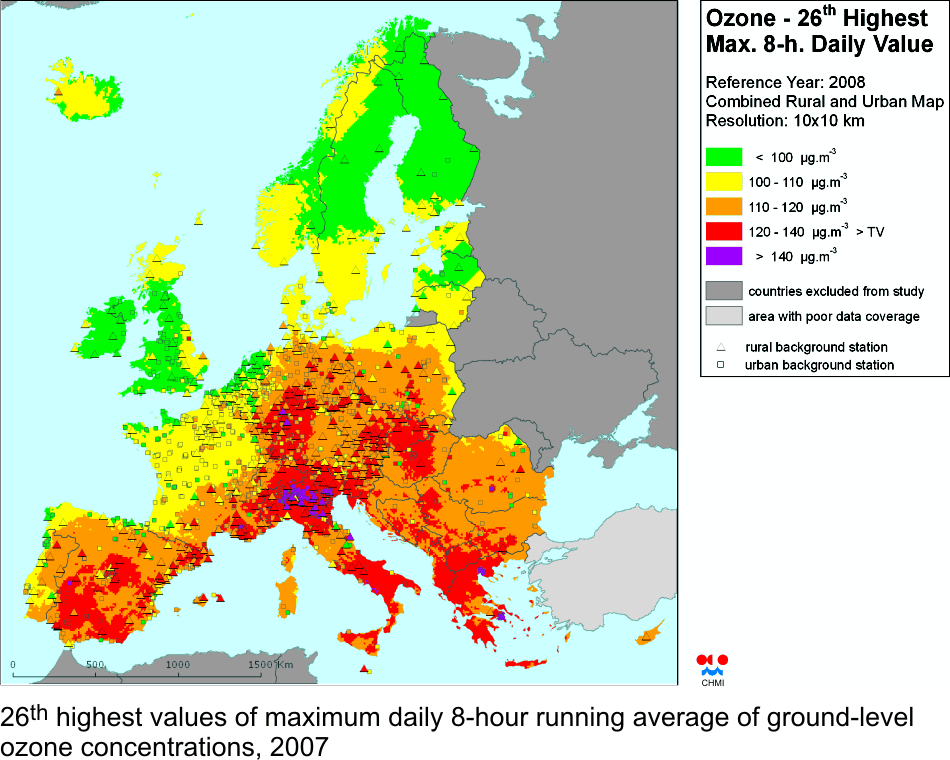
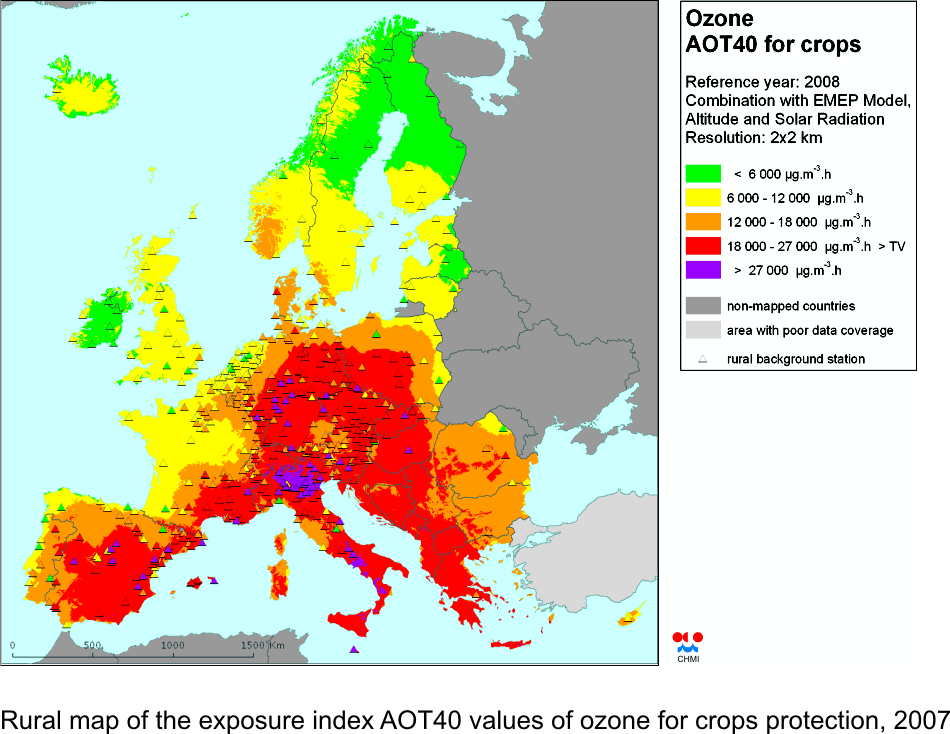
II.4.5. Europe Figs. II.4.5.1–II.4.5.4 present the maps of PM10 and ozone concentrations in the European scale. In case of PM10 the maps show the annual average and the 36th highest daily values, the ozone maps show the 26th highest daily maximum 8-hour value, and the exposure index AOT40 for vegetation. All maps reflect the situation in the year 2008 – i.e. they are the most recent published European maps. The maps were created within the ETC/ACC Consortium (in which CHMI takes part) for the European Environment Agency [34]. The maps were created by the combination of the measured and supplementary data, by merging the rural and urban maps of air pollution (with the exception of AOT40, where there is only a rural map) in 10x10 km resolution. The European maps provide the context for the maps of air pollution in the Czech Republic (even though in 2008 the level of ambient air pollution within the all-European scale was lower than in 2010). In case of PM10 we can see that the Ostrava-Katowice area ranks – together with the Po lowland in Italy and several Balkan areas – among the most polluted areas in Europe. In case of the ground-level ozone, it can be stated the levels measured in the Czech Republic reach the average values corresponding to the geographic position of the Czech Republic in the European continent.
Fig. II.4.4.1 Annual average PM10 concentrations, 2008
Fig. II.4.4.2 36th highest value of maximum daily average of PM10 concentration, 2008
Fig. II.4.4.3 26th highest value of maximum daily 8-hour running average of ground-level ozone concentrations, 2008
Fig. II.4.4.4 Rural map of the exposure index AOT40 values of ozone for crops protection, 2008
|