AIR POLLUTION IN THE CZECH REPUBLIC IN 2010
Czech Hydrometeorological Institute - Air Quality Protection Division
| AIR POLLUTION IN THE CZECH REPUBLIC IN 2010 Czech Hydrometeorological Institute - Air Quality Protection Division |
|
|
|
|
|
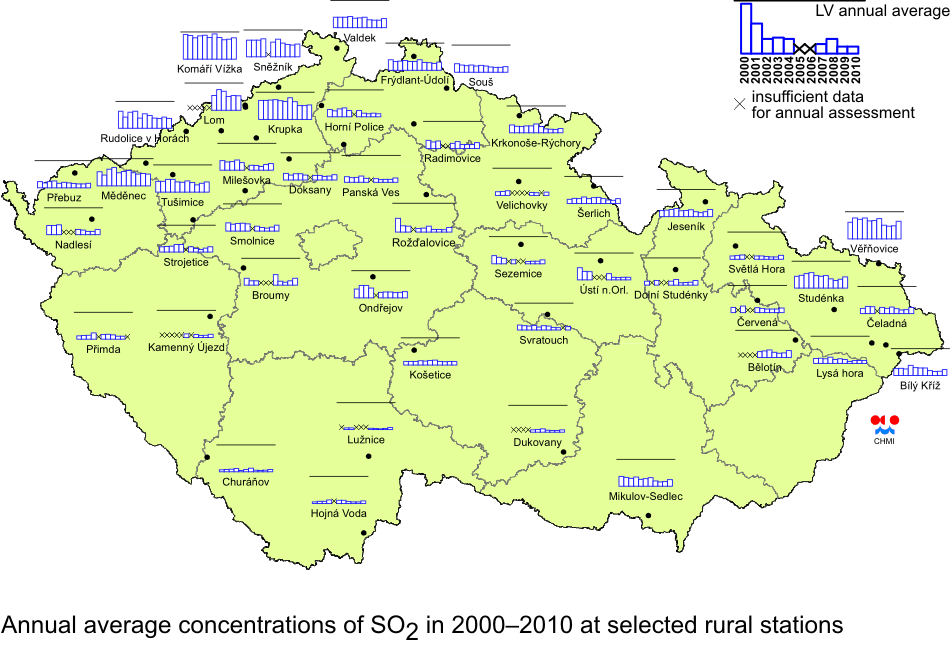
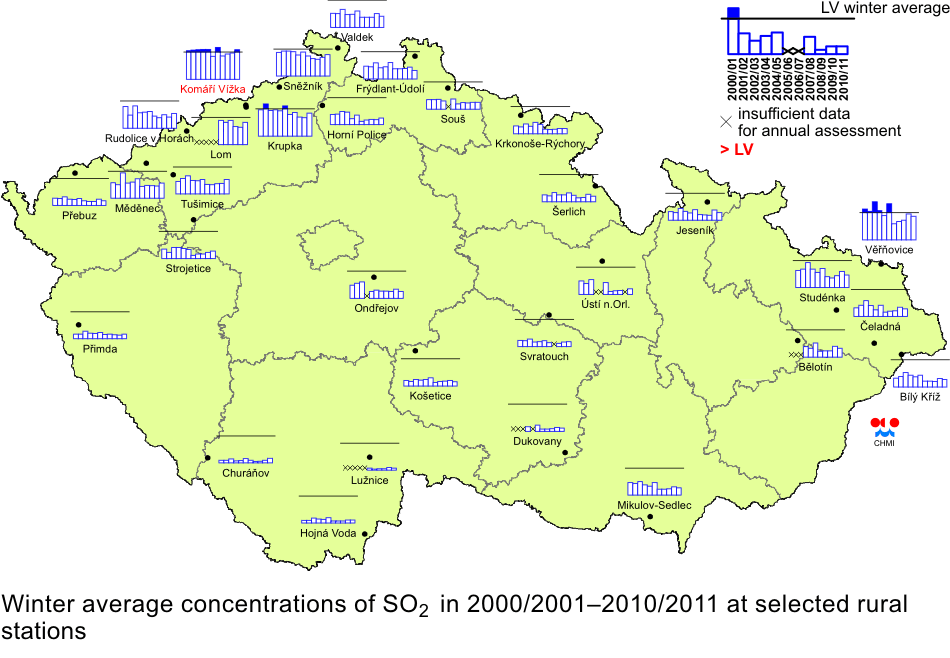
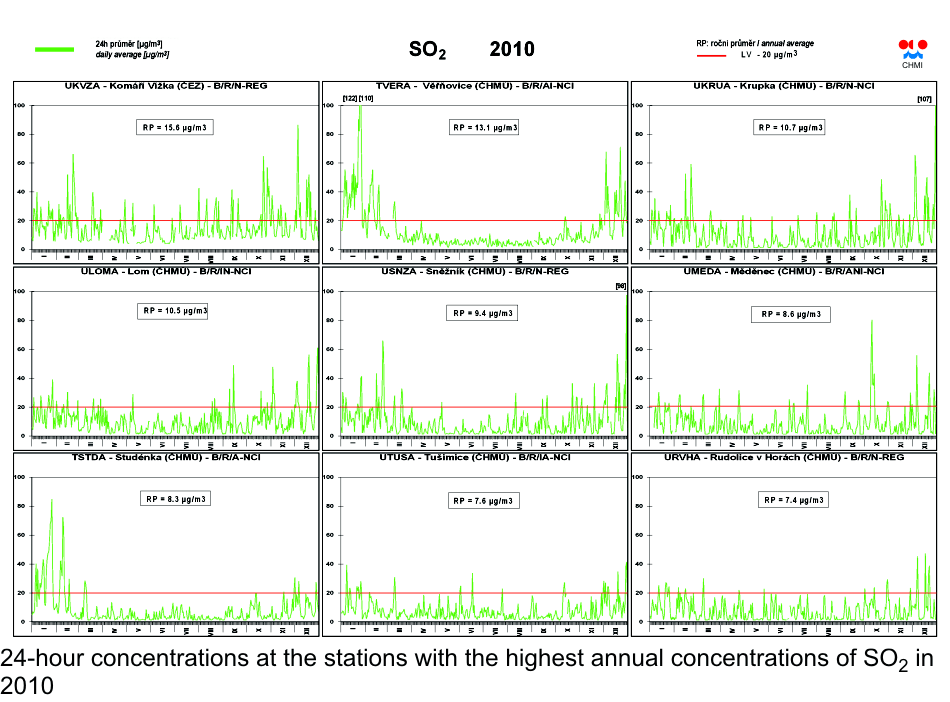
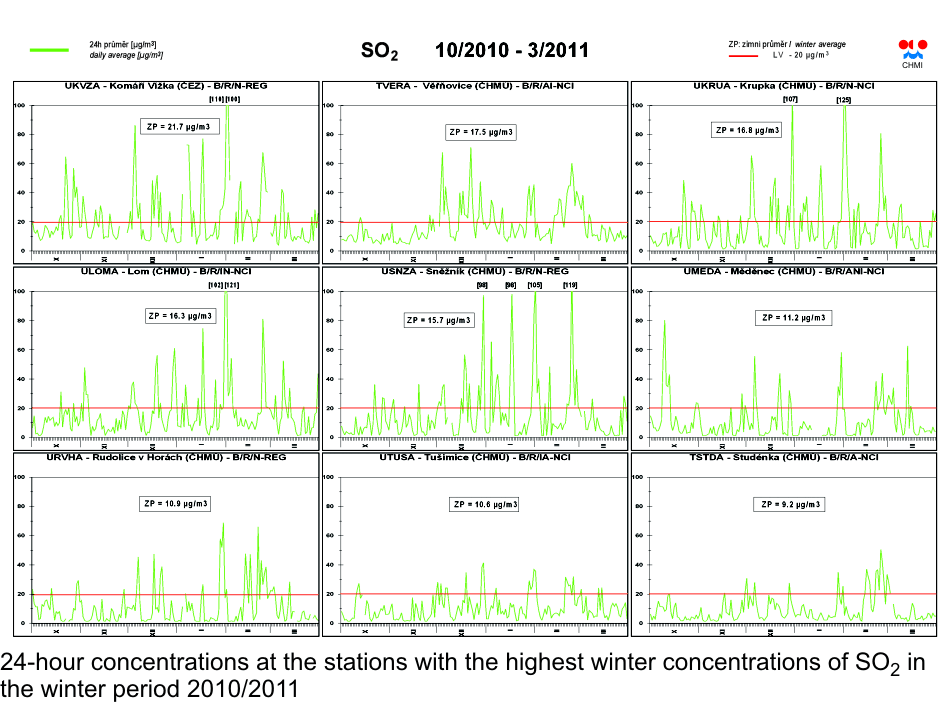
II.4.2.2 Air quality with regard to the limit values for the protection of ecosystems and vegetation In addition to the limit values for the protection of health the national legislation introduced, in compliance with EU Directives, also the limit values for the protection of ecosystems and vegetation. The survey of the limits is presented Chapter II.3. II.4.2.2.1 Sulphur dioxide In 2010 there were no exceedances of the limit value for the annual average concentration in rural localities, nevertheless, for the first time since 2006, there was recorded the exceedance of the limit value for the winter average 2010/2011, and namely in the locality Komářà VĂĹľka (21,7 ÎĽg.m-3). The results of SO2 air pollution monitoring with regard to the limit values for the protection of ecosystems and vegetation for the annual and winter period are shown in the Tables II.4.2.21 and II.4.2.22 and in Figs. II.4.2.51 and II.4.2.52. After the year 1998 there was recorded, in connection with coming into force of the Act No. 309/1991 Coll., and meeting the required emission limit values, a marked decrease of SO2 concentrations. Since then the annual average SO2 concentrations have not exceeded the set limit value 20 ÎĽg.m-3 at rural stations (Fig. II.4.2.49). In 2008 there was further decrease of air pollution caused by SO2 on the whole territory of the Czech Republic, nevertheless since 2009, on the contrary, there has been recorded a slight increase of annual average at most stations. In 2010 there was recorded further increase of annual average in most assessed localities (88 %). The map was constructed from the data of all background stations measuring SO2
with regard to their classification; only rural stations are marked with spot
symbols. Tab. II.4.2.21 Stations with the highest values of annual averages of SO2 concentrations at rural stations
Fig. II.4.2.49 Annual average concentrations of SO2 in 2000–2010 at selected rural stations
Fig. II.4.2.50 Winter average concentrations of SO2 in 2000/2001–2010/2011 at selected rural stations
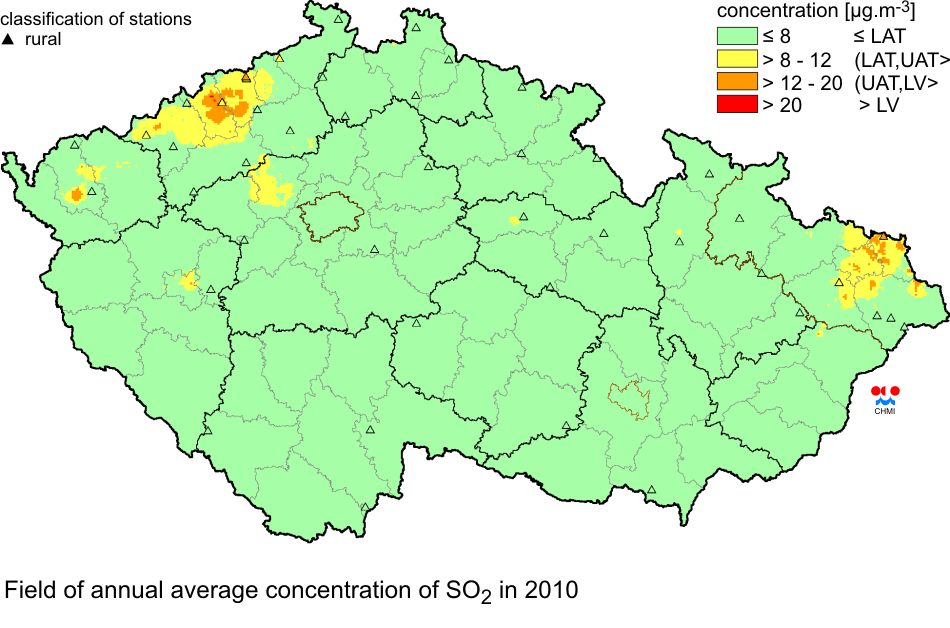
Fig. II.4.2.51 Field of annual average concentration of SO2 in 2010
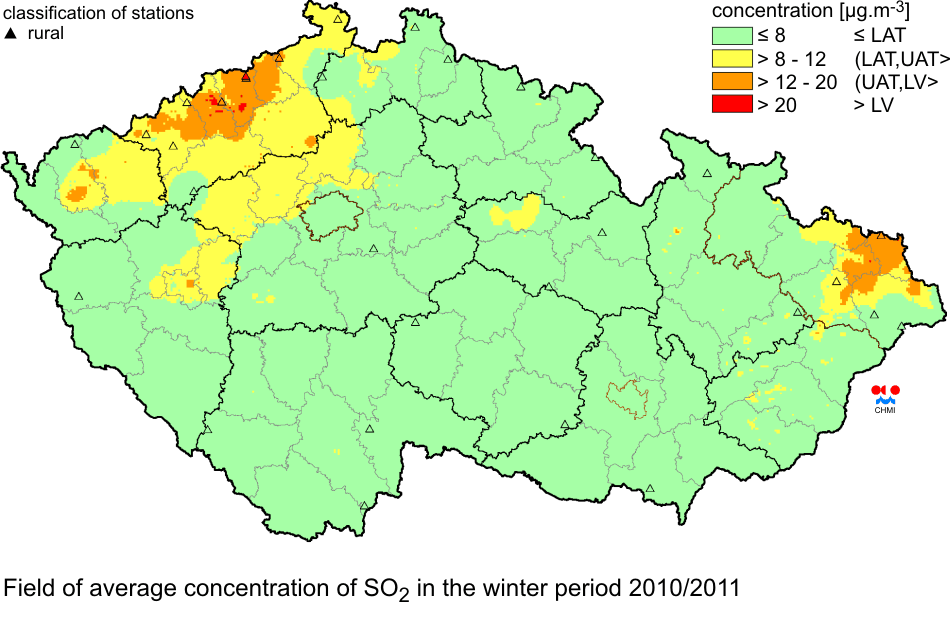
Fig. II.4.2.52 Field of average concentration of SO2 in the winter period 2010/2011
Fig. II.4.2.53 24-hour concentrations at the stations with the highest annual concentrations of SO2 in 2010
Fig. II.4.2.54 24-hour concentrations at the stations with the highest winter
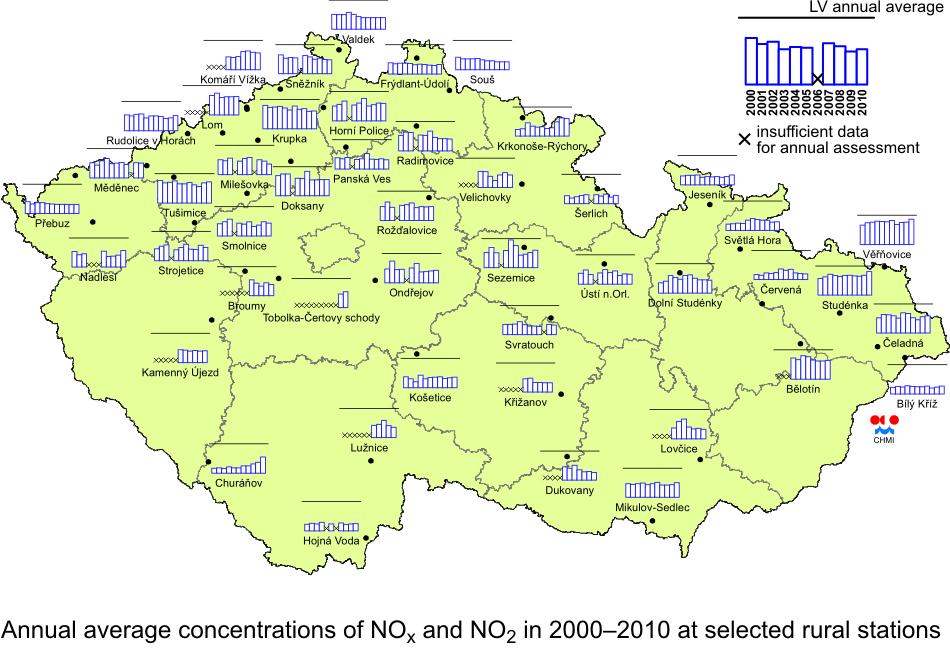
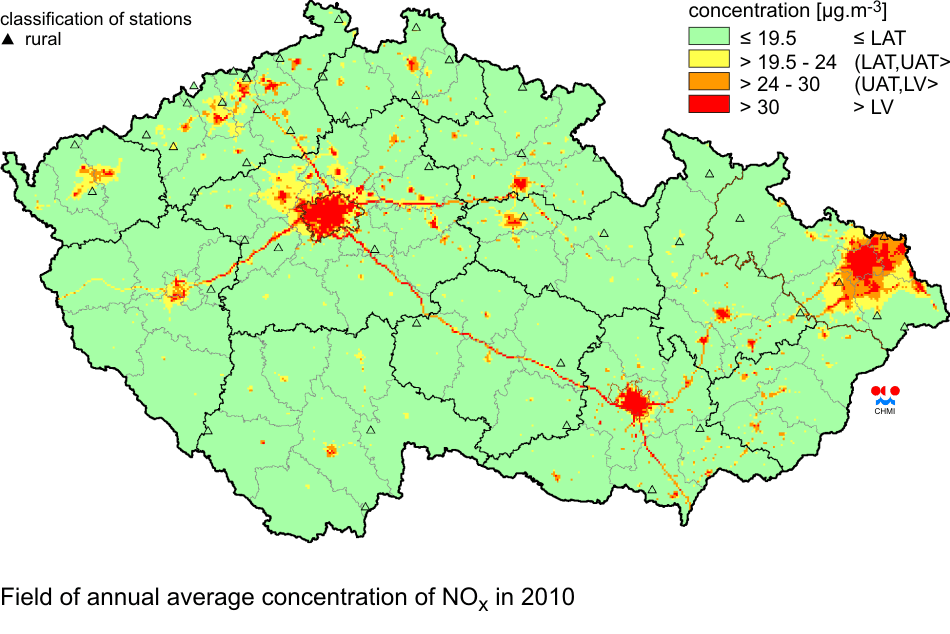
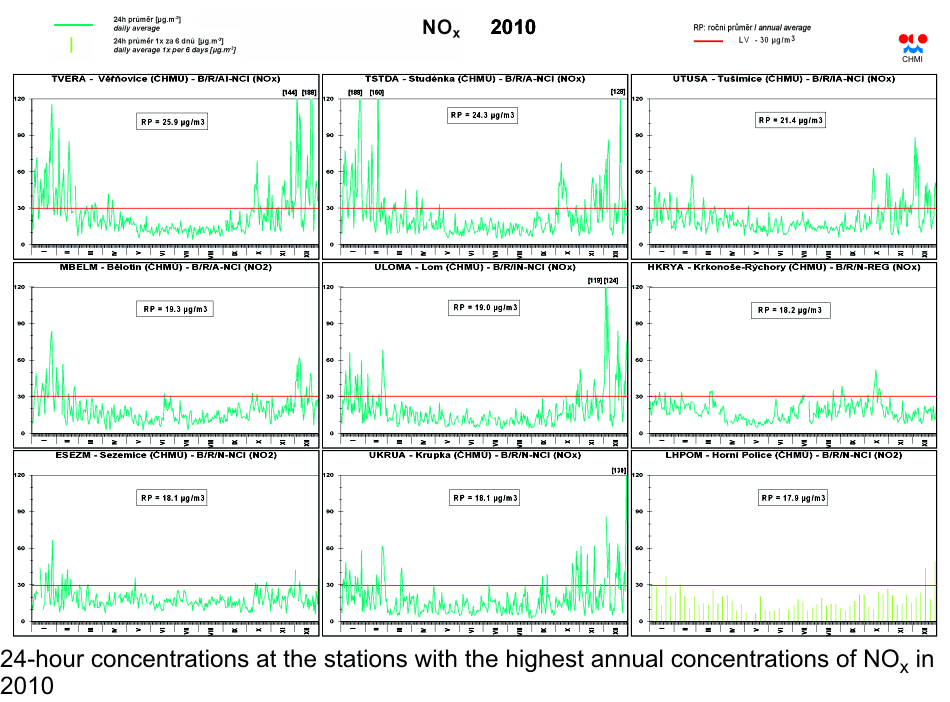
concentrations of SO2 in the winter period 2010/2011 II.4.2.2.2 Nitrogen oxides In 2010 the NOx air pollution limit value for annual average concentrations (30 ÎĽg.m-3) was not exceeded in any of 47 localities classified as rural (Tab. II.4.2.23 and Fig. II.4.2.55). Both the table and the map for NOx include also the rural stations measuring only NO2, because as concerns the rural stations, NOx concentrations correspond approximately to NO2 concentrations, in other words, the difference between both concentrations is negligible. In 2010 the number of rural stations at which the annual average NOx concentrations increased was slightly higher (26 localities) than the number of those at which it decreased (21 localities) (Fig. II.4.2.55). The construction of the map of the spatial distribution of annual average NOx concentrations is based on the combination of measurement and modelling. All stations measuring NOx including the rural station measuring NO2 were used for the construction of the map of the field of NOx, and also the current data on emissions from mobile sources in the Czech Republic were regarded. The higher NOx concentrations can occur also in the vicinity of local communications in the villages with intensive traffic and dense local transport network, where there is no measurement of concentrations. The spot symbols highlight only the rural stations (Fig. II.4.2.56) because the level of annual NOx concentrations in these localities is evaluated with regard to the limit value. This chapter is closed by the graphs of courses of 24-hour NOx concentrations for the selected localities with higher annual averages of NOx concentrations in 2010 (Fig. II.4.2.57).
Fig. II.4.2.55 Annual average concentrations of NOx and NO2 in 2000–2010 at selected rural stations
Fig. II.4.2.56 Field of annual average concentration of NOx in 2010
Fig. II.4.2.57 24-hour concentrations at the stations with the highest annual concentrations of NOx in 2010
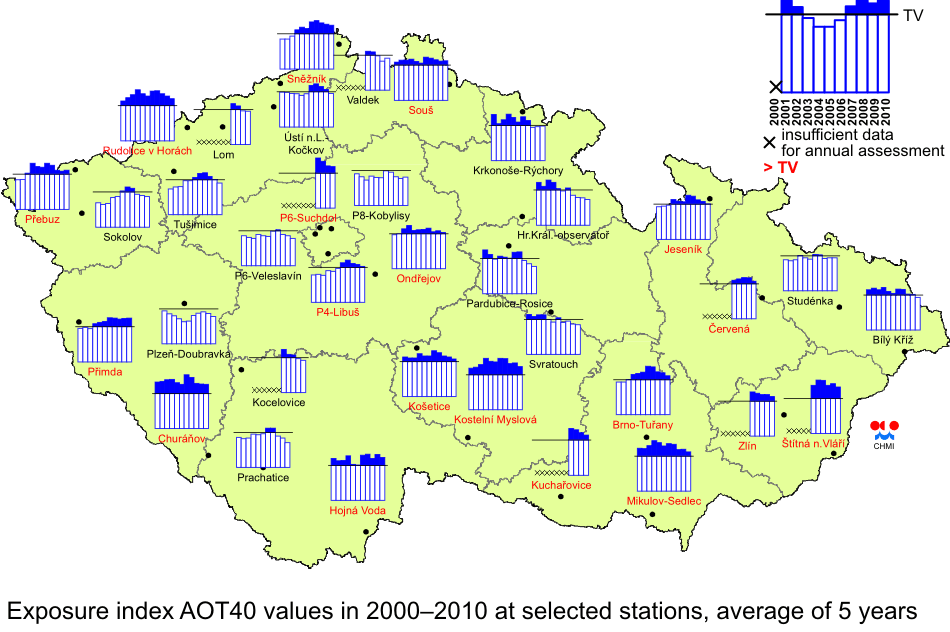
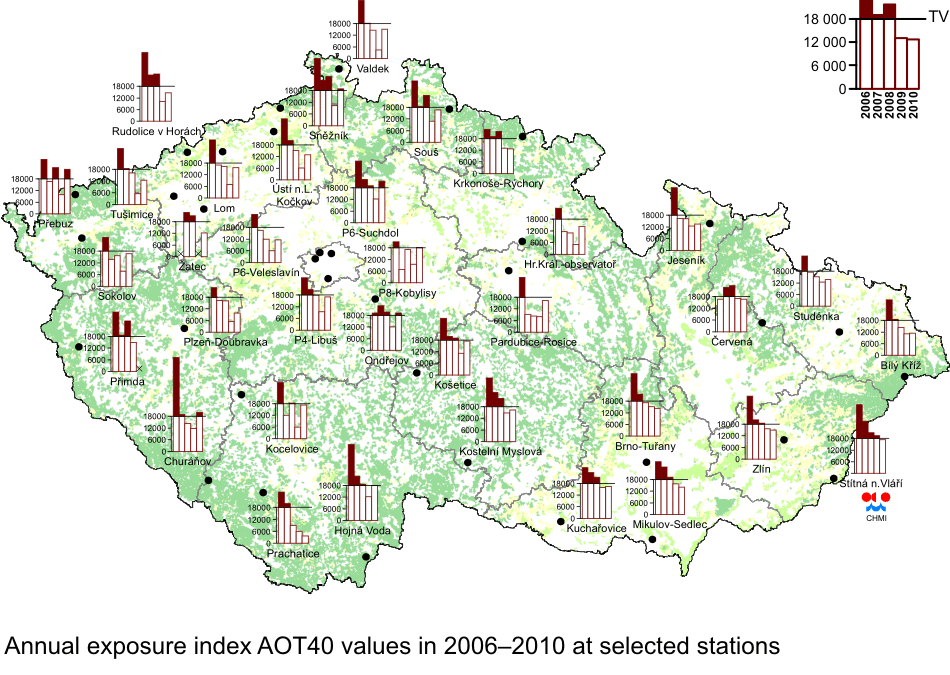
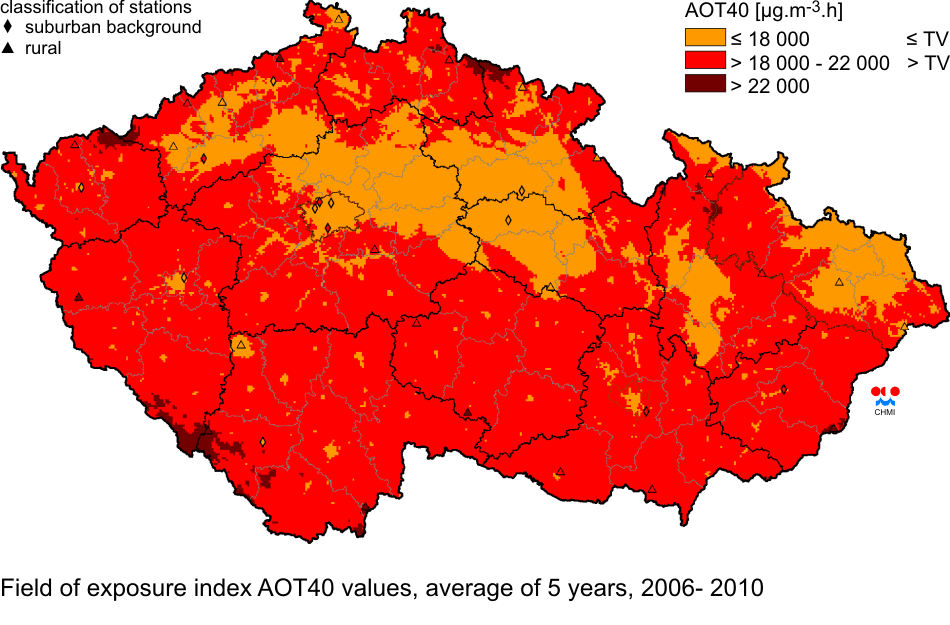
II.4.2.2.3 Ground-level ozone For the assessment of vegetation protection against ozone exceedances the national legislation uses, in compliance with the respective EU Directive, the exposure index AOT401. Of the total number of 37 rural and suburban stations for which the AOT40 calculation is relevant according to the legislation, the target value for ozone for the protection of vegetation was exceeded in 20 localities in 2010 (the average for the years 2006–2010). The survey of stations with the highest values of AOT40 is given in Table II.4.2.24. As compared with the previous assessment for the period 2005–2009, the values of the exposure index decreased in 83 % of rural and suburban localities. The average monthly temperatures of the period April–September 2005 (which was not included in the assesssed five-year period) and the year 2010 were comparable. Nevertheless, the maximum temperatures and the value of the sums of daily averages of global solar radiation decreased in 2010 (as compared with the year 2005) in about two thirds of localities monitoring the given meteorological parameters. Air pollution concentrations of precursors showed the opposite trends while NO2 concentrations decreased in 2010 as compared with the year 2005 in about 63 % of localities; the same per cent of 30 substances included in the VOC group, monitored in Košetice and in Libuš, slightly increased in 2010 in comparison with the year 2005. With regard to rather complicated atmospheric chemical reactions during the creation and disintegration of ozone, to its dependence on the absolute amount and the relative share of its precursors in the ambient air connected also with long-range transport of pollutants, as well as on meteorological conditions, it is difficult to make more detailed comments on the year-to-year changes. The spatial distribution of AOT40 exposure index for the 2010 assessment is shown in Fig. II.4.2.60. Fig. II.4.2.58 presents the AOT40 development in average for 5 years in the period 2006–2010 in selected localities. Fig. II.4.2.59 shows the development of AOT40 values calculated for each year in the period 2006–2010. Tab. II.4.2.24 Stations with the highest AOT40 values of ozone at rural and suburban stations
Fig. II.4.2.58 Annual exposure index AOT40 values of ozone in 2000–2010 at selected stations, average for 5 years
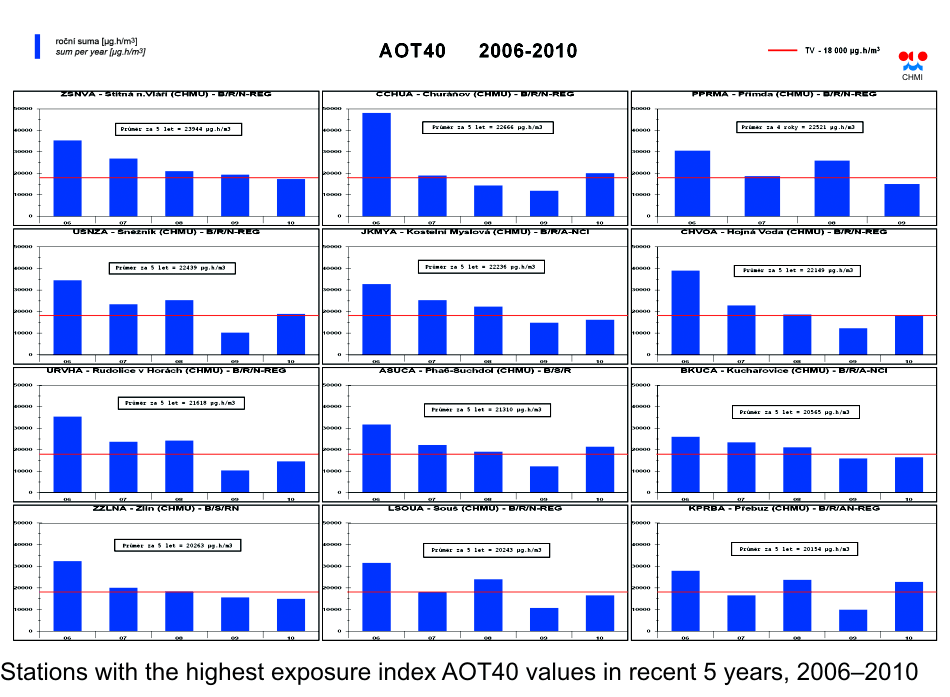
Fig. II.4.2.59 Annual exposure index AOT40 values in 2006–2010 at selected stations
Fig. II.4.2.60 Field of exposure index AOT40 values, average for 5 years, 2006–2010
Fig. II.4.2.61 Stations with the highest exposure index AOT40 values in recent 5 years, 2006–2010 1AOT40: accumulated exposure is calculated as the sum of the difference between hourly ozone concentrations and the threshold level of 80 μg.m-3 (= 40 ppb) for each hour when this threshold value was exceeded. Pursuant to the requirements of the Government Order No. 597/2006 Coll. AOT40 is calculated for the period of three months (May to July) measured between 8:00 and 20:00 Central European Time (= 7:00 and 19:00 UTC).
|