| AIR POLLUTION IN THE CZECH REPUBLIC IN 2010 Czech Hydrometeorological Institute - Air Quality Protection Division |
|
|
|
|
|
I. ATMOSPHERIC POLLUTANTS EMISSION IN THE CZECH REPUBLIC
The Department of Emissions and Sources has been authorized
by the Ministry of the Environment to carry out emission inventories of air
pollutants and greenhouse gases. In addition to the national and sector
inventories, also inventories based on administrative units are produced
(regions or districts). The methods are described at the websites
www.chmi.cz under “AIR QUALITY”/”Emission
inventory”. I.1 Atmospheric pollutants’ emissions Pursuant to the legislation which came into force in 2002 air
pollution sources are divided into several categories to carry out emission
inventories. Complying with this categorisation, the Air Quality Information
System (ISKO) operated by CHMI includes REZZO databases (Register of Emissions
and Air Pollution Sources) which serve for archiving and presenting data on
stationary and mobile air pollution sources. I. Extra large and large sources – REZZO 1 The collection of data of the 2010 Summary operational
records of extra large, large and medium-sized sources which are the basis of
the REZZO 1 and 2 databases, used the forms the contents of which was set by a
legislative document. The operators of extra large, large and medium-sized
sources reported the data pursuant to the requirements of the Decree of the
Ministry of the Environment No. 205/2009 Coll., which came into force in August
2009. The list of data of Summary operational records is given in Annex 7. There
is also a significant change in the reporting procedure itself. According to the
requirements of the Act No. 25/2008 Coll. on Integrated Pollution Register Act (IRZ)
and Integrated System of Compliance with Reporting Duty in Environmental Areas (ISPOP)
almost all 25000 subjects reported the data according to the data standard which
included also the validation control aimed mainly at the completeness and
logical correctness of the reporting. The form F_OVZ_SPOJ was obligatory for the
reporting (see www.ispop.cz). Final data on emissions of all monitored sources are not
available by the deadline of the Yearbook. Consequently, emission data for the
year 2010 presented in the tables are preliminary, nevertheless the schedule of
data processing for REZZO will be much shorter as compared with the previous
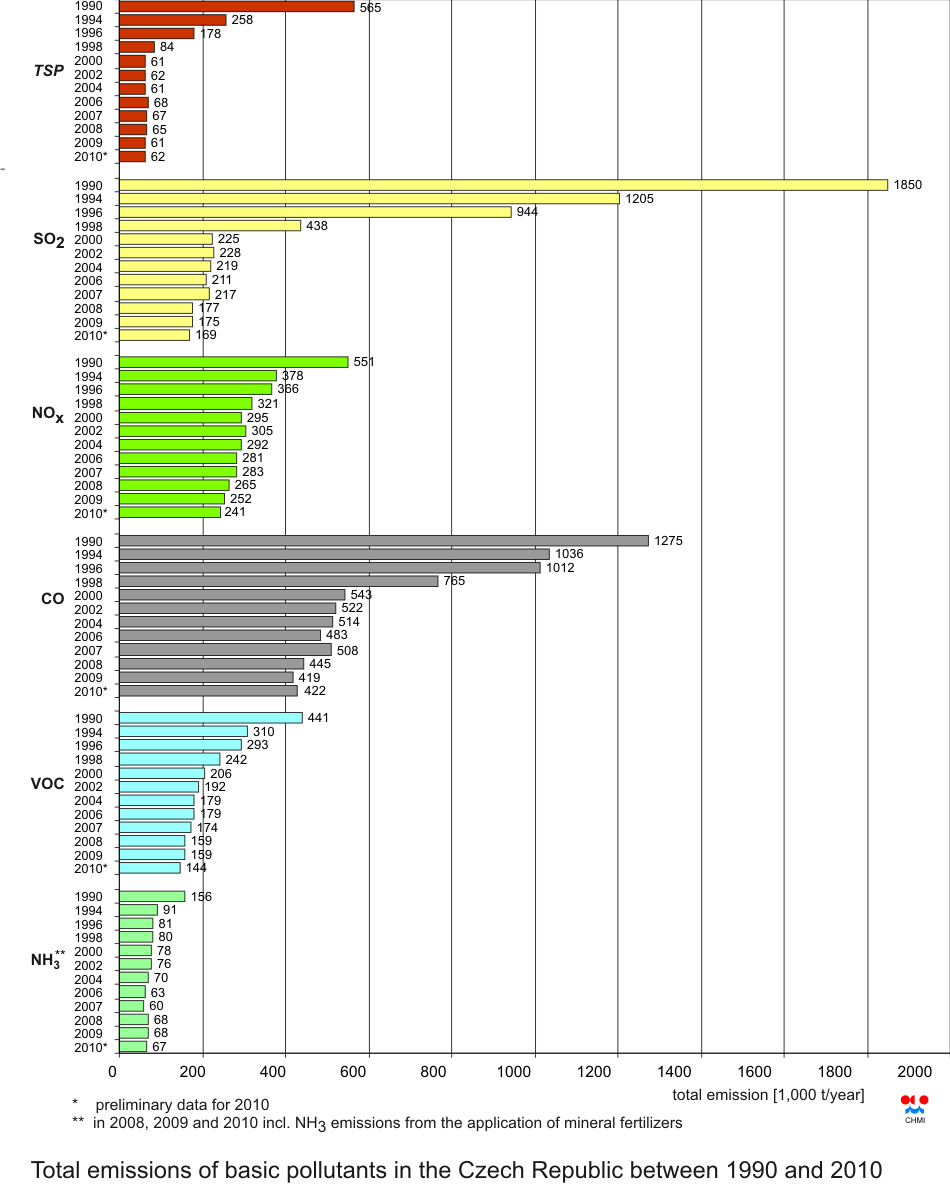
years due to data collection directly in the form of standardized data. Table I.1.1 documents data on
total emissions of basic air pollutants in 2009, and namely total suspended
particles (TSP), SO2, NOx, CO, volatile organic compounds
(VOC) and ammonia (NH3), and the shares contributed by each of the
emission source categories to total air pollutant emissions. Preliminary data on
the amount of emissions of basic pollutants in 2010 are shown in
Tab. I.1.2. The development of total emissions of
basic pollutants in 1990–2010 is shown in Fig. I.1.1.
In comparison with the year 2009 there was recorded again the decrease of
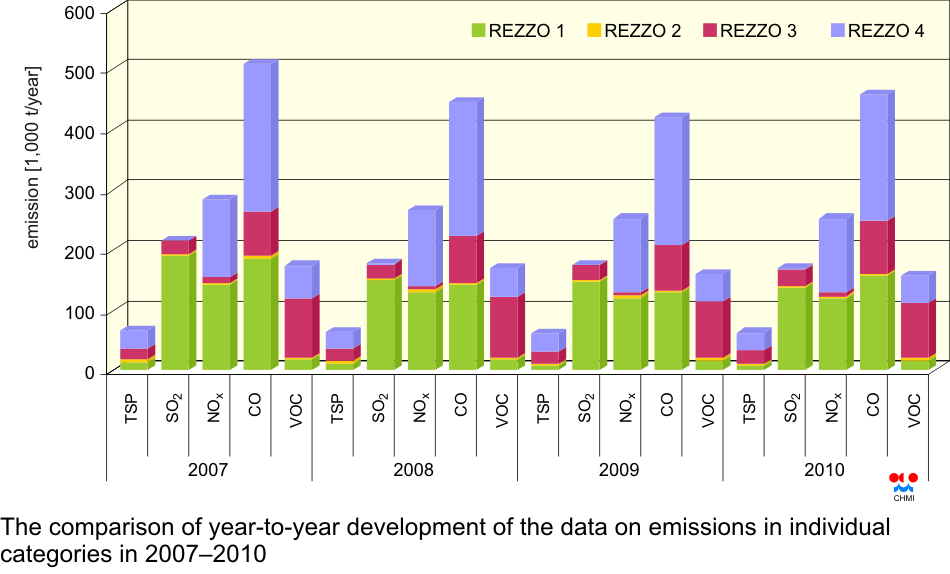
emissions in almost all basic pollutants. The comparison of year-to-year
development of the data on emissions in individual categories in 2007–2010 is
presented in Fig. I.1.2. Emissions from the monitored area sources in
the Czech Republic The air pollution sources monitored within the REZZO 3
include emissions from household heating, fugitive dust emissions from building
and agricultural activity, ammonia emissions from non-monitored breeding of farm
animals and application of mineral fertilizers and VOC emissions from the use of
organic solvents. With the exception of emissions from household heating, other
groups of sources are calculated exclusively with the use of data obtained
within the national statistical monitoring and the potential year-to year
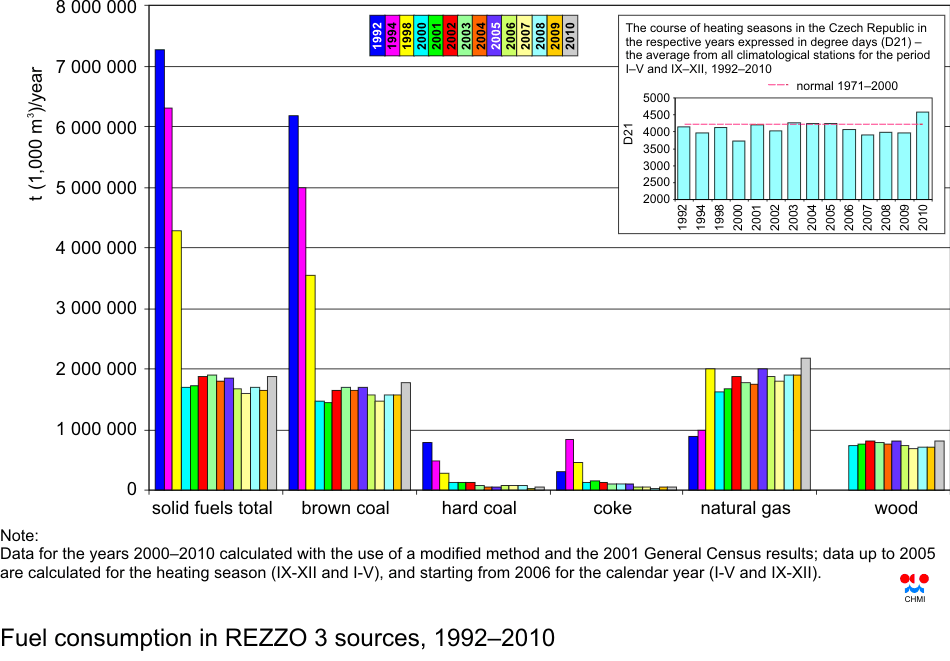
changes ensue usually from the development of basic statistical indicators. On
the contrary, the year-to year changes of the amount of emissions from household
heating are dependent primarily on the character of the heating season, which is
expressed in the model by the number of degree days, and on the changes of the
compositions of combustions appliances. While the heating seasons in the years
2006–2009 had similar course of temperatures below the normal, the heating
season of the year 2010 ranks among the coldest ones in the recent 10 years (Fig.
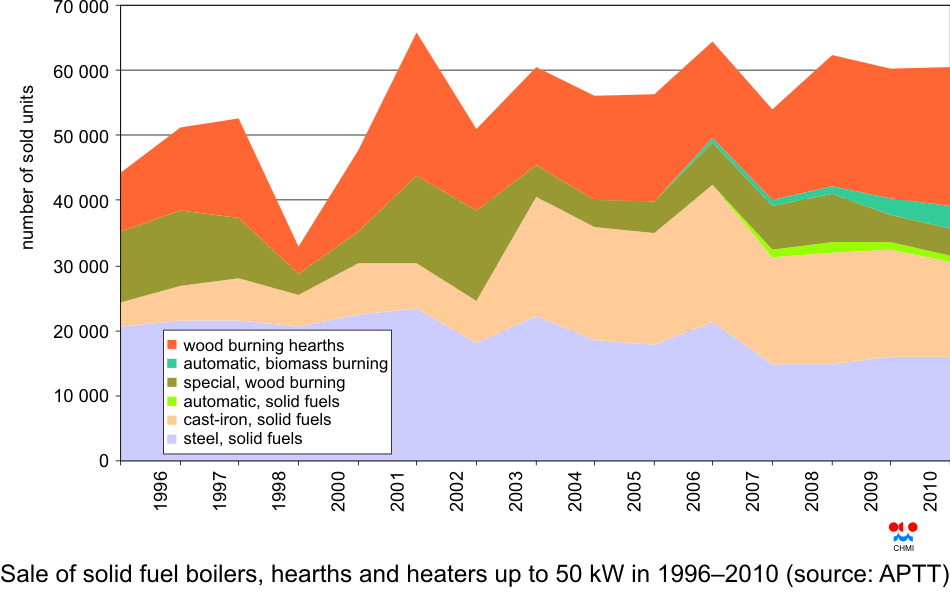
I.1.4). In 2010 approximately 17 % of households used solid fuels for
heating, out of which almost one half is represented by old solid-fuel burning
appliances which have the worst qualities as concerns emission production. The
lifetime of such appliances is several dozens of years and they are sold still
today due to their price. The sale statistics of solid fuel boilers, hearths and
heaters up to 50 kW (Fig. I.1.5) shows that in
2003 the solid fuel burning appliances (solid fuel cast iron boilers) were in a
great demand and every year their numbers are increasing by several thousands.
Emissions from waste incineration plants and
their share on total emissions Pursuant to Art. 4, par. (8) of the Clean Air Act No. 86/2002
Coll., waste incineration plants are ranked among extra large and large air
pollution sources and are registered within the REZZO 1 category. The following substances are reported within the Summary
operational records: basic pollutants: solid particles, sulphur dioxide (SO2),
nitrogen oxides (NOx), carbon monoxide (CO) and organic
substances expressed as total organic carbon (TOC) heavy metals: lead (Pb), cadmium (Cd), mercury (Hg),
arsenic (As), chromium (Cr), copper (Cu), nickel (Ni) polychlorinated dibenzodioxines and dibenzofuranes (PCDD/F) Other pollutants, included in the emission inventory and not
reported within the Summary operational records, are calculated with the use of
emission factors and the amount of combusted waste in tonnes per year. Emission data processed into charts with the help of GIS are
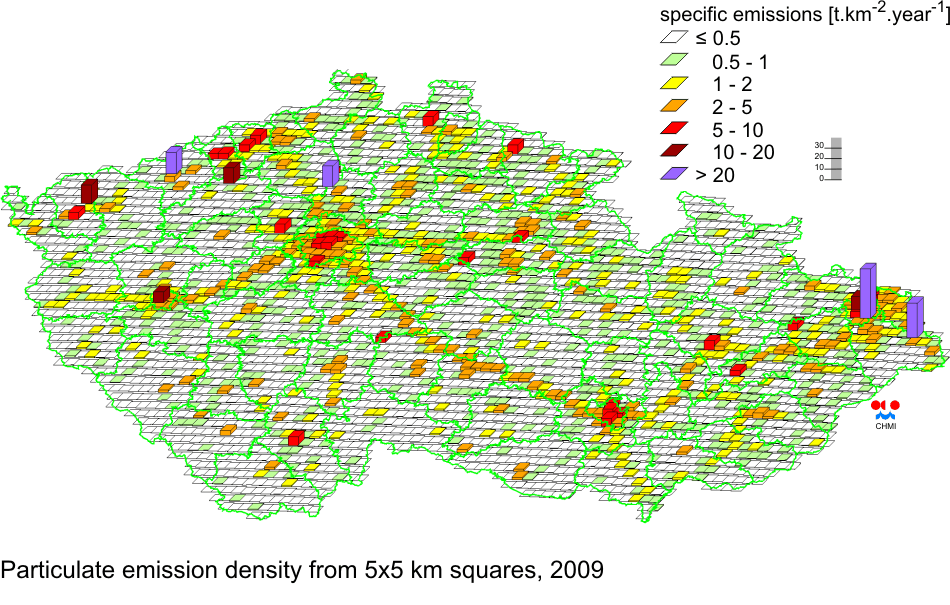
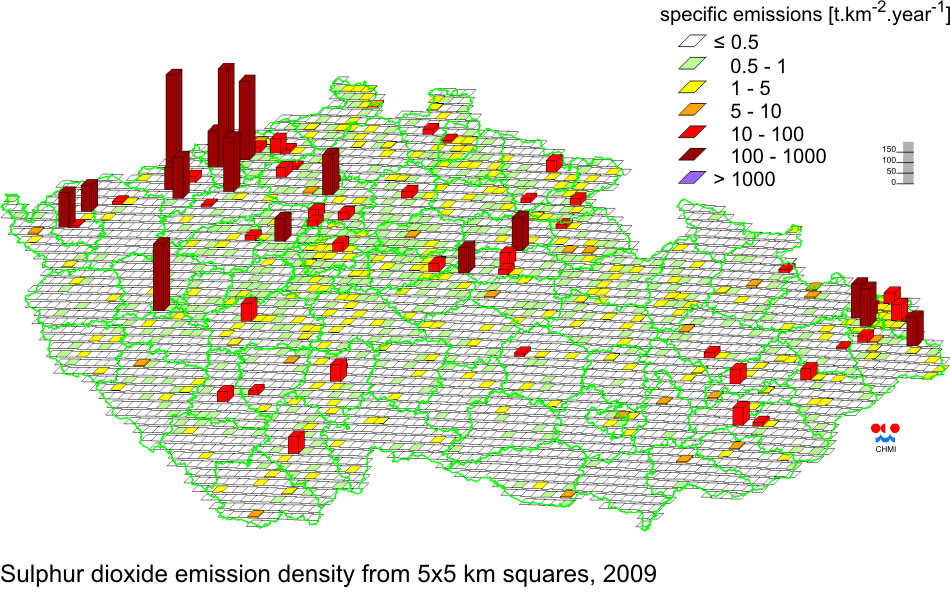
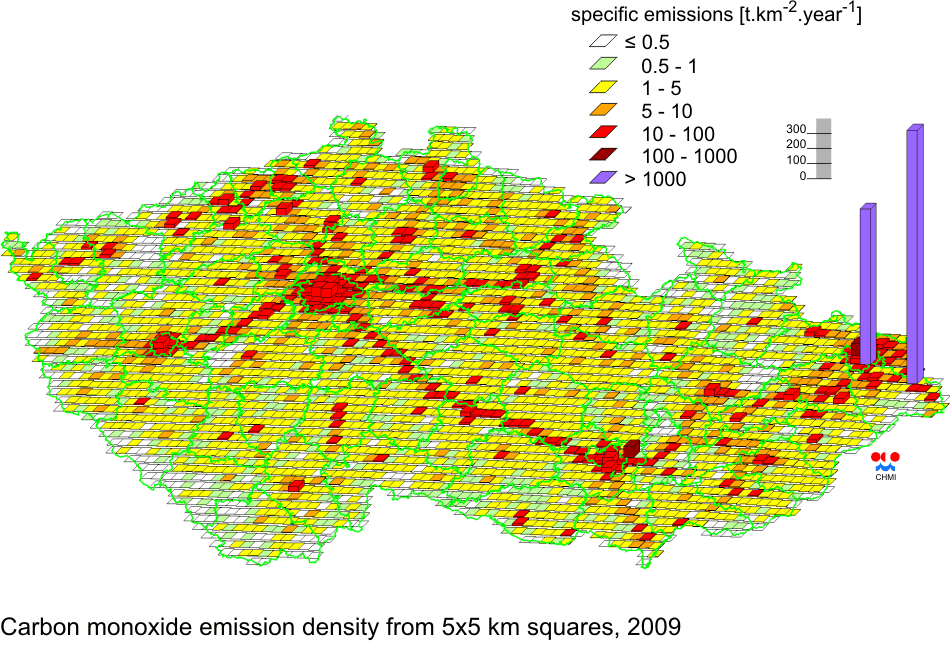
shown in Figs. I.1.5–I.1.8. Emission densities for NOx, TSP, sulphur
dioxide and carbon monoxide are plotted in 5 x 5-km grid-squares. The charts are
based on emissions from stationary sources (REZZO 1 to 3) and mobile sources (REZZO
4) for the year 2009, with regional disaggregation of emissions from line
sources according to the updated 2005 vehicle census. Emissions assessment The year-to-year development of emissions was influenced by
several factors. There was recovery of metallurgy and thus the emissions of CO
and solid pollutants increased again. The winter period was colder and this
caused the increase of emissions from household heating. On the contrary,
emissions from mobile sources decreased, mainly due to the higher rate of the
car fleet exchange. Tab. I.1.1 Total emissions of basic air pollutants
in 2009 – final data Tab. I.1.2 Total emissions of basic air pollutants
in 2010 – preliminary data
Fig. I.1.2 The comparison of year-to-year development of the data on
emissions in individual categories in 2007–2010
Fig. I.1.3 Fuel consumption in REZZO 3 sources, 1992–2010
Fig. I.1.4 Sale of solid fuel boilers, hearths and heaters up to 50 kW in
1996–2010 (source: APTT)
Fig. I.1.5 Nitrogen oxides emission density from 5x5 km squares, 2009
Fig. I.1.6 Emission density of total suspended particles from 5x5 km squares,
2009
Fig. I.1.7 Sulphur dioxide emission density from 5x5 km squares, 2009
Fig. I.1.8 Carbon monoxide emission density from 5x5 km squares, 2009 |