V.2 AGGLOMERATION OF BRNO
The Brno agglomeration lies in the centre of the Southern Moravian region and is identical with the administrative territory of the City of Brno. From the standpoint of air quality, Brno is one of three agglomerations and is thus not part of the South- Eastern zones (Southern Moravian region without Brno and the Vysočina region). The agglomeration has an area of 230.22 km2 and has 377,973 inhabitants (source: Ministry of the Interior of the Czech Republic, data as of 1 January 2017, CSO data as of 1 January 2017).
The pollution limit values established for protection of human health were exceeded over the past 7 years. This is especially true for suspended particulate matter PMsub>10 and PM2.5 and also benzo[a]pyrene and, in areas with heavy traffic levels, also for NO2. The area of the territory of the agglomeration where the pollution limit level is exceeded for PM10 can vary in the range of several percent (2013–2016), or may cover the whole territory of the agglomeration (2010). There is similar variability in the areas of territories where the pollution limit level for benzo[ a]pyrene is exceeded; however, because of the very low number of measuring stations, the values can be accompanied by large uncertainties. Since 2007, there has been no delimited area with values of the average annual PM10 concentrations exceeding the pollution limit level in the territory of the Brno agglomeration. The areas of territories where the pollution limit level was exceeded for the average annual concentration of NO2 have long been of the order of several percent and occur close to the roadways with the heaviest traffic levels (Tab. V.2.1).
Transport has long had an important impact in exceeding the pollution limit values in the Brno agglomeration, especially for the pollution limit values for the annual average NO2 concentrations. Transport contributes about 20% to the elevated average annual concentrations of suspended particulates PM10 above the Brno urban background, which can lead to exceeding the pollution limit values at some locations. Another important factor in exceeding the pollution limit levels is the open/ closed nature of the location from the view-point of built-up areas (canyons) and traffic flow close to the location. Because of the lack of a transport by-pass around Brno from the D1 motorway towards Svitava and the incomplete municipal ring road, a large amount of transit transport passes through the centre of Brno every day, further increasing the large number of vehicles in Brno.
V.2.1 Ambient air quality in the agglomeration of Brno
Suspended particles PM10 and PM2.5
In 2016, the pollutant limit level for the average annual concentration of PM10 was not exceeded at any of the locations of the state network of pollution level measuring stations. This limit was last exceeded in the Brno agglomeration in 2010. The highest concentrations were traditionally measured at the locations with the highest traffic levels at Brno-Svatoplukova and Brno-Zvonařka, in the immediate vicinity of which traffic line-ups are frequently formed, in contrast to other transport locations. This thus leads to an increase in emissions of pollutants, not only from exhaust pipes, but also from abrasion of tyres, roadways and brake linings (Fig. V.2.1). Compared to 2015, there was a reduction in the average annual concentrations of PM10 at all the locations with the exception of the Brno- Lány station. Compared to the concentrations measured in 2010, there was a decrease in 2016 in concentration at all types of locations to approx. 75–80% of the 2010 value. The greatest reduction was recorded at transport locations, where there was an average decrease from 35.5 μg.m-3 in 2010 to 26.4 μg.m-3 in 2016 (74%). This reduction could be connected with the gradual renewal of the vehicle fleet and/or with further implemented transport measures to increase the smoothness of traffic.
The highest concentrations on an average for 2010–2016 were measured at high-traffic stations; the concentration values for urban background locations were around 90% of the concentration levels at traffic locations; the concentration values for suburban background locations varied around 80% of the concentrations at traffic locations and the concentration value measured at the regional background location Mikulov-Sedlec varied around 72% of the concentrations measured at high-traffic locations in Brno (Fig. V.2.1). It can thus be stated that the regional background for suspended particulates PM10 corresponds to approximately 70% of the highest concentrations measured at high-traffic locations.
For PM2.5 particulates measured in the territory of the Brno agglomeration, it holds that the pollution limit level for the average annual concentration was exceeded in the past only at locations with high traffic levels (Fig. V.2.2). The pollution limit levels were not exceeded at the background locations. In 2016, the average annual concentration of PM2.5 decreased at almost all locations compared to 2015. The Brno-Masná location was an exception; there the average annual concentration of PM2.5 did not change; at the Brno-Tuřany location there was a slight increase in the average annual concentra- tion by 0.4 μg.m-3. The pollution limit value for the average annual PM2.5 concentration was not exceeded at any of the locations in 2016, similar to 2015.
In 2016, the pollution limit value was exceeded for the 24-hour PM10 concentration only at the Brno- Svatoplukova and Brno-Zvonařka locations (Fig. V.2.3). In addition to transport, construction activities also affected the elevated concentrations at the Brno-Zvonařka location (construction of a transformer station for the future South Centre, including the movement of heavy machinery) in the immediate vicinity of the station. The Brno-Tuřany suburban background location exceeded the pollution limit level during longer episodes with unfavourable dispersion conditions (2010–2011); the pollution limit level for daily concentrations of PM10 was not exceeded in the 2010–2016 period at the Brno-Soběšice background location. On an average, the highest 24-hour concentrations of PM10 were measured at transport locations in 2010–2016 (specifically, the 36th highest value connected with the legislation); the concentrations at urban background locations were almost identical with the values at transport locations (98%), while suburban locations measured concentrations of approx. 82% of the concentration levels at hightraffic locations: the values at the Mikulov-Sedlec regional background location were about 77% of the concentration values at high-traffic locations. Thus, the concentration levels at the individual types of locations are similar to the values of the average annual PM10 concentrations (Fig. V.2.3).
In connection with the greater number of days with worse dispersion conditions, the greatest number of days with concentrations larger than 50 μg.m-3 were recorded in January and December 2016. In the other months, there were very few days on which the pollution limit level for 24-hour concentrations of PM10 was exceeded, thanks to the very good or maximally slightly unfavourable dispersion conditions. The smallest number of days with average daily PM10 concentrations greater than 50 μg.m-3 in the territory of the Brno agglomeration were measured at the Brno-Líšeň location. Thus, this location exceeded the pollution limit levels for PM10 daily concentrations recorded at the Mikulov- Sedlec regional background location of Mikulov- Sedlec on only 5 days. On the other hand, the Brno- Zvonařka location recorded the greatest number of days with PM10 concentrations higher than 50 μg.m-3 in the Brno agglomeration; in addition to the close vicinity of high-traffic locations, this station is located close to a construction site (Fig. V.2.4).
The concentration trend since 1996 in the Brno agglomeration is very similar to the trend for the concentrations in Prague or the North-West zone. For the average annual concentrations, the trends have almost identical shape and very similar concentrations, indicating both a super-regional effect of meteorological conditions and also similar influences. Only the Moravian-Silesian region differs, because of different type of equipment. The trends in the 36th highest 24-hour concentration of PM10 or the average annual concentration of PM2.5 are similar In both cases, the concentrations in the Brno agglomeration are higher than in the Prague agglomeration, which could be caused both by the higher background concentration of suspended particulates in Moravia and also by the higher fraction of transport stations in Brno.
Nitrogen dioxide
The pollution limit level for the average annual concentration of NO2 was exceeded in the territory of the Brno agglomeration, but only at the locations with the highest traffic levels located in built-up areas forming a canyon (Brno-Svatoplukova, Brno-Úvoz (hot-spot)). This pollution limit level is not exceeded at transport stations that are located in open areas (Brno-Zvonařka, Brno-Výstaviště). The pollution limit level for the hourly NO2 concentration was not exceeded at any location.
Compared with the values measured in 2015, there was a substantial increase in the NO2 concentrations only at the Brno-Svatoplukova location (increase by 7.5 μg.m-3) and at the Brno-Arboretum location (increase by 4.8 μg.m-3). All the other locations had values approximately at the concentration levels measured in 2015. The concentrations measured at the Brno-Tuřany suburban background location in recent years varied under 20 μg.m-3 and had a decreasing tendency. The average annual concentration in 2016 was 15.2 μg.m-3, which is approx. 75% of the value of the average annual NO2 concentration in 2010. In contrast, the concentration values measured at the Brno-Svatoplukova location were almost identical throughout the whole measuring period; in fact the average annual concentration value in 2016 was slightly higher than the value measured in 2010 (Fig. V.2.5). This is a consequence of the stillincomplete outer ring road and the lack of a by-pass around Brno, where all the traffic moving from the north of Brno to the south or vice versa must pass through the centre of the city.
The trend in NO2 concentrations was quite even at all the stations in the monitored period. A slight decrease in concentration is apparent only at background locations.
Although the pollution limit value for the average annual NO2 concentration is exceeded at selected locations in the Brno agglomeration, on an average the values are approximately the same as the country-wide average values. There was a substantial increase in the cases of exceeding the hourly concentration limits in some years (2006, 2010) – this was especially true in years with much worse air quality in the cold season of the year as a result of poor dispersion conditions (2006) or a very long heating season (2010). Compared with the other agglomerations in the Czech Republic, the NO2 concentrations in the Brno agglomeration have long been lowest.
Benzo[a]pyrene
Polycyclic aromatic hydrocarbons (PAH), which include benzo[a]pyrene, are measured at two locations in the territory of the Brno agglomeration – in the centre of the city with high traffic levels (Brno-Masná) and in a residential background location (Brno-Líšeň). The Kuchařovice location is employed as a background location for the Southern Moravian region. While the value of the pollution limit level was exceeded at the transport location of Brno-Masná in 2010–2012, the concentrations at the Brno-Líšeň location never exceeded this limit. In 2013–2015 the concentration at Brno-Masná decreased dramatically to a level of 50% of the concentration in 2012 and the concentration was identical with the Brno-Líšeň background location or with the rural Kuchařovice background location. In 2016, there was a slight increase in the benzo[a]pyrene concentration at the Brno-Masná location while there was a slight decrease in the concentrations at the Brno-Líšeň and Kuchařovice locations (Fig. V.2.6). The concentration values of benzo[a]pyrene in the summer vary around very low values and in the winter reach a maximum of about 4 ng.m-3. Household heating is the most important source of benzo[a]pyrene in the Czech Republic. Thus, in the heating season, substantially higher concentrations can be measured in small settlements of the Southern Moravian region with local heating units than in the Brno agglomeration with central heat supply and heating plants using natural gas as a fuel. This situation was supported by measurements during episodes with worse dispersion conditions at the beginning of November of 2015. Similarly, in the 2016 heating season, another two locations were measured and, although there was no great deterioration in air quality in this period, substantial cooling and more intense heating were sufficient to increase the benzo[a]pyrene concentration at Jinačovice to ten times that measured at Brno-Líšeň (Fig. V.2.7).
From the viewpoint of long-term concentration trends, in the Brno agglomeration, similar to Prague or the North-West zone, values vary in the close vicinity of the pollution limit values. The values in Brno are approximately one half of the country-wide average annual concentrations for benzo[a]pyrene.
Tropospheric ozone
Monitoring of tropospheric O3 was performed in 2016 at four locations in the territory of the Brno agglomeration. Background concentration values are measured at the Brno-Tuřany, Brno-Lány and Brno-Dětská nemocnice (Children's hospital) locations. O3 is also measured at the Brno-Zvonařka station in the centre with high traffic levels. For comparison, the regional background station at Mikulov-Sedlec was also included. In the long term, the O3 concentration at the Mikulov-Sedlec location has exceeded the pollution limit level on an average for 3 years. Similar concentrations were also measured at the Brno-Tuřany location. While the pollution limit level was not exceeded here in 2014, this value was again exceeded in 2015 and especially 2016 because of the above-average warm summer. In fact, it was worse than the Mikulov- Sedlec location in 2016 in the number of vales exceeding the pollution limit level on an average over 3 years. The transport location of Brno- Zvonařka has long had the lowest concentration values. After a gradual increase in the number of values exceeding the limit in 2012–2015, there was a decrease in 2016 to the 2011 and 2012 levels, which corresponds to approximately one eighth of the permitted frequency of exceeding the pollution limit level for tropospheric ozone (Fig. V.2.8).
The long-term trend in the tropospheric O3 concentration is dependent on the meteorological conditions, especially in the summer when the maximum concentrations are attained. Lower concentrations are attained than in rural areas, manifested at the above-mentioned locations. Although the Brno-Tuřany station is not a rural location, the concentrations are higher in the long term here than in the centre of the city and, in 2016, were even higher than at some rural stations.
V.2.2 Emissions in the agglomeration of Brno
At the present time, approx. 590 places of operation of sources of air pollution included in the REZZO 1 and REZZO 2 databases are individually registered in the territory of the Brno agglomeration. Only several dozen of them have a substantial effect on overall emissions. These are primarily heating sour-ces (Teplárny Brno, a. s.), communal waste incine-rators (SAKO Brno, a. s.) and a few places of opera-tion of the former extensively developed machine production branches (e.g. Slévárna REMET, s. r. o.). According to the outputs of SLDB 2011, central hea-ting sources predominate in heating households (54% of apartments), followed by gas boilers and local gas boilers (together 37% of apartments). Coal, wood or coke is used as a fuel in only a small part of the apartment fund, primarily around the edges of the city. Similarly, a large portion of the buildings of the communal sphere are connected to central heating sources or have their own gas boilers.
There was a decrease in monitored emissions at the above-mentioned important sources in 2002–2015. This decrease for SPM is connected with modernisation or termination of operation of some technological production processes, especially foundries (e.g. Slévárna Zetor and Šmeral foundries). Based on current data in the summary operating records, one of the most important sources of SPM emissions is Eligo, a. s., which specialises in the production of dried milk products. This is followed by foundry operations (e.g. Královopolská slévárna and Slévárna HEUNISCH Brno), for which, in addition to reported SPM emissions, a certain fraction of difficult-to-identify fugitive emissions can also be expected.
A decisive fraction of SO2 emissions is produced by the SAKO Brno, a. s. communal waste incinerator. The emissions from heating plant sources were substantially reduced only with reduction of the combustion of high-sulphur heating oils and the subsequent transition to use of only natural gas as a fuel.
In addition to gradual modernisation of heat sources, the shutting down of the units of TEDOM – ERDING, a. s., Brno – Kolejní gas boiler, which in 2002 still produced more than 200 t.p.a. emissions, also contributed to the reduction in NOx emissions. For the individual monitored sources, compared to 2015 there was an inter-annual increase especially in CO emissions (REMET, spol. s r. o., Brno operations) and a decrease in SPM emissions (reduction at Eligo, a. s., Brno registered branch by 23.5 t). There was a slight inter-annual increase (by about 4%) in SO2 and NOx emissions.
V.2.3 Summary
From the viewpoint of air quality, Brno has a basic problem with the transport locations with the highest traffic levels. Because of the incomplete city outer ring road and lack of a by-pass, all transit transport as well as people travelling between the north and south of Brno must pass through the centre. Where this route leads through a canyon in built-up areas, there is insufficient ventilation of the locations and the pollution limit levels are consistently exceeded for 24-hour concentrations of PM10 and the average annual concentrations of NO2. Meteorological conditions in the heating season are fundamental for background locations. Exceeding of the pollution limit levels for 24-hour PM10 concentrations at the background locations, such as Brno-Líšeň, Brno-Soběšice and Brno-Tuřany, occurs only in years with longer intervals of unfavourable dispersion conditions (2005, 2006, 2011) or in years with long heating seasons (2010). In years with a large number of hot sunny days, the pollution limit levels can be exceeded for tropospheric ozone, but only at suburban locations, such as Brno-Tuřany. The pollution limit level for ozone is not exceeded in the urban environment. From the viewpoint of the other pollution limit levels, no pollution limit level is exceeded over a longer period of time at the Brno background locations, even in years with worse dispersion conditions in the heating season.
Since 2010, the pollution limit levels have been exceeded in the Brno agglomeration for suspended particulates (PM10 and PM2.5), NO2 and benzo[a]pyrene and tropospheric ozone. In 2016, the pollution limit level was exceeded for the 24-hour PM10 concentration at two stations. The pollution limit level was also exceeded for tropospheric ozone, but only at the Brno-Tuřany location.
V.2.4 Pollution roses for the Brno
agglomeration (locality Brno-Tuřany)
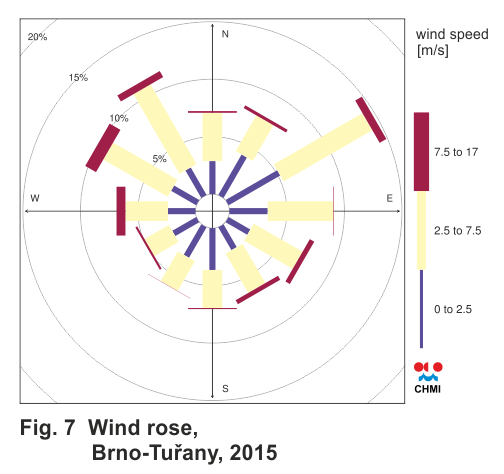
Pollution roses were created from data from the Brno-Svatoplukova automatic pollution level monitoring station. The station is located in the Židenice barracks, in the close vicinity of Svatoplukova street, which is part of the Brno outer ring road (VMO). Both sides of Svatoplukova street are builtup so that it forms a north-south canyon. This is also reflected in the wind rose, in which northerly winds prevail, together with southerly and south-westerly winds. The easterly direction is completely lacking because the Židenice barracks line the side of the street. Only low wind speeds are measured because of the buildings (Fig. 7, Annex III).
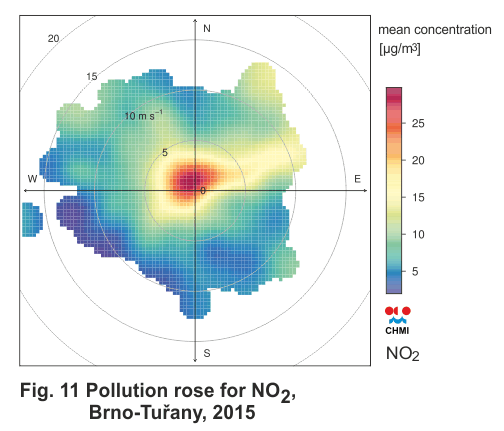
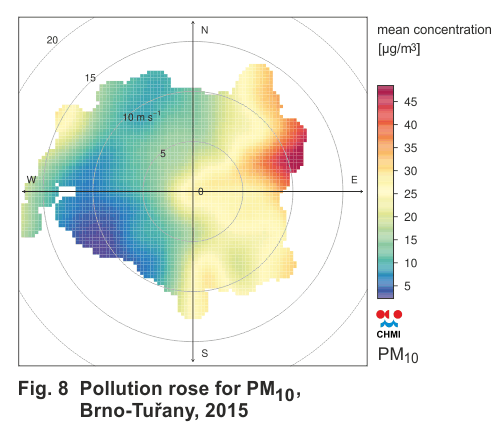
As mentioned, the VMO passes quite close to the measuring station, with approx. 48 thousand vehicles a day according to the traffic census of 2015. This is manifested especially in the concentrations of NOx and suspended particulates. This is the only location in the Brno agglomeration where the pollution limit levels are simultaneously exceeded for the average daily concentration of PM10 and the average annual concentration of NO2. Since the middle of 2016, roads in Brno have been fitted with sensors measuring traffic intensities. Conditions at Brno-Svatoplukova in July–December 2016 are described in Fig. 11, Annex III. It thus follows that traffic rates of either below 500 vehicles per hour (at night) or 3000–3500 vehicles per hour (in the daytime) predominate. This is documented very well by the daily variation in intensities, supplemented by the daily variation in concentrations of nitrogen oxide (NOx) and suspended particulates in the PM10 and PM2.5 fractions (Fig. V.2.13). The time is given as Coordinated Universal Time (UTC) in accordance with measuring air quality in the pollution monitoring network. It is immediately apparent that the NOx concentration is correlated very well with the traffic intensity. There is an increase in the PM10 concentrations in the morning, but the values culminated at the time when the NOx concentrations began to decrease slightly. Then there is a decrease in PM10 concentrations, followed by an increase again in the evening. The situation is even more complicated for PM2.5: in contrast to the night time values, there is a slight increase in the morning, followed by a decrease with a minimum between 12 and 14 hours UTC. The concentrations then begin to increase again, with a maximum around 20 hours UTC. Coordination of the daily variation in SPM concentrations with transport is thus not as convincing as for NOx, which is confirmed by the following graphs in Fig. 8, Annex IIIFig. V.2.12. The pollution rose for suspended particulates PM10 and PM2.5 (Fig. 8, Annex III) greatly reflects buildings and the wind direction at the location. The highest concentrations were measured in the southerly directions, where there are cross-roads and vehicles are forced to start up (or brake in the opposite direction). However, elevated concentrations are also apparent at low wind speeds for westerly winds, where there are often line-ups and cars are braking. For understanding the elevated concentrations, it is however necessary to separate the pollution roses according to the seasons of the year (Fig. 10, Annex III) or the measured air temperatures (Fig. 9, Annex III). It then follows that the greatest concentrations are measured in the autumn and winter months, and at temperatures below 0 °C. It is thus confirmed that the concentrations of suspended particulates are not strongly correlated with traffic levels – but are dependent on additional factors, especially the meteorological conditions and local heating sources during the heating season. This was also confirmed by the daily and annual variation in concentrations divided according to the wind direction (Fig. 11, Annex III). The annual variations (on the right) show a clear increase in concentrations in the winter, while concentrations are lower in the summer and are comparable with the background concentrations in Brno. The daily variation reflects the effect of both transport and peak traffic times, with low smoothness of traffic conditions and the emissions of particulates are greatest; however, it is also apparent from the daily variations that the concentrations decrease during the day, with high concentrations at night (time given in UTC), reflecting not only the effect of traffic levels but also of heating on the PM10 concentrations at this location. It is also necessary to take into account the meteorological conditions, where the effect of temperature decreases at night can lead to a temperature inversion at low altitudes, resulting in worsening of the dispersion conditions.
Fig. 12, Annex III shows a comparison of the PM10 concentrations with traffic levels in July–December 2016. Elevated concentrations can already be observed at low traffic levels, the maximum was between 1000 and 3000 vehicles per hour; at larger numbers of vehicles, the concentrations decrease again. In contrast to the temperature dependence, there is no direct dependence here; however, it is apparent that a low number of vehicles increases the PM10 concentration close to the station. This could be a result of resuspension and stirring-up of dust, participating in increasing the concentrations at this location at low traffic intensities.
The concentrations of nitrogen oxide at the Brno- Svatoplukova location have long exceeded the pollution limit levels for the average annual NO2 concentrations. This is a result of the closed nature of the location in a built-up "canyon" and high traffic intensities. Traffic is practically the only source of nitrogen oxide, as is confirmed by Fig. V.2.12 and Fig. V.2.13, where a correlation between transport and NOx concentrations is clearly visible, in contrast to suspended particulates. The pollution roses for NO2 and NOx are depicted in Fig. 13, Annex III. Both roses look similar, but the scale is quite different – the concentrations of nitrogen monoxide (NO) are very high at this location. This substance is produced only by transport and, thanks to the measurements in the close vicinity of the roadway, it is still detected as NO before it has time to react, e.g. with ozone to form NO2. Consequently, it is preferable to use the sum of nitrogen oxides for correlation with traffic levels, because this includes both NO and NO2. The effect of transport also is clearly visible from the daily variations (Fig. 14, Annex III), where high concentrations can be seen at peak traffic times. In contrast to the daily variations in PM10, a difference is apparent at night, when the NOx concentrations substantially decrease, while the PM10 concentrations remain high. In the annual variations in the NOx concentrations, it can be seen that the NOx concentrations are higher in the wintertime. There are probably a greater number of causes for this, from lower formation of tropospheric ozone, through worse dispersion conditions to the effect of heating. Nonetheless, the NOx concentrations can be readily correlated with transport, which also follows from the pollution roses. It is apparent from Fig. 15, Annex III that, roughly to 1000 vehicles per hour, the NOx concentrations are relatively low; after this, however, they begin to increase and, at intensities above 3000 vehicles, the NOx concentrations are very high at the location.

Fig. V.2.1 Average annual PM10 concentrations in selected
localities and at individual types of stations, Brno agglomeration, 2010–2016
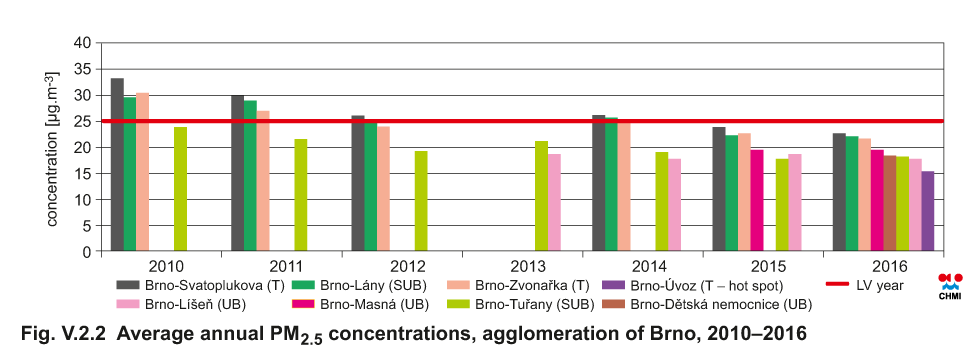
Fig. V.2.2 Average annual PM2.5 concentrations, Brno agglomeration, 2010–2016
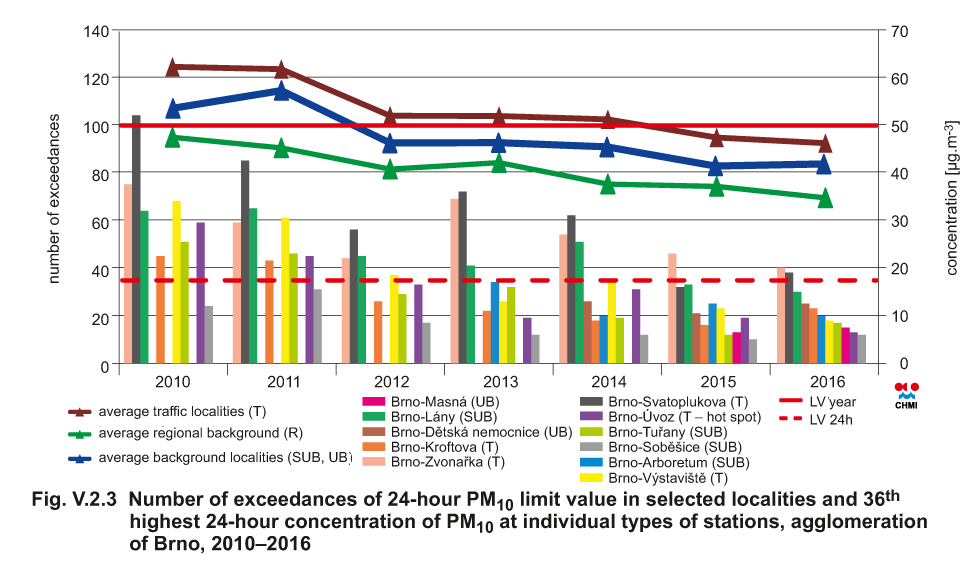
Fig. V.2.3 Number of exceedances of 24-hour PM10 limit value in
selected localities and 36th highest 24-hour concentration of
PM10 at individual types of stations, Brno agglomeration,
2010–2016
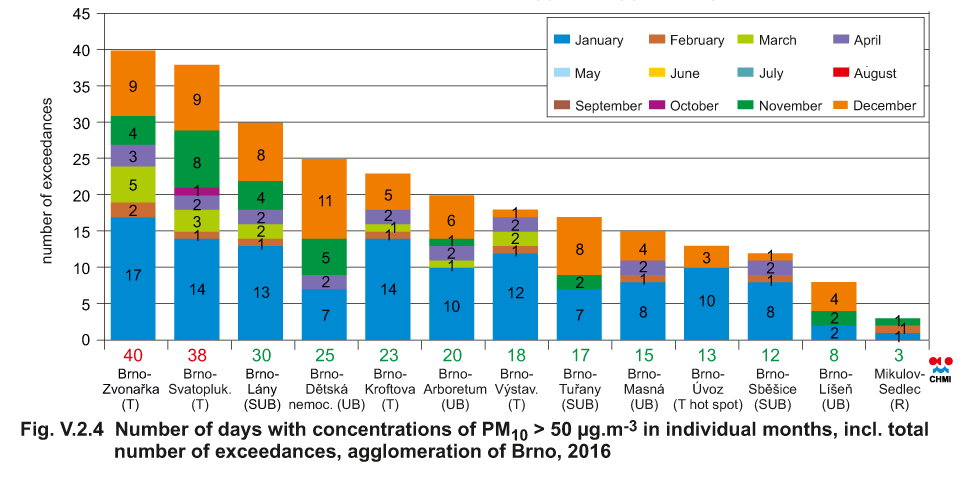
Fig. V.2.4 Number of days with concentrations of PM10 > 50
µg.m-3 in individual months, incl. total number of exceedances,
Brno agglomeration, 2016
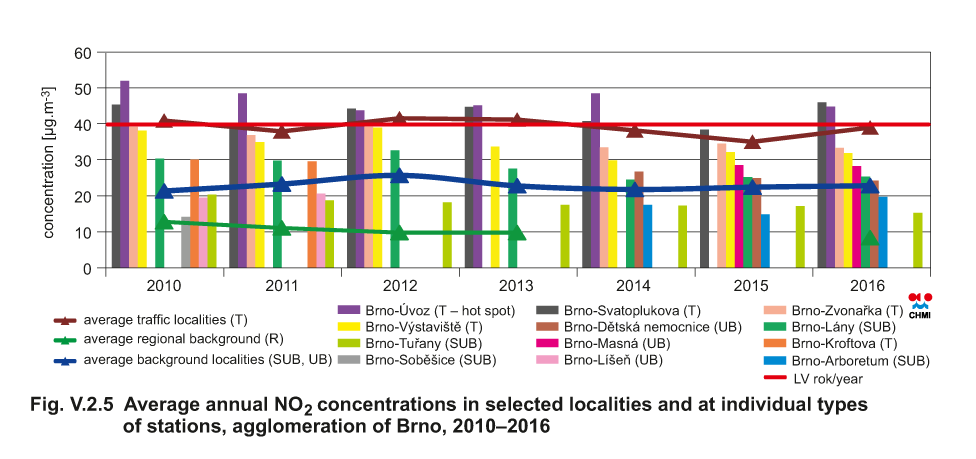
Fig. V.2.5 Average annual NO2 concentrations in selected
localities and at individual types of stations, Brno agglomeration, 2010–2016

Fig. V.2.6 Average annual benzo[a]pyrene concentrations,
Brno agglomeration, 2010–2016
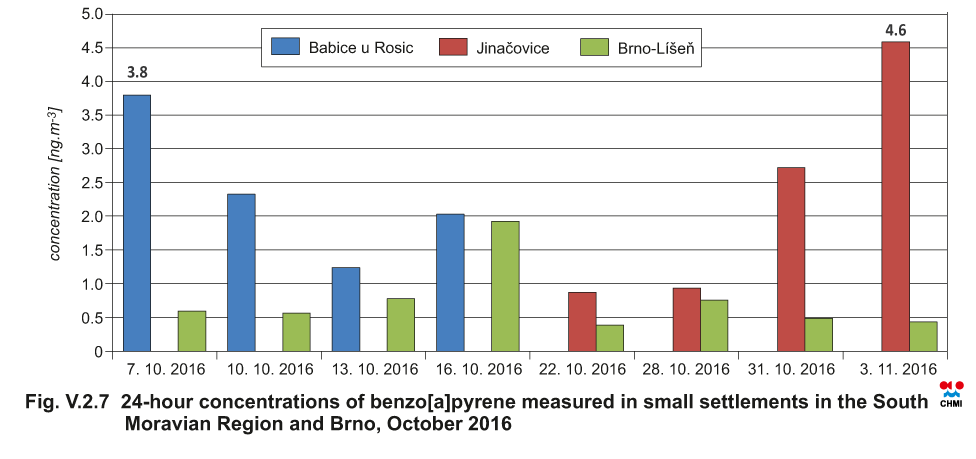
Fig. V.2.7 24-hour concentrations of benzo[a]pyrene measured in small settlements in the South
Moravian Region and Brno, October 2016
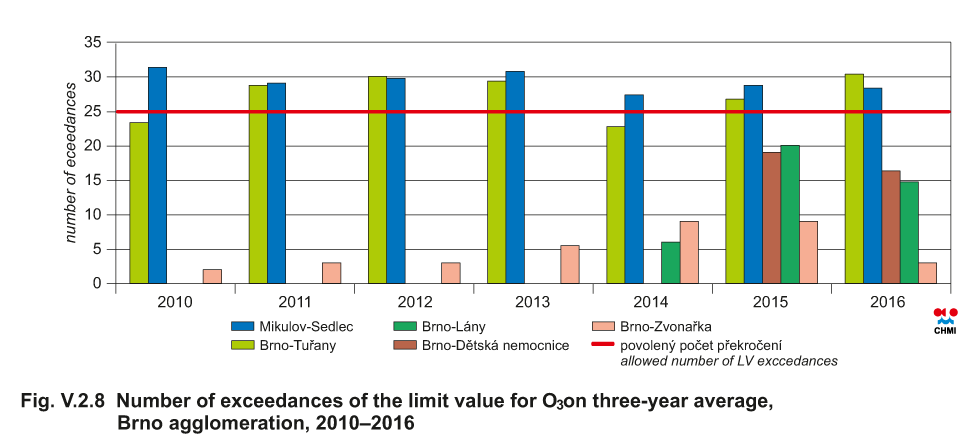
Fig. V.2.8 Number of exceedances of the limit value for O3 on three-year average,
Brno agglomeration, 2010–2016
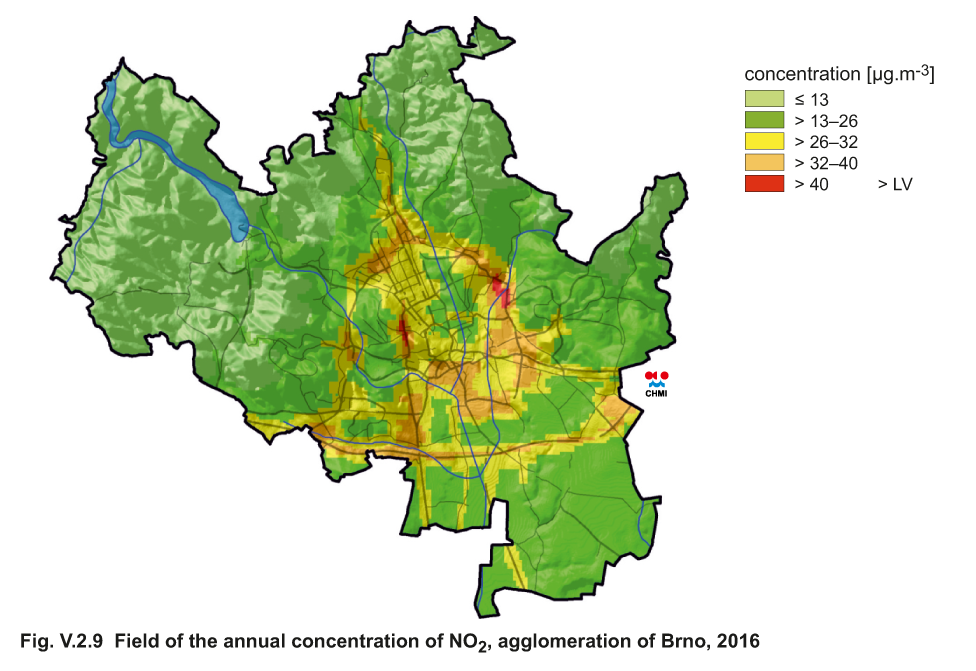
Fig. V.2.9 Field of the annual concentration of NO2,
Brno agglomeration, 2016
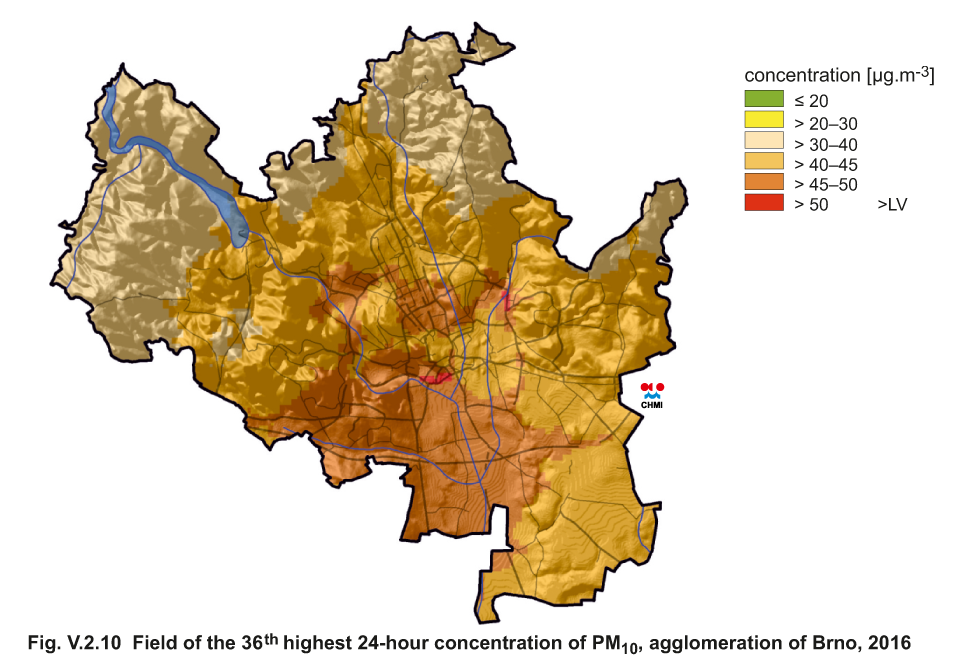
Fig. V.2.10 Field of the 36th highest 24-hour concentration of
PM10, Brno agglomeration, 2016
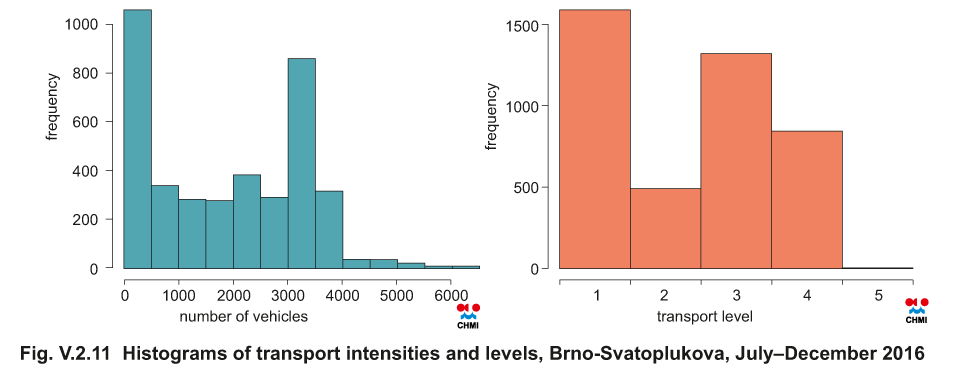
Fig. V.2.11 Histograms of transport intensities and levels, Brno-Svatoplukova, July–December 2016
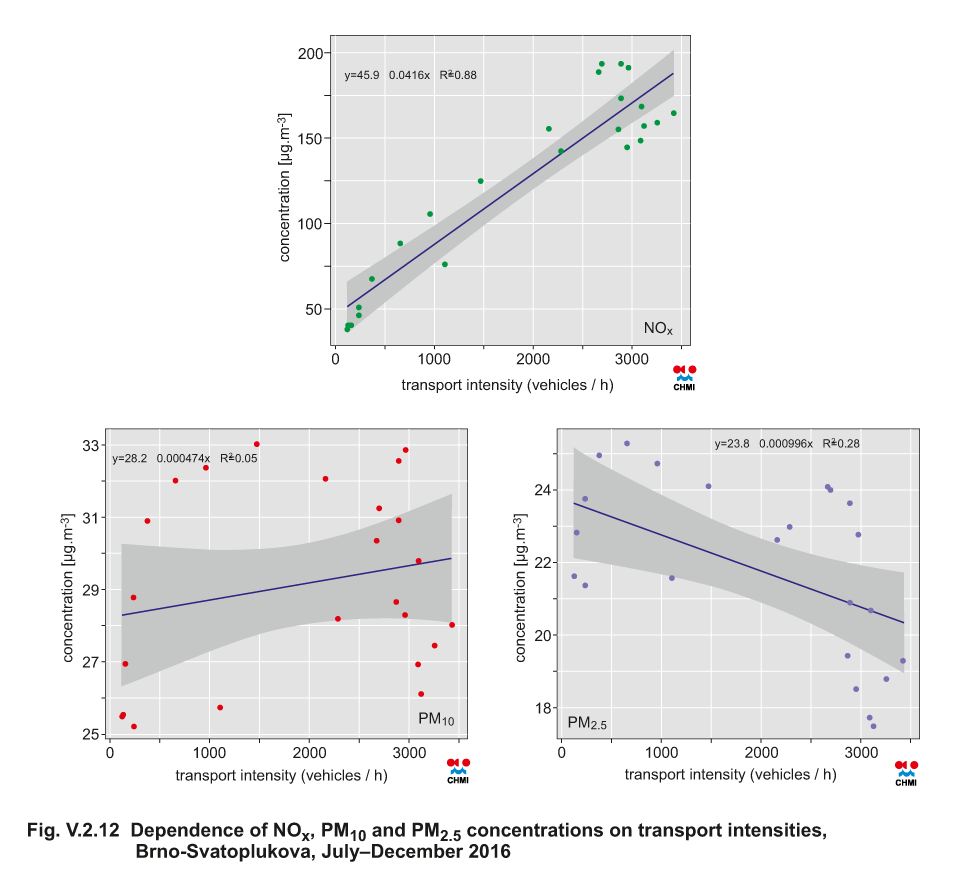
Fig. V.2.12 Dependence of NOx, PM10 and PM2.5 concentrations on transport intensities,
Brno-Svatoplukova, July–December 2016
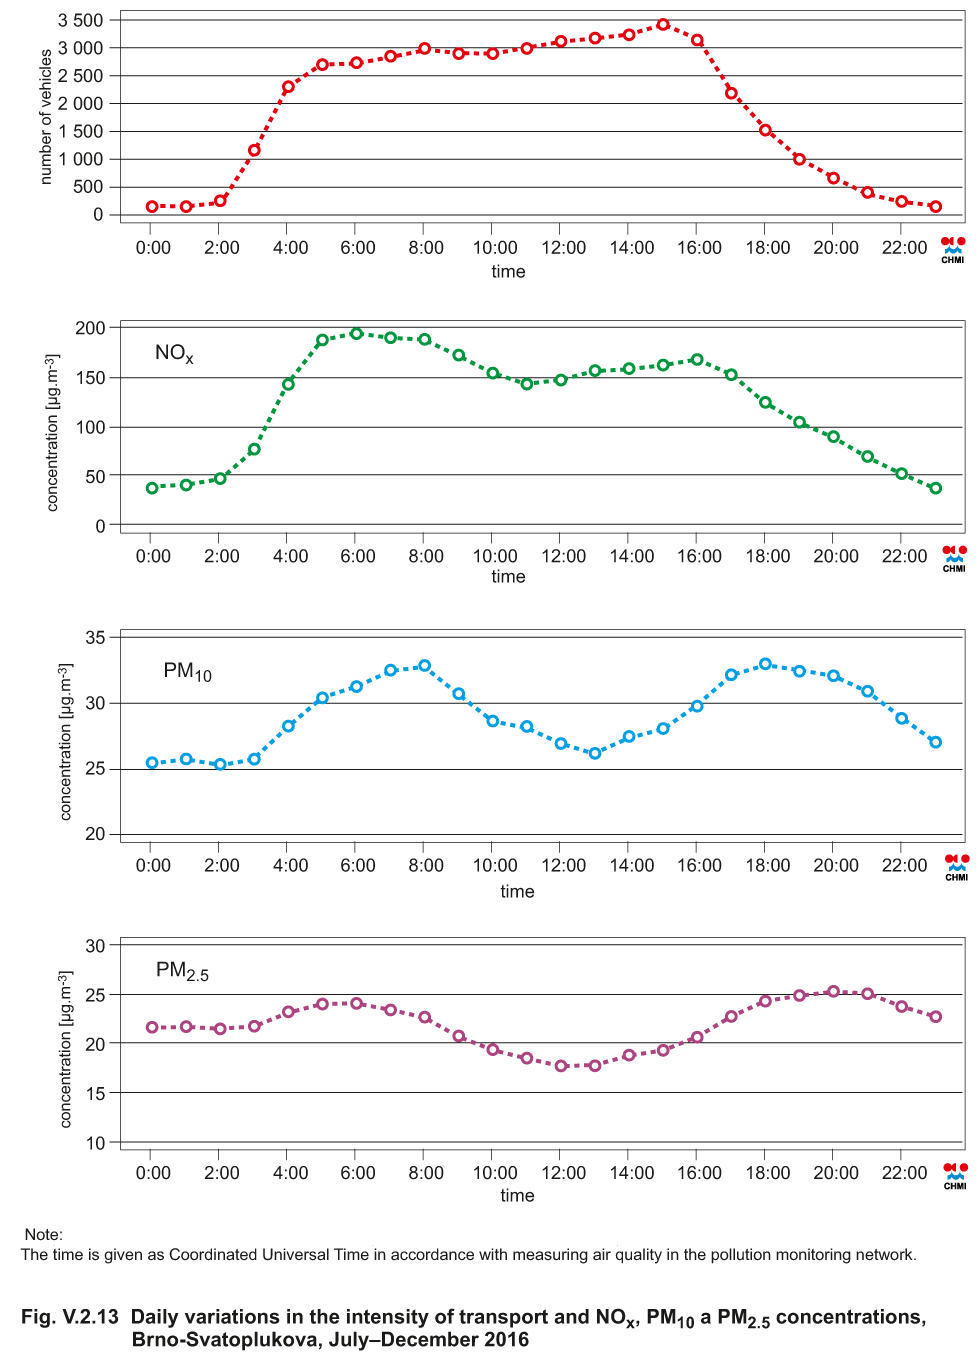
Fig. V.2.13 Daily variations in the intensity of transport and NOx, PM10 and PM2.5 concentrations,
Brno-Svatoplukova, July–December 2016