V.1 THE CAPITAL CITY OF PRAGUE
The air of the Capital City of Prague is among the most polluted in the Czech Republic. This situation is a result of the interaction of a number of natural factors and especially the effect of the high population concentration and the related dense transport network.
The specific position of Prague in the complex terrain of the Prague basin fundamentally affects the climatic conditions and dispersion conditions in the territory (Ložek et al. 2005). The Moldau valley is generally insufficiently ventilated and, especially in the colder part of the year, suitable conditions are formed here for the formation of temperature inversions, when much warmer air is pushed down over cold air near the cold surface of the Earth. The heavy cold air remains close to the ground and does not allow pollutants to disperse into higher layers of the atmosphere. This leads to elevated pollutant concentrations in the motionless ground-level layer of the air (Bednář, Zikmunda 1985).
The worsened quality of the air in Prague is related mainly to the heavy traffic levels. Thanks to its position, Prague is not only the main cross-roads of the highway network of the Czech Republic, but is also an important cross-roads in international transport. A large portion of main transport through-roads lead directly through the centre of Prague. However, the current roadway network inside the city is not capable of absorbing such an enormous concentration of traffic and is overloaded, with frequent traffic jams. Partial improvement of traffic conditions should follow primarily from completion of by-pass circuit roads around Prague, substantial reduction of individual automobile transport in the most crowded areas and emphasis on railway and municipal mass transport (IPR Praha 2012).
As a result of its historical development, Prague has a developed industrial infrastructure (IPR Praha 2012). In the recent past, a number of unsatisfactory industrial facilities have been closed or production reduced; on the other hand, the services sector has increased in importance, with the construction of new commercial and administrative centres, placing considerable demands on transportation services and consumption of energy, including heating.
The consumption of solid fuels for heating family homes, especially in suburban parts of the city, also have a considerable effect on the pollution levels.
V.1.1 Air quality in the agglomeration of Prague
Suspended particles PM10 and PM2.5
The pollution limit level for the 24-hour PM10 concentration (the value of 50 μg.m-3 must not be exceeded more than 35 times a year) was not exceeded at all in 2016 in the territory of the Prague agglomeration last year at any of the 13 locations with enough data for the evaluation. The greatest number of exceedances of the limit value was recorded at the Prague 10-Vršovice station (27 times), classified as a high-traffic location. In 2014, the decreasing trend in the average 24-hour concentrations, calculated separately for hightraffic and background stations, was interrupted, but was renewed again in 2015 (Fig. V.1.1). The relatively steep decrease in average 24-hour PM10 concentrations in 2015 was affected by the very favourable meteorological and dispersion conditions, which were also favourable in 2016 (Chap III), when there was a slight decrease in PM10 concentrations compared to the previous year (Fig. V.1.1).
In 2016, similar to previous years, the annual pollution limit level for PM10 (40 μg.m-3) was not exceeded at any location of the 13 that were relevant for evaluation the annual concentrations.
High concentrations of suspended particulates PM10 a PM2.5 and the most frequent exceeding of the 24-hour pollution limit level for PM10 generally occur in the cold part of the year, when the emissions of suspended particulates (SPM) are greater as a consequence of greater intensity of heating (including local heating units) and greater emissions from transport (elevated abrasion of the material of roadways because of grit spreading and subsequent resuspension of the material; EC 2011) and also less favourable meteorological conditions for dispersion of pollutants. In the Prague agglomeration in 2016, the greatest number of cases of exceeding the 24-hour pollution limit level (not more than 35 times) occurred in the months of January, December, November, April, September and October (Fig. V.1.2). More frequent occurrence of unfavourable dispersion conditions was observed in these months compared to the other months (Fig. III.4).
The pollution limit level for the average annual concentration of suspended particulates PM2.5 was not exceeded in 2016 at any of the five stations with enough data for the measurement (Fig. V.1.3). The highest concentration (19.5 μg.m-3) was measured at the Prague 5-Smíchov station, which is classified as a high-traffic location. An increase in the PM2.5 concentration compared to the previous year was apparent at this location in 2016, while a decrease in this concentration can be seen at the Prague 2- Legerova (hot spot) station (Fig. V.1.3).
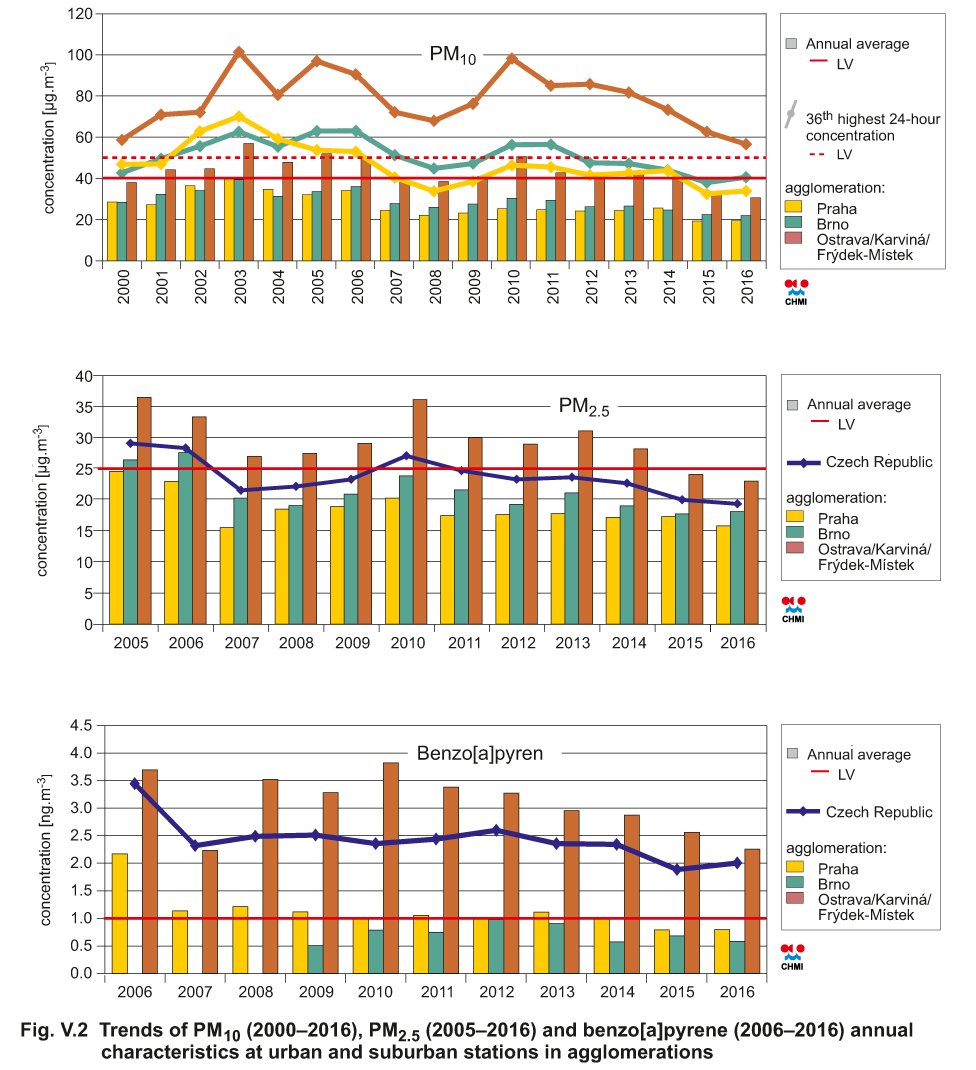
The trend in the pollution level characteristics for PM10 was evaluated on the basis of data from the stations for which a complete time series since 2000 is available (Fig. V.2). After the sharp decrease in PM10 until 1999, the concentration increased again and reached a maximum in 2003 as a consequence of unfavourable dispersion conditions in February and December and a subnormal amount of precipitation. Since 2003, pollution levels have decreased in an overall trend, although there are fluctuations between the individual years, especially as a consequence of meteorological and dispersion conditions. Higher PM10 concentrations were thus measured, e.g. in 2006, 2010 and 2011. The 36th highest daily concentration of PM10 in 2012–2014 did not display a marked trend. A sharp decrease is apparent in 2015 and the 36th highest daily concentration and the annual average PM10 concentration remained constant in 2016. The average annual concentration of PM10 has remained below its pollution limit level since 2004, inclusive, and the 36th highest daily concentration of PM10 has remained below the pollution limit level since 2007, inclusive; however, in some years the concentration approached the value of the daily pollution limit level (2010 and 2011).
The trend in the pollution level characteristics for PM2.5 was evaluated on the basis of data from the stations for which a complete time series since 2005 is available. The annual average concentration attained the highest values in 2005, 2006 and 2010. In 2005 and 2006, the annual concentration (averaged for all the stations) even exceeded the pollution limit level. Between 2011 and 2015, the values of the PM2.5 concentrations remained constant. In 2016, the PM2.5 concentration decreased slightly (Fig. V.2).
Nitrogen dioxide
The hourly pollution limit level of 200 μg.m-3 was not exceeded in 2016 at any location of the 10 relevant evaluations. The value of the pollution limit level was exceeded twice and once, respectively, at the Prague 5-Smíchov a Prague 2-Legerova (hot spot) locations. The permitted number of values exceeding the limit is 18. The hourly pollution limit level for NO2 (200 μg.m-3) was not exceeded at any of the locations in 2016.
From the viewpoint of exceeding the pollution limit values, the concentrations of NO2 are problematic in Prague, especially around the above-mentioned high-traffic station of Prague 2-Legerova (hot spot), where NO2 has been measured since 2003. This station is oriented towards monitoring pollution from transport. However, the hourly pollution limit level has not been exceeded here since 2012 (Fig. V.1.4).
The annual pollution limit level for NO2 (40 μg.m-3) was exceeded at two locations in the Prague agglomeration. These were the high-traffic Prague 2-Legerova (hot spot) location (annual average concentration of 53.6 μg.m-3) and Prague 5- Smíchov (43.5 μg.m-3).
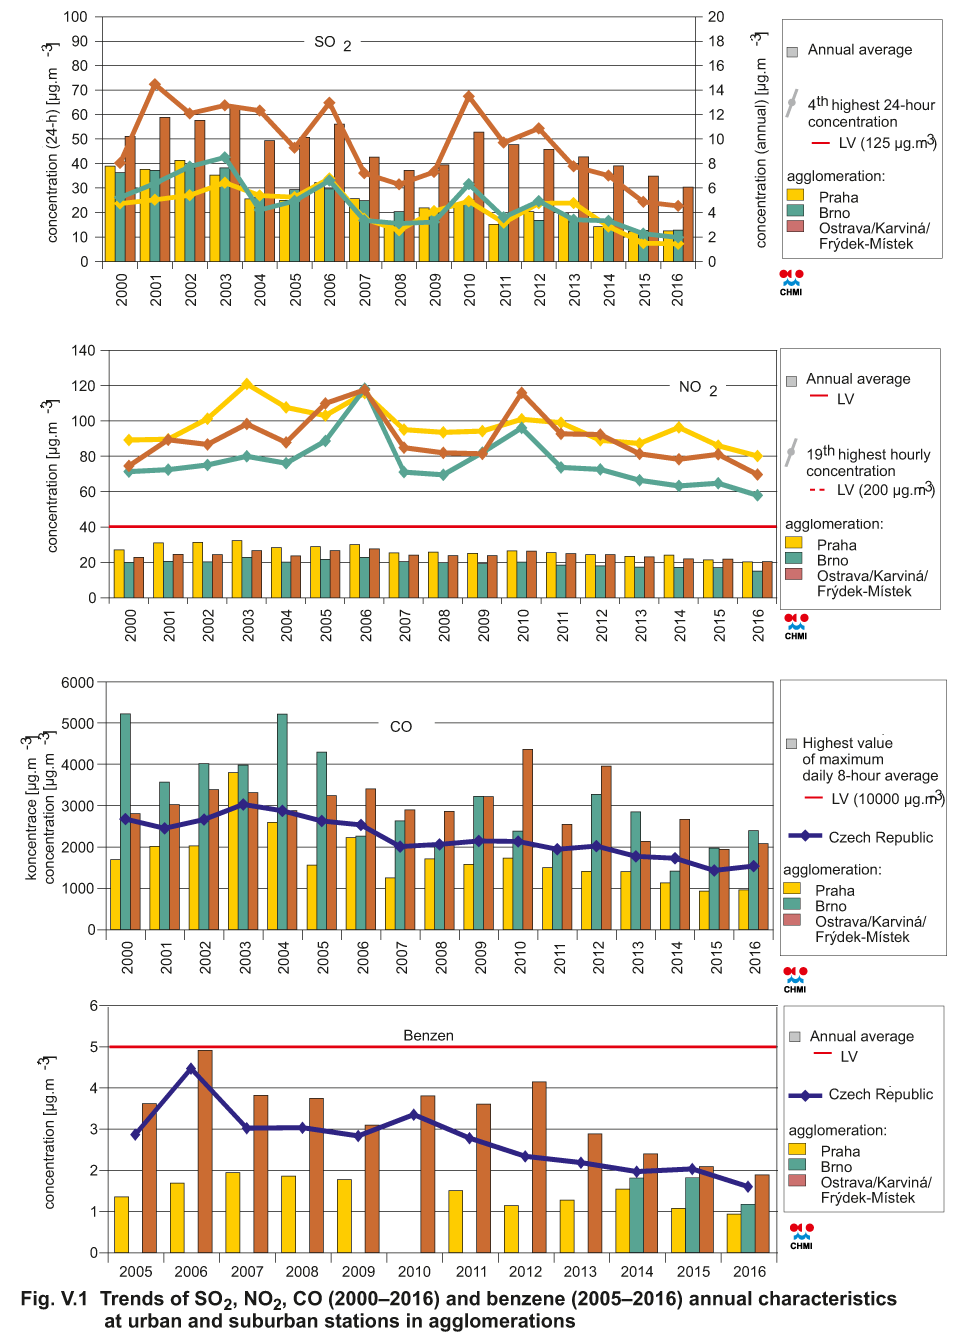
The trend in pollution level characteristics for NO2 is evaluated on the basis of data from the stations for which there is a complete time series since 2000 (Fig. V.1). The decreasing trend in NO2 concentrations in the 1990's stopped in 2000 and then the concentrations increased until 2003. The higher NO2 concentrations in that year were a consequence of both unfavourable dispersion conditions and a subnormal amount of precipitation. Since 2003, the pollution level characteristics for NO2 have decreased in the overall trend, but there have been inter-annual fluctuations, especially as a result of the predominating meteorological and dispersion conditions. An increase in the average and 19th highest value were recorded in 2006 and 2011. Since 2011, the pollution level characteristics of NO2 have decreased very slightly, with the exception of 2014, when the 19th highest concentration value increased from the value in the previous year. A slight decrease in the pollution level characteristics for NO2 was apparent in 2015 compared to the previous year. This decrease continued in 2016. Since the beginning of evaluation, the pollution level characteristics for NO2 have remained below their pollution limit values. However, it can be assumed that the pollution limit values could be exceeded at other locations with high traffic levels, where measurements are not performed.
Benzo[a]pyrene
In 2016, the pollution limit level for the concentration of benzo[a]pyrene was not exceeded at any of the three stations in the territory of the agglomeration of Prague. The annual average concentration remained below the annual limit level (0.8 ng.m-3) at the stations of Prague 10-Šrobárova and Prague 4-Libuš. In the evaluated period since 2000, the concentration of benzo[a]pyrene attained the highest level in 2006, after which it decreased to 2009 and did not exhibit any marked trend between 2010 and 2014. The concentration of benzo[a]pyrene decreased in 2015 and the concentrations in 2016 were almost at the same level as concentrations in the previous year (Fig. V.2 and Fig. V.1.5). Since commencement of measurement of this substance, the pollution limit level was exceeded each year until 2014 at least one measuring station in the territory of the Prague agglomeration (Fig. V.1.5).
Tropospheric ozone
In 2016 the pollution limit level for tropospheric ozone was exceeded at three locations (as an average for 3 years, 2014–2016): Prague 6-Suchdol (29 times), Prague 4-Libuš (28 times) and Prague 5- Stodůlky (26 times), where the permitted number of exceedances is 25. The pollution limit level was exceeded at three locations for the first time since 2008. Exceeding of the pollution limit level at the Prague 6-Suchdol location occurred in the 2006–2013 and in 2016 (Fig. V.1.6). In 2015, the stagnating trend was interrupted and there was a substantial decrease in the number of times the pollution limit level was exceeded on an average at the location. In 2016, this decreasing trend applied to the average of the urban background locations (Fig. V.1.6). In 2015 and 2016, this fact was affected by the high temperatures and solar radiation in the summer months. In 2016, the months of July and September had highly above-normal temperatures (Chap. III). The lowest concentrations were measu-red at the high-traffic station of Prague 9-Vysočany, corresponding to the formation of tropospheric ozone and the variations in its concentration (Chap. IV.4.3).
Other substances
For other atmospheric pollutants set forth in the legislation (CO, SO2, benzene, heavy metals), the Prague agglomeration has long been below the pollution limit levels. The concentrations of SO2, Ni and Cd exceeded their pollution limit levels at several stations in the 1990's; after 2000, above-limit average arsenic concentration levels were recorded at the Prague 5-Řeporyje station, for the last time in 2011. Nonetheless, the concentrations of these substances also react to the predominant meteorological and dispersion conditions, so that an increase in some pollution level characteristics for these pollutants was recorded, e.g. in 2003, 2006, 2010 and 2011.
V.1.2 Emissions in the agglomeration of Prague
At the present time, approx. 1970 places of operation of sources of air pollution included in the REZZO 1 and REZZO 2 databases are individually registered in the territory of the agglomeration of Prague. However, only several of them have a substantial effect on overall emissions. These are primarily the cement plant Radotín (Českomoravský cement, a.s), ZEVO Malešice (Pražské služby, a. s.), heating source Veolia Energie Praha, a. s., and, of industrial enterprises, e.g. MITAS, a. s. and Kámen Zbraslav, located at the boundary between Prague and the Central Bohemian region. Recently, the emission fraction from the production of electrical energy in cogeneration units has also increased (e.g. ÚČOV PVaK and TEDOM Daewo-Avia Letňany). In 2015 and 2016, the fraction of emissions from the largest heating plant in Malešice decreased substantially; only gas-burning boilers were in operation here. According to the outputs of SLDB 2011, central heating sources predominate in heating households (52% of apartments), followed by gas boilers and local gas boilers (together 31% of apartments). The fraction of heating by electrical energy is substantial (approx. 5%) as is that from difficult-to-classify other means (relatively high fraction of approx. 10%). Coal, wood or coke is used as a fuel in only a small part of the apartment fund, primarily around the edges of the city. Similarly, a large portion of the buildings of the communal sphere are connected to central heating sources or have their own gas boilers.
There was a decrease in monitored emissions at the above-mentioned important sources in 2002–2015. For heating plant sources, this reduction is connected primarily with implementation of an extensive project for connection of the Mělník-Prague heating plant system, commenced in 1995. A fundamental decrease in SO2 emissions was connected with reduction of the amount of black coal burned in the Malešice heating plant (since 2011) and, at the present time (since 2015), also shutting down of the coal-burning boilers for an indefinite period of time.
The burdening of Prague by emissions is quite specific in this country. Point and extensive sources operated in its territory are, with a few exceptions, minority factors and the greatest fraction of emissions is derived from transport (Fig. V.1.9). As important sources generally have tall chimneys, their contribution to air pollution is usually manifested outside the territory of Prague.
Frequently the decrease in reported SPM emissions from REZZO 2 sources is a result, rather than of an actual decrease in emissions, of the methodological change in reporting emissions from stone quarries, based on application of the provision on the means of determining the amount of emissions.
V.1.3 Summary
The Capital City of Prague is an area in which a great many people are exposed to air pollution. The pollution limit levels for suspended particulates, nitrogen dioxide and benzo[a]pyrene were exceeded over a long time in the agglomeration of Prague The pollution limit level for tropospheric ozone is generally exceeded in the suburban areas of Prague. Exceeding of the pollution limit levels is related to the high traffic levels in the Capital City and also with heating households, especially in areas with family homes. Mobile sources contribute 60% to overall emissions of suspended particulates (SPM) and approx. 70% to overall emissions of nitrogen oxides (NOx) in the Prague agglomeration.
In 2016, the pollution limit level was not met in the territory of the agglomeration of Prague for the annual average concentration of NO2 and for the maximum 8-hour sliding average tropospheric ozone concentration (on an average over three years). The annual average concentrations of PM10 have been below the limit values at measuring stations since 2011. In 2015 and 2016, the pollution limit level was not exceeded for the average 24-hour PM10 concentration (Fig. V.1.1). The pollution limit levels were met for the other air pollutants.
V.1.4 Pollution roses for the Prague agglomeration (locality Prague 2-Riegrovy sady)
The Prague 2-Riegerovy sady station is located in the centre of Prague, about 50 m from a not-verybusy roadway. Southerly to westerly air currents, which are typical for the Prague agglomeration predominate (Fig. 1, Annex III). On the other hand, north-easterly winds are less common. The station itself is affected by residential, multi-floor buildings. Riegerovy sady (park areas) are located to the south of the station.
According to the pollution rose (Fig. 2, Annex III), the highest levels of pollution by PM10 occur with north-easterly to south-easterly winds, with a substantial influence of the Vinohrady city ward.
The year-round pollution rose for NO2 (Fig. 3, Annex III) emphasises a sources close to the measuring site, probably linear, active year-round, with the focal point of occurrence from the easterly direction in the winter (Fig. 4, Annex III).
The pollution roses for secondarily formed tropospheric ozone have a specific character; the effect of temperature and intensity of solar radiation have a predominant effect on their formation. The pollution roses place the area with the highest O3 concentrations in the eastern sector (Fig. 5, Annex III). The effect of the temperature on the formation of tropospheric ozone is clearly visible on the temperature-classified pollution roses, and is also confirmed by the pollution roses divided according to temperature (Fig. 6, Annex III).

Fig. V.1.1 Number of exceedances of 24-hour PM10 limit value
and the 36th highest 24-hour concentration PM10 at individual
types of stations, agglomeration of Prague, 2007–2016
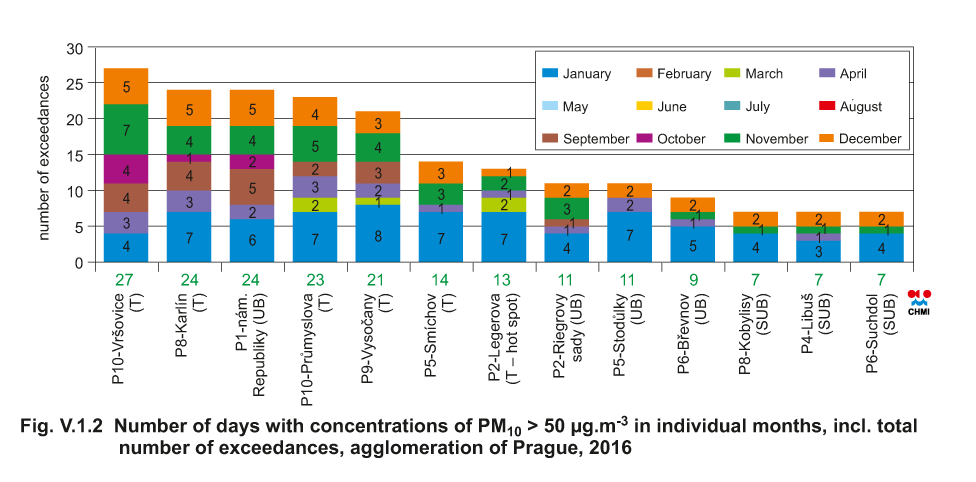
Fig. V.1.2 Number of days with concentrations of PM10 > 50
µg.m-3 in individual months, incl. total number of exceedances,
agglomeration of Prague, 2016

Fig. V.1.3 Average annual PM2.5 concentrations, agglomeration of
Prague, 2004–2016
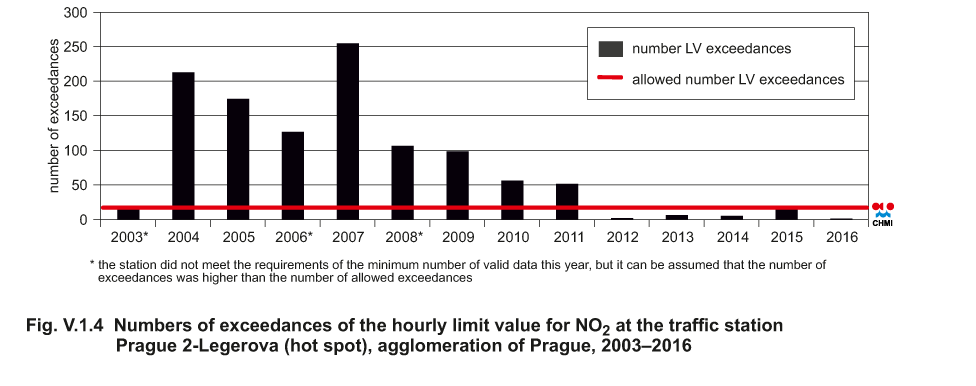
Fig. V.1.4 Numbers of exceedances of the hourly limit value for
NO2 at the traffic station Prague 2-Legerova (hot spot),
agglomeration of Prague, 2003–2016
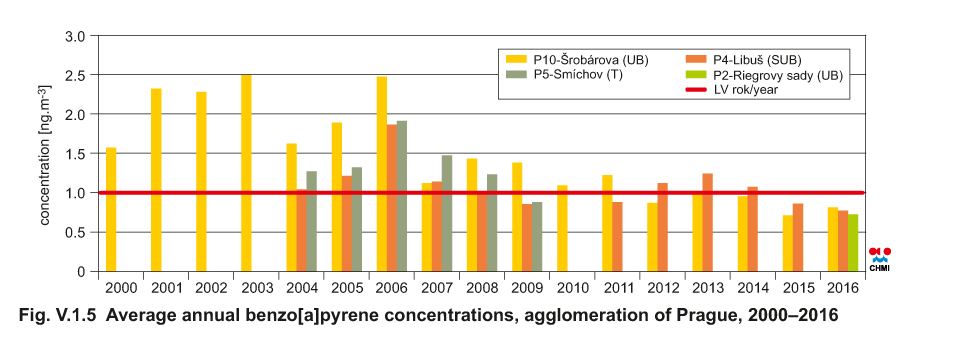
Fig. V.1.5 Average annual benzo[a]pyrene concentrations,
agglomeration of Prague, 2000–2016
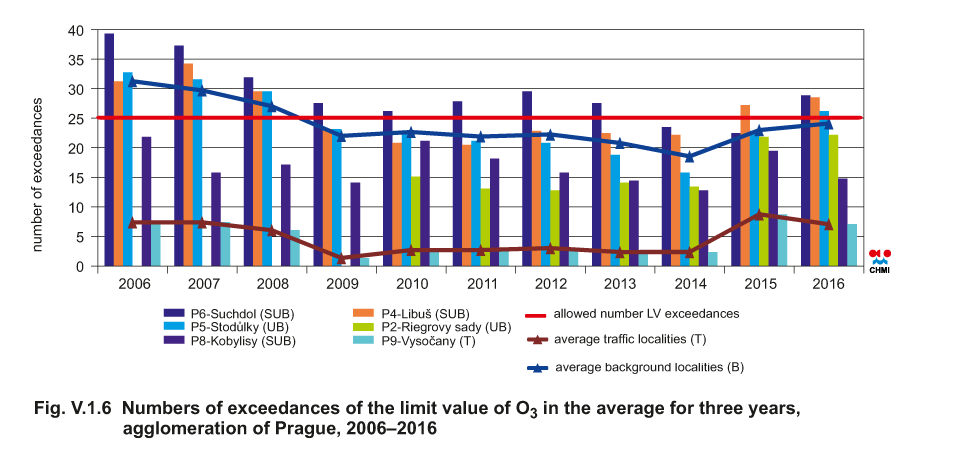
Fig. V.1.6 Numbers of exceedances of the limit value of O3 in the average for three years, agglomeration of Prague, 2006–2016
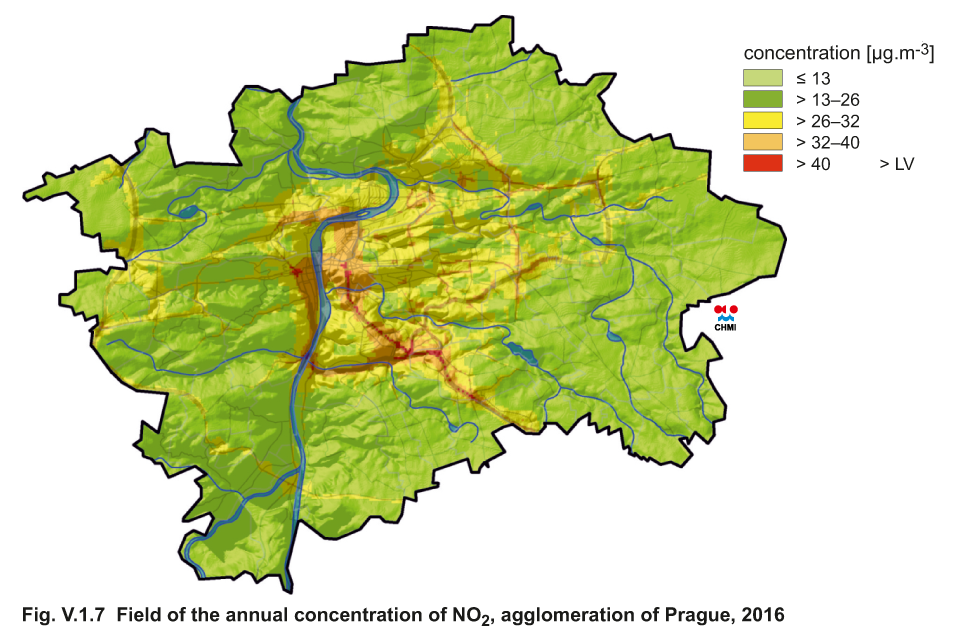
Fig. V.1.7 Field of the annual concentration of NO2,
agglomeration of Prague, 2016

Fig. V.1.8 Field of the 36th highest 24-hour concentration of
PM10, agglomeration of Prague, 2016
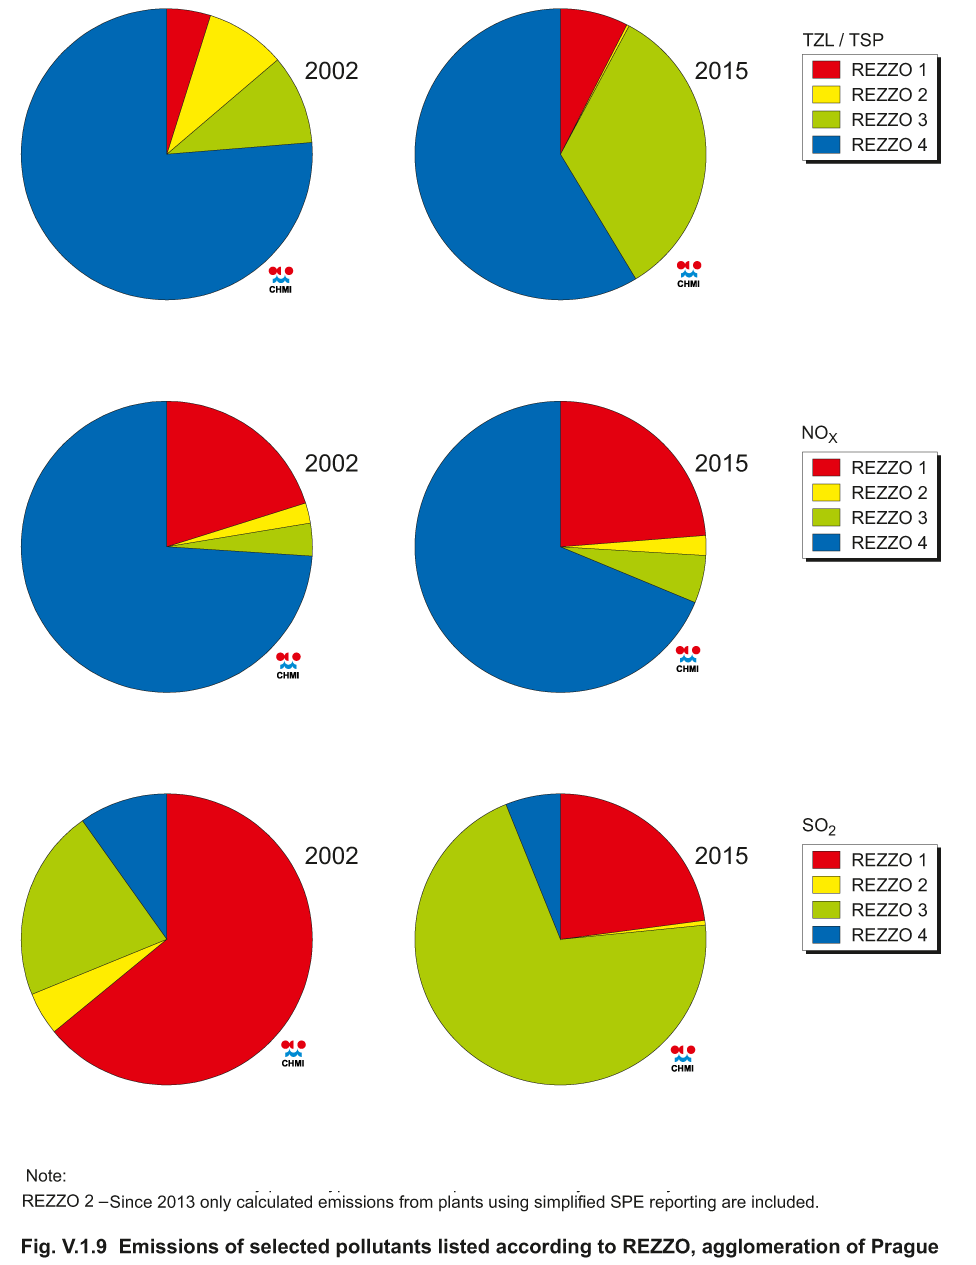
Fig. V.1.9 Emissions of selected pollutants listed according to
REZZO, agglomeration of Prague