IV.9 POLLUTANTS WITHOUT THE LIMIT VALUE
IV.9.1 Volatile organic compounds
Volatile organic compounds (VOCs) play an important role in atmospheric chemistry and thus in the oxidation strength of the atmosphere, affecting the condition and quality of the air. Together with nitrogen oxides, VOCs play an important role in the process of formation of tropospheric ozone and other photo-oxidation pollutants. Conversion and decomposition of VOCs is usually initiated by reaction with a hydroxyl radical (Víden 2005). According to the Air Protection Act, a volatile organic compound is any organic compound or mixture of organic compounds, with the exception of methane, that has a vapour pressure of 0.01 kPa at 20 °C or has corresponding volatility under the specific conditions of its use. Because of the range of variously long reactivities of various VOC and their amounts, pollution limit levels were not established for these substances.
Monitoring of VOCs was included in the EMEP programme on the basis of a decision by the EMEP Workshop on Measurements of Hydrocarbons /VOCs in Lindau in 1989 (EMEP 1990). Actual measurements at the Košetice Observatory (OBK) were then commenced during 1992 and three years later were supplemented by identical measurements at the Prague-Libuš station. In the framework of EMEP, initially measurements were made at five stations; however, over 20 years the number of stations and range of measured hydrocarbons has changed several times. A homogeneous set of measurements has been maintained to the present time at OBK. Since 2011, OBK has been involved in the ACTRIS project, carried out in the context of the EU 7th Framework Programme INFRA-2010-1-1.1.16: Research Infrastructures for Atmospheric Research. The successor project ACTRIS-2 pod H2020- INFRAIA-20142015 followed on from this project and is being implemented in the May 2015–April 2019 period. The subject of VOCs is part of the work of the Trace gases networking working group: Volatile organic carbon and nitrogen oxides, in an attempt to improve and harmonise VOC measurements in Europe. In the framework of the project, standard operational procedures are being developed and the best measuring techniques for ensuring quality are being tested. The CHMI laboratory regularly participates in a round robin test, where the results of our own analyses of VOCs confirmed that the laboratory complies with the recommended parameters of the GC system and meet the required uncertainty values for all the substances in both standards and real samples. In November of 2016, an audit of VOC monitoring was held at CHMI (CLI and OBK) in the framework of ACTRIS-2. The authors concluded that the equipment of the laboratories, provision for data quality and personnel are at a very good level and correspond to ACTRIS requirements. To ensure improvement of comparability, it was recommended that a system for longer sampling be acquired. The average annual VOC concentrations at the PBK and Prague-Libuš stations over 24 years of monitoring exhibit a statistically significant decreasing trend, reflecting the decrease in VOC emissions both in the Czech Republic and also in the entire European area (Tab. IV.9.1.1). The trend in ethane concentrations is much stronger at the suburban station of Prague-Libuš than at the OBK background station. The only exception is isoprene, which is of natural origin (emitted by broad-leaved trees), which exhibited an increasing trend at both stations. In general, it can be stated that the concentrations of the main VOCs at the suburban levels in the 1990's were approx. 150–200% higher than at the background station. The differences between the two stations have decreased substantially in the past decade.
The results obtained in 2016 do not in any way deviate from the long-term trends (Tab. IV.9.1.1). The annual variation in most VOC concentrations reflects the emission levels and thus maximum values in the winter and minima in the summer; the situation is the opposite only for isoprene (Fig. IV.9.1.1).
It follows from the current report on VOC measurements in the context of EMEP (Solberg et al. 2016) that the VOC concentrations continuously decrease on a regional scale and thus reflect the decreasing trend in emissions. The concentration level at OBK is comparable with those at the German, Swiss and French stations The Czech station has long been characterised by lower annual average ethane concentrations. For most VOCs, the concentrations measured in the winter are usually similar to those at German stations, while the values at OBK are slightly lower in the summer.
The Geneva Protocol concerning the Control of Emissions of Volatile Organic Compounds or their Transboundary Transmission was adopted in November of 1991 and came into effect in September of 1997 (UN-ECE 1991). The Protocol contained three options for reducing VOCs:
- 30% reduction in VOC emissions by 1999, where the base values were those for 1984 and 1990;
- the same reduction as under (1) and the provision that the overall national emissions in 1999 do not exceed the 1988 level;
- where 1988 emissions did not exceed the set limits, countries could adopt the 1999 level as the emission ceiling.
In 1999, the Göteborg Protocol to Abate Acidification, Eutrophication and Ground-level Ozone was adopted and it came into effect on 17 May 2005 (UN-ECE 1999). The Protocol contains the emission ceiling for 2010 for four pollutants including VOCs. According to the Protocol, European VOC emissions were to be reduced by at least 40% compared to 1990. The Czech Republic, similar to most Central European countries (except Poland), has fulfilled this limit; VOC emissions in the Czech Republic decreased by 51% in the 1990–2010 period (EEA 2013b).
Emissions of volatile organic compounds
a wide range of applications in households and industry as cleaning agents, solvents and degreasing agents. They can be components of coatings, varnishes, adhesives and pharmaceutical products. VOCs are released during the storage and use of petroleum products. They are also formed in incomplete combustion of fossil fuels
The most important sources of VOCs in the Czech Republic are derived from the sector of the use and application of organic solvents (NFR 2D3), which contributed 50.6% to pollution of the air by these substances in 2015 (Fig. IV.9.1.2). This sector encompasses activities 2D3a – Domestic solvent use including fungicides (7.4%), 2D3b – Laying asphalt on roads and sidewalks (0.3%), 2D3c – Production of asphalt roofing materials and their use (0.04%), 2D3d – Coating applications (21.4%), 2D3e – Degreasing (5.5%), 2D3f – Chemical (Dry) cleaning (0.04%), 2D3g – Chemical products (7.8%), 2D3h – Printing (2.8%) and 2D3i – Other solvent use (5.4%). Some of these emissions are released into the air in a controlled manner, but most of them escape into the air in the form of fugitive emissions, which are difficult to control. The greatest amounts of VOC emissions from combustion processes are formed in sector 1A4bi – Residential: Stationary (18.2%), 1A3bi – Road transport: Passenger cars (3.3%), 1A3biii – Road transport: Heavy duty vehicles and buses 3.5 tons (4.6%) and 1A1a – Public electricity and heat production (3.3%). In connection with transport, VOC emissions are also released into the air in the form of vapours from automobile fuel systems, which are included in sector 1A3bv – Road transport: Gasoline evaporation (5.9%). Substantial amounts of VOC emissions are released into the air in coal mining – sector 1B1a – Fugitive emissions from solid fuels: Coal mining and handling (5.5%).
Total VOC emissions in the 2007–2015 period exhibited a decreasing trend (Fig. IV.9.1.3), caused by the use of products with lower volatile organic compound contents, e.g. water-based coatings and plastic powders. Legislative regulations apply to retail packaging of coatings, limiting the maximum solvent contents in products placed on the market. The constant renewal of the vehicle fleet is leading to a continuous reduction in VOC emissions from transport.
Tab. IV.9.1.1 Stations with average annual concentrations of
VOC in the ambient air
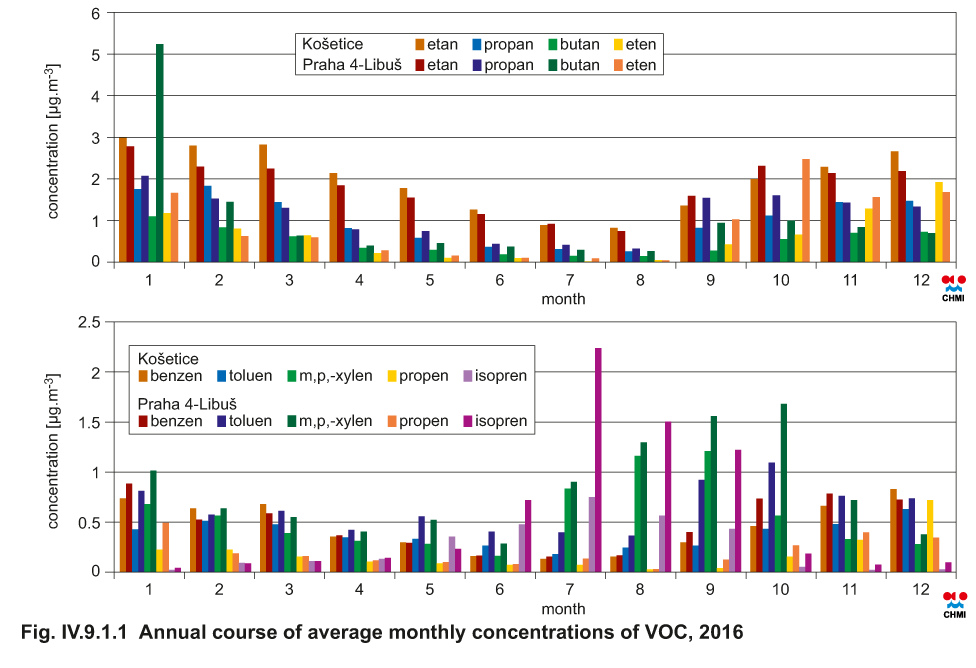
Fig. IV.9.1.1 Annual course of average monthly concentrations
of VOC, 2016

Fig. IV.9.1.2 Total emissions of VOC sorted out by NFR sectors,
2015
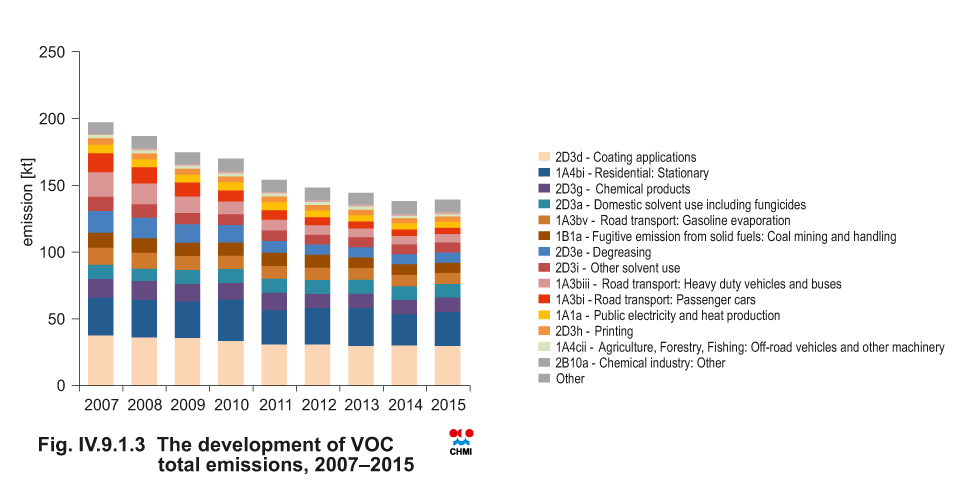
Fig. IV.9.1.3 The development of VOC total emissions, 2007–2015