IV.7 SULPHUR DIOXIDE
IV.7.1 Air pollution caused by sulphur dioxide in the year
2016
Air pollution by sulphur dioxide in 2016 in relation to the pollution limit value for protection of human health
In 2016, neither the hourly nor the 24-hour pollution limit value for sulphur dioxide (SO2) was exceeded at any measuring station (Tab. XIII.18 and XIII.19). Only one hourly and 24-hour SO2 concentration exceeding the limit value of 350 μg.m-3 or 125 μg.m-3, resp., was exceeded at the Lom station in the Ústí region. However, the permitted number of 24 or 3 values, respectively, greater than the limit value was not exceeded. Substantial impact from important energy-production and industrial sources located in the mining area under the Krušné Mts. can be expected.
The highest SO2 concentrations were measured at the Lom (371 μg.m-3), Nová Víska u Domašína (340 μg.m-3) and Sokolov (293 μg.m-3) stations. The limit value was exceeded in a single case at the Lom station on 21 May 2016. The hourly concentration of SO2 gradually attained values of 217, 371 and 148 μg.m-3 at 8, 9 and 10 o'clock CEST. This episode was probably the result of the penetration of SO2 down to the ground after disturbance of the morning inversion and the start of turbulence. Only a light wind was blowing from the south-east, but the effect of industrial sources at Záluží cannot be excluded.
The highest 24-hour concentrations of SO2 were recorded at the Lom (143 μg.m-3), Ostrava-Radvanice ZÚ (101 μg.m-3) and Teplice (90 μg.m-3) stations. The 24-hour pollution limit value was exceeded at the Lom station on 31 December 2016. On that day, the hourly SO2 concentration reached its highest value of 180–218 μg.m-3 at 16–21 hours, while elevated concentrations were measured in the morning of 1 January 2017. Only a light wind was blowing from the eastern sector, from which the effect of industrial sources can be anticipated.
The 25th highest SO2 concentration attained the highest values at the following stations: Dolní Rychnov (138 μg.m-3), Ostrava-Radvanice ZÚ (133 μg.m-3) and Lom (120 μg.m-3). The fourth highest 24-hour concentration of SO2 attained the highest values at the Ostrava-Radvanice ZÚ (82 μg.m-3), Bohumín (52 μg.m-3) and Nová Víska u Domašína (38 μg.m-3) stations.
Over 99.9% of the area of the Czech Republic, the 24-hour concentrations of SO2 were under the lower assessment threshold (LAT). LAT was attained over only less than 0.1% of the territory. These values were recorded primarily in the Ústí region in the area under the Krušné Mts. mining area, especially in the Most district (Fig. IV.7.1).
In relation to the decrease in the concentrations in 2015 and 2016 compared to previous years, the SO2 concentrations did not exceed the 24-hour concentrations recommended by WHO for protection of human health over most of the territory of the Czech Republic (63.5%); i.e. in this territory, a 24-hour average concentration of 20 μg.m-3 was not exceeded in 2016.
Air pollution by sulphur dioxide in 2016
in relation to the pollution limit value for
protection of ecosystems and vegetation
In 2016, neither the annual nor winter average concentrations exceeded the pollution limit value at rural locations (Tab. XIII.21 and XIII.22). The highest winter average concentrations were recorded at the Věřňovice (12.5 μg.m-3), Lom (11.8 μg.m-3) and Krupka (11.3 μg.m-3) locations. The annual average concentrations attained maximum values at the Krupka (8.7 μg.m-3), Lom (8.6 μg.m-3) and Věřňovice (6.8 μg.m-3) locations.
The upper assessment threshold (UAT) for the annual average SO2 concentration was exceeded in 2016 over only small areas in the Ústí nad Labem, Karlovy Vary and Moravian-Silesian regions (Fig. IV.7.5). The average concentration in the winter of 2015/2016 exceeded UAT in the same regions and also in the Central Bohemian, Hradec Králové, Pardubice and Zlín regions (Fig. IV.7.6).
All the background stations measuring SO2, taking into account their classification, were used to construct the two maps (Fig. IV.7.5 and IV.7.6). On the maps, point markers designate only rural stations because only at these locations are the average winter and annual average SO2 concentrations measured in relation to the pollution limit values for protection of ecosystems and vegetation.
IV.7.2 Trends in sulphur dioxide
concentrations
A substantial reduction in SO2 concentrations occurred after 1998 in connection with coming into effect of Act No. 309/1991 Coll. and compliance with some of the prescribed emission limits. Since then, the annual average concentrations of this substance at rural locations have not exceeded the set pollution limit value of 20 μg.m-3. A further reduction in SO2 concentrations occurred over all of the Czech Republic in 2008. On the other hand, there was a slight increase in pollution by SO2 in 2009 and 2010; however a further decreasing trend is apparent between 2011 and 2016. A decrease in most characteristics compared to the previous year was apparent in 2016 (Fig. IV.7.3).
There was an overall decrease in SO2 concentrations in 2000–2016 (by approx. 40–50% in dependence on the pollution characteristics – Fig. IV.7.4).
The trend in SO2 concentrations was caused by a reduction in emissions, sulphur removal in coalfired power plants and a change in the fuel employed (see the emission trends in Chap. II). The different meteorological and dispersion conditions in the individual years also had an impact on the inter-annual variations in the concentrations of this substance in the individual years.
Trends in the sulphur dioxide concentrations
in relation to the pollution limit values for
protection of health
Since 2005, a decreasing trend has been apparent in the 4th highest 24-hour and 25th highest hourly SO2 concentrations at selected locations (Fig. IV.7.2). Compared to 2015, there was a decrease in these values in 2016 at most locations, e.g. at the Krupka, Měděnec, Sněžník and Nová Víska u Domašína stations. On the other hand, the SO2 concentrations increased at the Sokolov, Milá and Věřňovice stations.
Trends in sulphur dioxide concentrations
in relation to the pollution limit values for
protection of ecosystems and vegetation
A slow decreasing trend is apparent in the annual and winter average SO2 concentrations (Fig. IV.7.7 and IV.7.8). Compared to the previous year, the annual SO2 concentrations decreased in 2016 at almost all the rural locations, e.g. Krupka, Lom and Věřňovice. On the other hand, a slight increase in winter SO2 concentrations is apparent at most stations, e.g. Věřňovice, Lom and Tušimice. An increase was recorded at the turn of 2016/2017, especially in January and February 2017, in connection with the less favourable meteorological and dispersion conditions.
IV.7.3 Sulphur dioxide emissions
Sulphur dioxide emissions are derived mainly from the combustion of solid fossil fuels containing sulphur. In 2015, on a national scale, 61.2% of SO2 emissions were derived from sector 1A1a – Public electricity and heat production, while 13.7% were derived from sector 1A4bi – Residential: Stationary (Fig. IV.7.9). SO2 emissions decreased between 2007 and 2008 in sector 1A1a as a result of the obligation to comply with emission ceilings for LCP sources (Fig. IV.7.10). Another substantial reduction in SO2 emissions took place after 2012 as a result of preparation of sources for even stricter emissions limits. In relation to the predominant effect of the sector of public energy and heat production, SO2 emissions are concentrated in the Ústí nad Labem, Moravian-Silesian and Central Bohemian regions, in which the largest production units are located (Fig. IV.7.11).
Tab. XIII.18 Stations with the highest values of the 25th and maximum hourly concentrations of SO2
Tab. XIII.19 Stations with the highest numbers of exceedances of the 24-hour limit value of SO2
Tab. XIII.20 Stations with the highest values of annual average concentrations of SO2

Fig. IV.7.1 Field of the 4th highest 24-hour concentration
of SO2, 2016
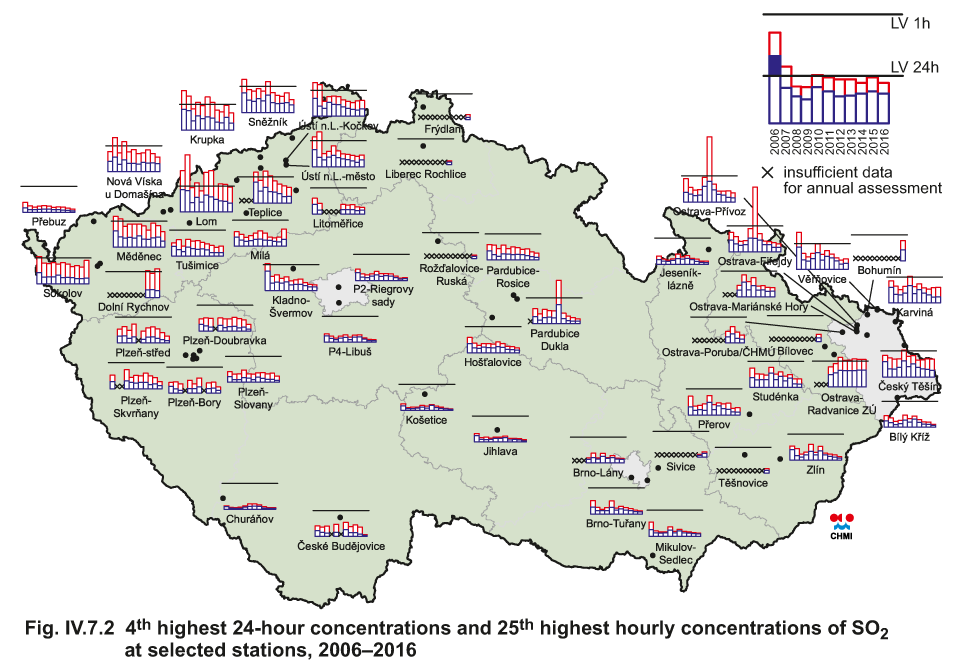
Fig. IV.7.2 4th highest 24-hour concentrations and 25th highest
hourly concentrations of SO2 at selected stations, 2006-2016
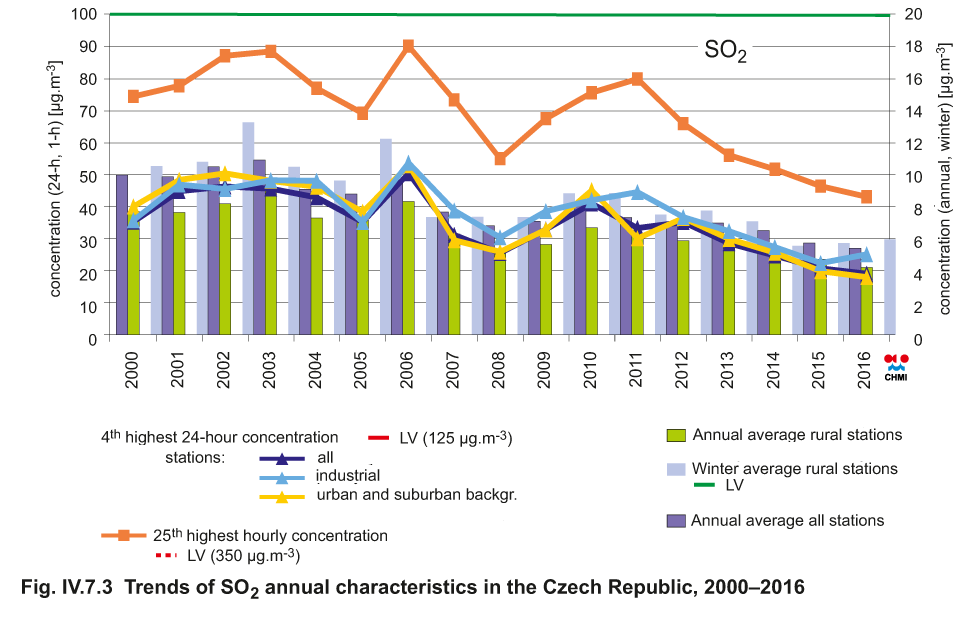
Fig. IV.7.3 Trends of SO2 annual characteristics in the Czech
Republic, 2000–2016

Fig. IV.7.4 Trends of selected characteristics of SO2 (index,
year 2000 = 100), 2000–2016
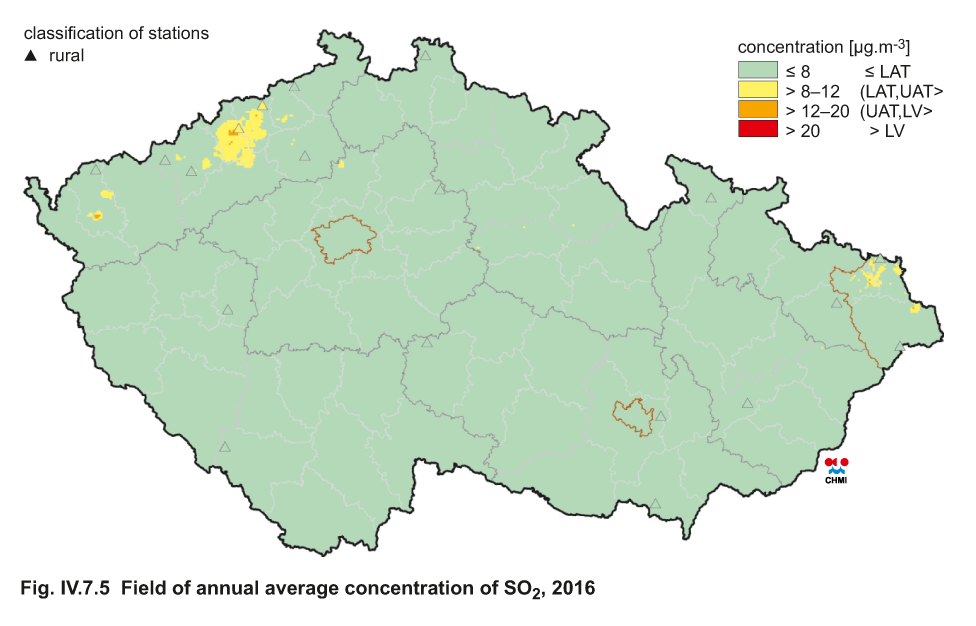
Fig. IV.7.5 Field of annual average concentration of SO2, 2016
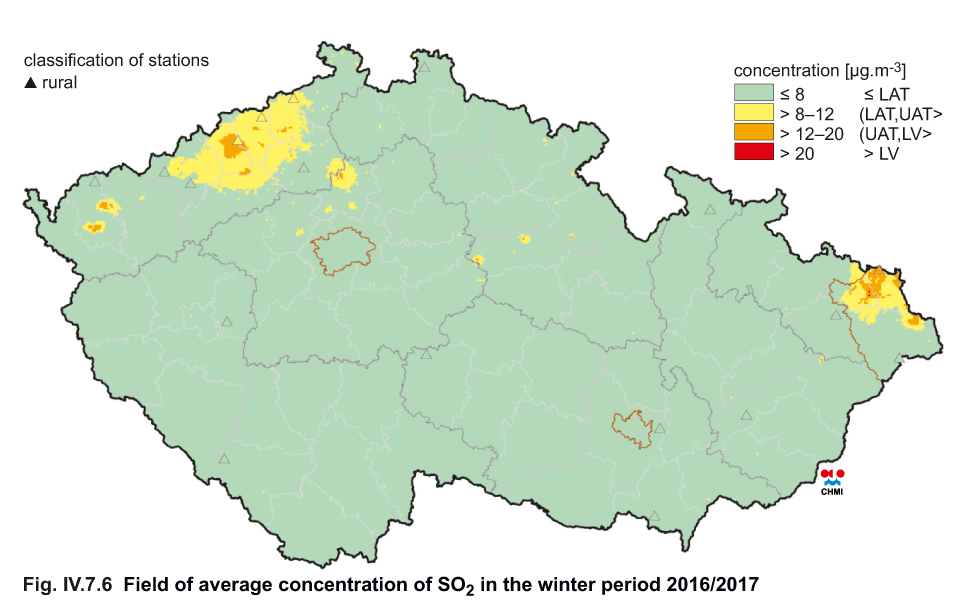
Fig. IV.7.6 Field of average concentration of SO2 in the winter
period 2016/2017

Fig. IV.7.7 Annual average concentrations of SO2 at selected
rural stations, 2006-2016

Fig. IV.7.8 Winter average concentrations of SO2 at selected
rural stations, 2006/2007–2016/2017
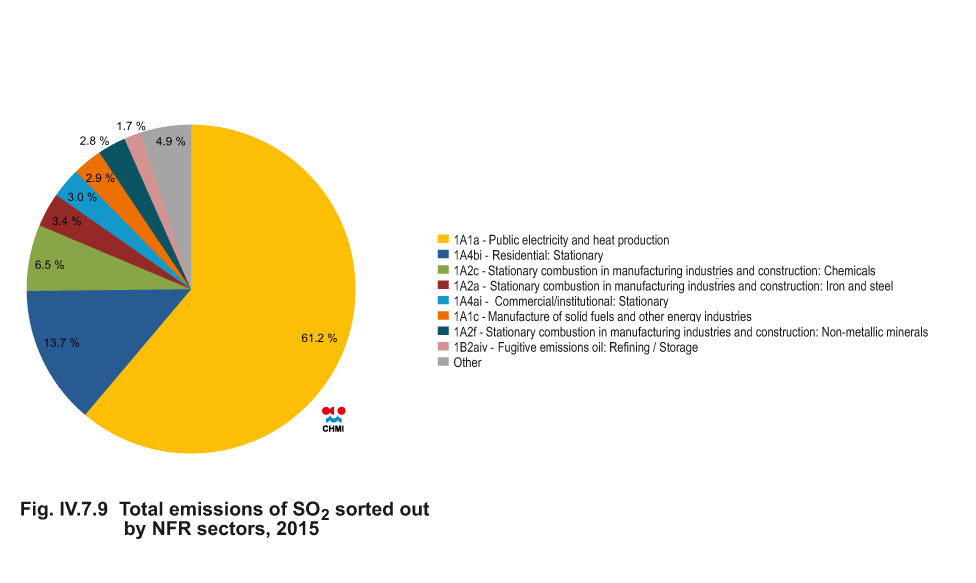
Fig. IV.7.9 Total emissions of SO2 sorted out by NFR sectors,
2015
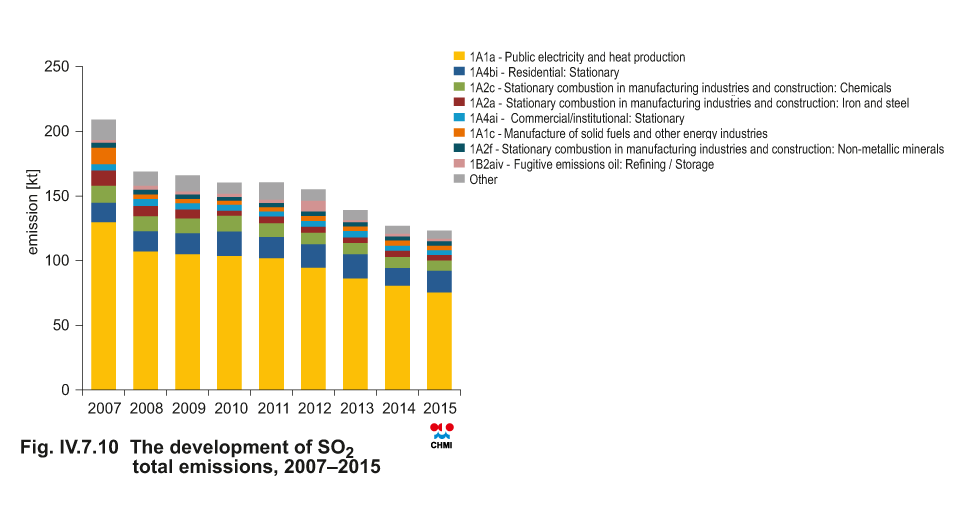
Fig. IV.7.10 The development of SO2 total emissions, 2007–2015
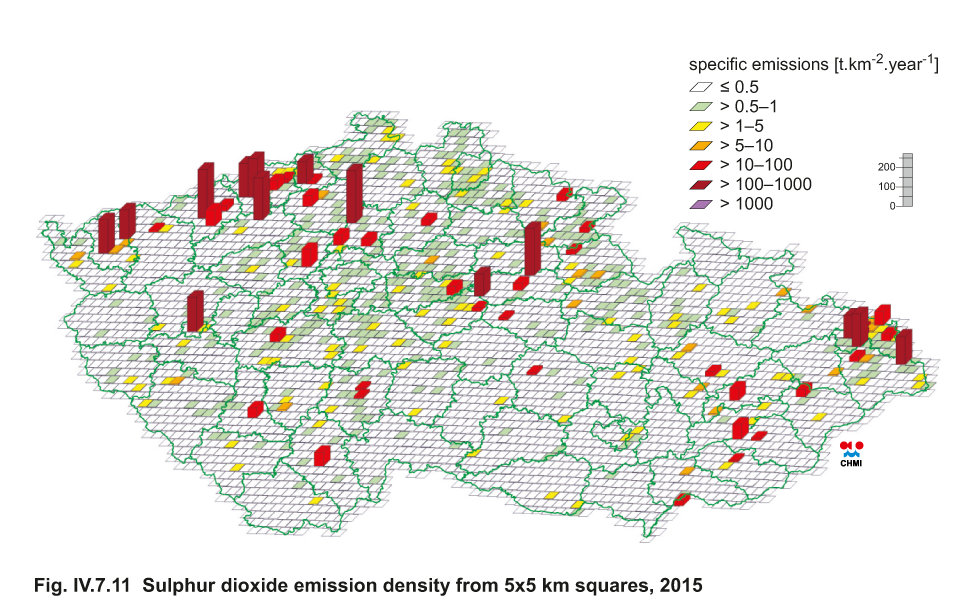
Fig. IV.7.11 Sulphur dioxide emission density from 5x5 km
squares, 2015