IV.6 HEAVY METALS
IV.6.1 Air pollution caused by heavy metals in 2016
Lead
The annual pollution limit level for lead (0.5 μg.m-3) was not exceeded in 2016 at any of the 58 locations for which a sufficient amount of data was available for calculation of the valid annual average value. The largest average annual value was measured at the Ostrava-Radvanice Health Centre location (Tab. XIII.14). With the exception of 2011, when the greatest concentration was measured at the Příbram I-hospital location, the highest lead concentrations are repeatedly measured in the O/K/FM agglomeration.
The lead concentrations have long been very low over the whole territory of the Czech Republic and do not reach even half of the pollution limit level, i.e. the value of the lower limit for assessment 0.25 μg.m-3 (Fig. IV.6.5). Compared to 2015, in 2016 a decrease occurred in the lead concentration at 54% of locations (26 of a total of 48 stations where the lead concentrations were measured in 2015 and 2016).
Cadmium
The annual pollution limit level for cadmium (5 ng.m-3) was not exceeded in 2016 at any location of the total of 58 locations with valid annual average value (Tab. XIII.15). At the Tanvald-kindergarten station, which has long had the highest values, the average annual concentration decreased compared to 2015 from 6.9 ng.m-3 to 3.7 ng.m-3, i.e. under the annual pollution limit level (Vlček et al. 2017). The highest average annual concentrations in 2016 were measured primarily at locations in the Jablonec nad Nisou and Ostrava-city locations (Fig IV.6.1). For example, concentrations an order of magnitude higher than at other rural locations have long been measured at the Souš station (Jablonec nad Nisou district), which is classified as a rural background station (Fig. IV.6.9).
The cadmium concentrations have long been below the limit values over most of the territory of the Czech Republic (Fig. IV.6.3, Fig. IV.6.6). Compared to 2015, the average annual concentration decreased at an average of 71% of locations (34 of a total of 48 stations where the cadmium concentrations were measured in 2015 and 2016).
Arsenic
The annual pollution limit level for arsenic (6 ng.m-3) was not exceeded in 2016 at any of the total of 58 locations with valid annual average value (Tab. XIII.16, Fig. IV.6.2). The pollution limit level for arsenic has been exceeded annually at minimally one station since the beginning of measurements in 1986, with the exception of 2012, when the limit was met at all the measuring stations (Fig. IV.6.7). Compared to 2015, in 2016 there was a decrease in the average annual concentration at 63% of locations (30 of a total of 48 stations where the arsenic concentration was measured in both 2015 and 2016) and, on the other hand, an increase at 19% of locations (9 of a total of 48 stations where the arsenic concentration was measured in 2015 and 2016). The highest arsenic concentrations have long been measured in the Kladno district and in the Capital City of Prague (Fig. IV.6.4).
Nickel
The annual pollution limit level for nickel (20 ng m-3) was not exceeded in 2016 at any of the 58 loca-tions for which a sufficient amount of data was available for calculation of the valid annual average value. The highest concentration, 3.4 ng.m-3, was measured at the Ostrava-Přívoz location (Tab. XIII.17). Compared to 2015, in 2016 there was a decrease in the average annual concentration at 42% of locations (20 of the total of 48 stations measuring the Ni concentration in 2015 and 2016) and, on the other hand, an increase at 27% of the locations (13 of the total of 48 stations measuring the Ni concentration in 2015 and 2016). The nickel concentrations have long been very low over the whole territory of the Czech Republic and do not reach even half of the pollution limit level, i.e. the value of the lower limit for assessment 10 μg.m-3 (Fig. IV.6.8).
IV.6.2 Trends in heavy metal concentrations
The average annual concentrations of all the monitored metals have decreased slightly in recent years, with the exception of fluctuations in 2010 and 2013 (Fig. IV.6.9). The reason for this has not yet been sufficiently clarified; in 2010 this could have been a consequence of worsened dispersion and meteorological conditions.
The Tanvald area (Liberec region) is characterised by a large concentration of the glass industry (ASKPCR 2014), which in the past was an important source of emissions of cadmium from the dyes and fluxing agents used (Beranová 2013).
Since 2004, measures have been introduced in the Integrated regional programme to improve the air quality in the Liberec region, concerned with support for reducing cadmium emissions from glassindustry operations (Rada Libereckého kraje 2004). The introduction of modern technology led to a substantial reduction in emissions of cadmium and other heavy metals from modernised operations in the following few years (ATEM 2006). Greening of the operations leading to reduction of the heavy metal concentrations in the ambient air is still continuing.
In areas not affected by industrial production, the average annual concentrations of all the heavy metals are usually higher than in cities (Fig. IV.6.9), which is a result primarily of the accumulation of industrial production in cities with heavier traffic conditions. Urban locations were also characterised by a substantial reduction in heavy metal concentrations during the evaluated period compared to rural locations. After the slight reduction in heavy metal concentrations in rural locations in 2006–2007, the values tended to stagnate in the following years.
IV.6.3 Emissions of heavy metals
The group of heavy metals includes metals with a specific density greater than 4.5 g.cm-3 and their compounds. Heavy metals are a natural component of solid fuels and their contents in fuels vary in dependence on the mining site. The amounts of heavy metal emissions from the combustion of solid fuels depends primarily on the kind of fuel, type of combustion equipment and combustion temperature, which affects the volatility of the heavy metals. Heavy metal emissions are also formed in some technological processes because they are contained in the starting materials (e.g. iron ore, scrap metal, glass batches, coatings, glass shards). In addition to these processes, there are also a number of sources of fugitive emissions containing heavy metals (particles from abrasion of brakes and tyres, emissions related to old environmental burdens left by mining and metallurgical activities).
Combustion processes are of predominant importance primarily for emissions of arsenic and nickel. The most important sectors on a national scale include 1A1a – Public electricity and heat production, which contributed 25.3% to arsenic emissions and 39.3% to nickel emissions in 2015 (IV.6.10 and IV.6.12). This sector makes a significant contribution to cadmium emissions (20.0%, Fig. V.6.14). In 2015, the greatest contributions from the sectors of iron and steel production (1A2a and 2C1) were primarily in the area of lead emissions (40.1%; IV.6.16). The impact of sector 1A4bi – Residential: Stationary was manifested mainly in relation to arsenic emissions (25.3%). Emissions of heavy metals from sector 1A3bvi – Road transport: Automobile tyre and brake wear are significant especially for lead, with a contribution of 35.1% to overall emissions of this pollutant. The decreasing trend in emissions of heavy metals in the 2007–2015 period was related to developments in emissions of suspended particles (Chap. IV.1.3), to which these substances are bound. Measures in the sector of production of iron and steel made a substantial contribution to the decrease in heavy metal emissions, especially the improvements in the dust-removal system for agglomeration sintering strands. Technical measures have also managed to reduce heavy metal emissions in glass production. In recent years, there has been an increase in the volume of secondary production of non-ferrous metals, especially aluminium and lead. Emissions of heavy metals from these sources are very variable in dependence on the quality of the processed scrap metal.
In relation to the predominant contribution of the sector of household energy and heat production and the sector of production of iron and steel, the territorial distribution of heavy metal emissions is determined mainly by the locations of enterprises in these sectors. Emissions of arsenic and nickel are concentrated in areas in which thermal power plants and heating plants burning coal are located (Fig. IV.6.18 and IV.6.19). These are primarily enterprises in the Ústí region, Central Bohemian region and Pardubice region. Emissions of cadmium and lead are predominantly produced in the O/K/FM agglomeration because of the concentration of enterprises manufacturing iron and steel. A substantial amount of lead emissions in the Central Bohemian region is derived from secondary lead production at Kovohutě Příbram (Fig. IV.6.20 and IV.6.21).
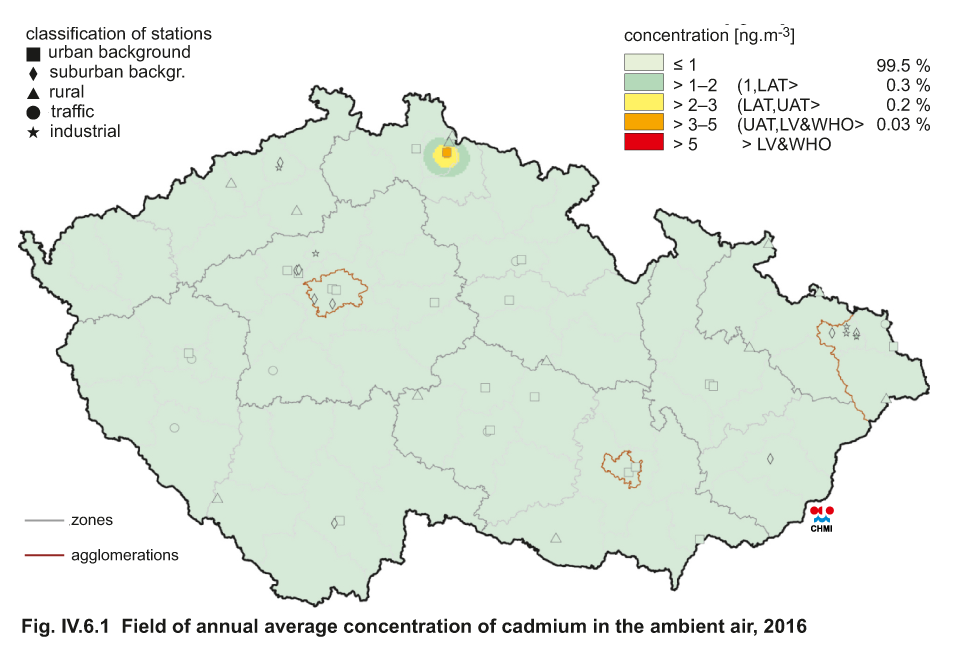
Fig. IV.6.1 Field of annual average concentration of cadmium
in the ambient air, 2016
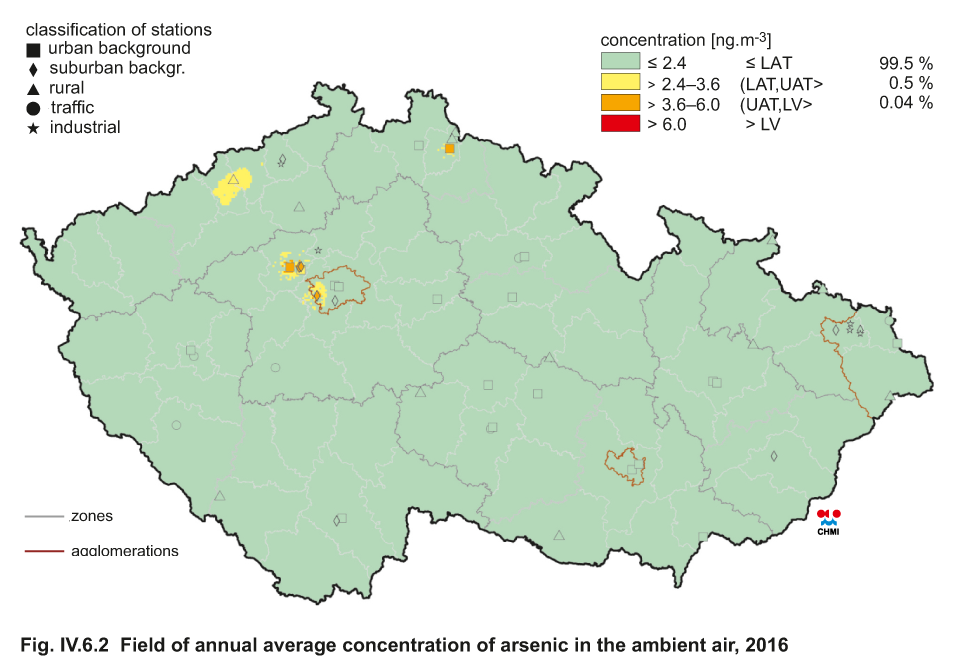
Fig. IV.6.2 Field of annual average concentration of arsenic in
the ambient air, 2016
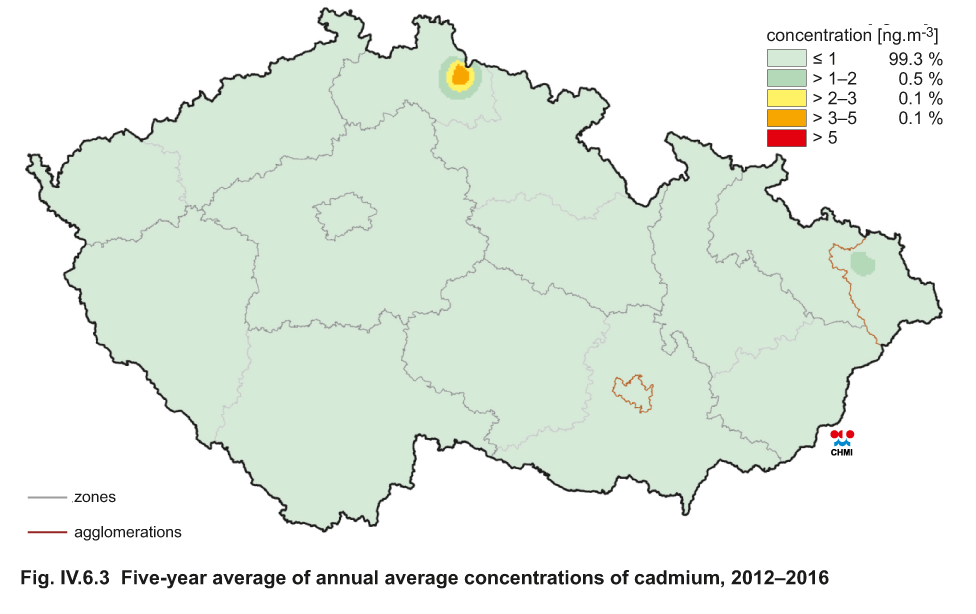
Fig. IV.6.3 Five-year average of annual average concentrations
of cadmium, 2012–2016
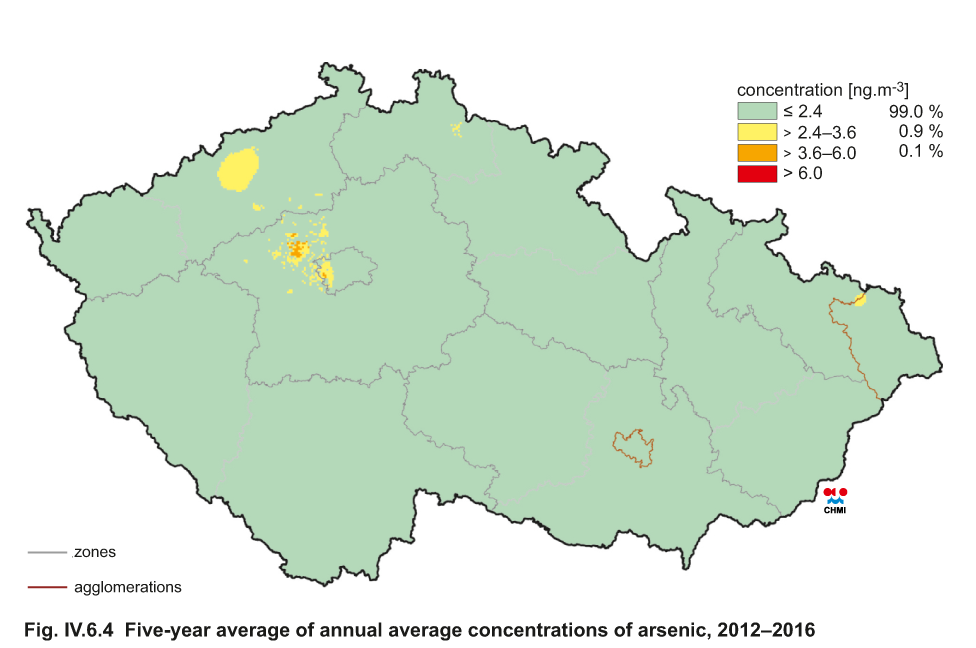
Fig. IV.6.4 Five-year average of annual average concentrations
of arsenic, 2012–2016

Fig. IV.6.5 Annual average concentrations of lead in the ambient
air at selected stations, 2006–2016
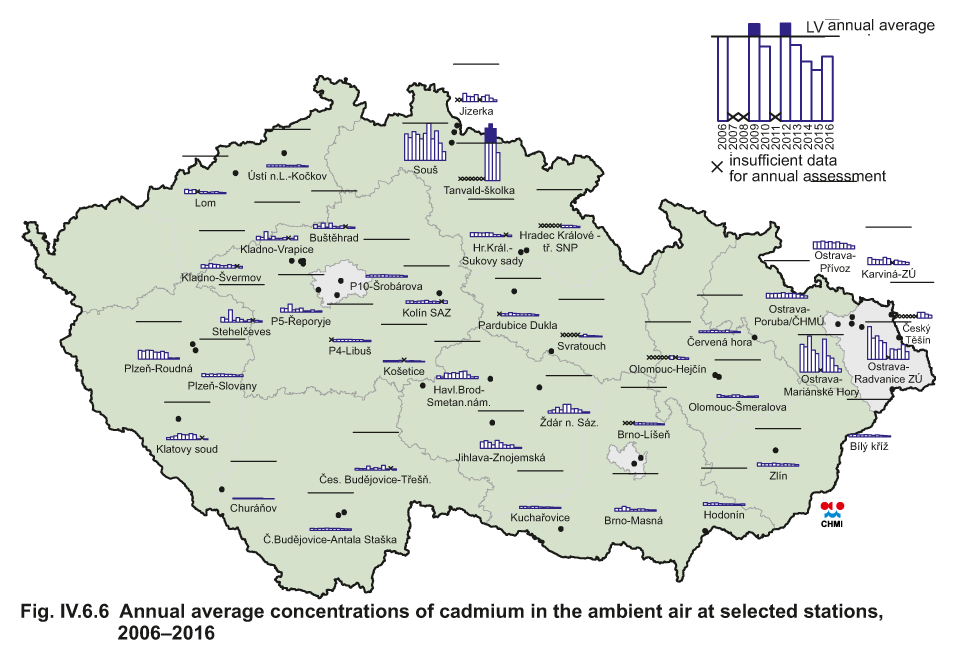
Fig. IV.6.6 Annual average concentrations of cadmium in the
ambient air at selected stations, 2006–2016

Fig. IV.6.7 Annual average concentrations of arsenic in the
ambient air at selected stations, 2006–2016
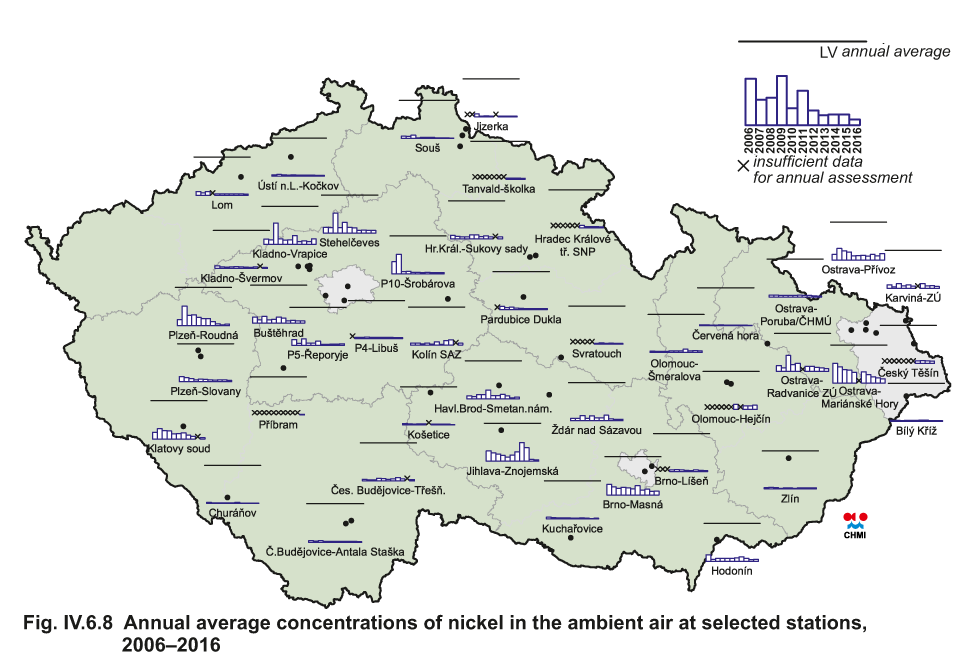
Fig. IV.6.8 Annual average concentrations of nickel in the
ambient air at selected stations, 2006–2016
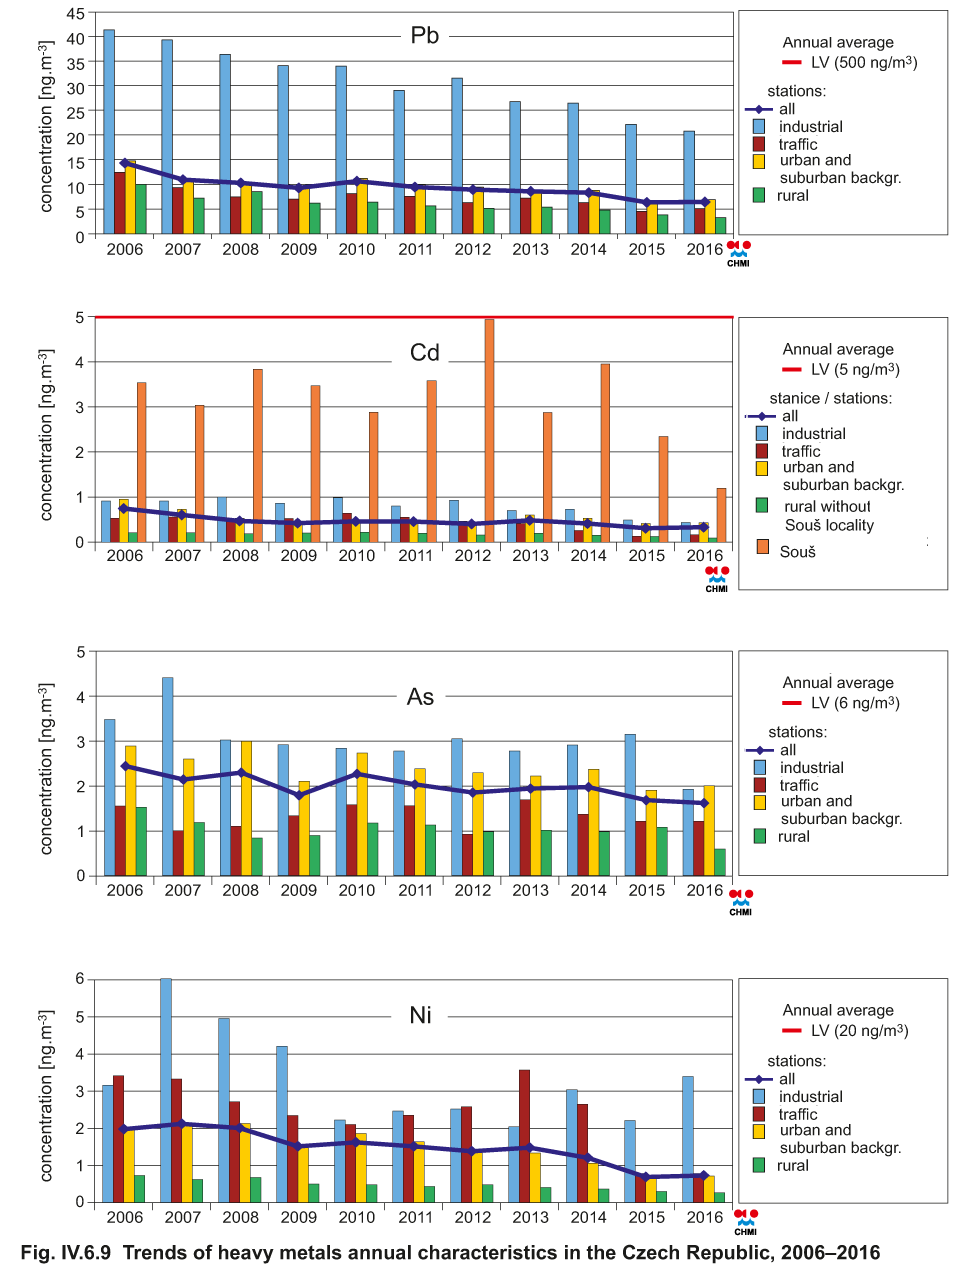
Fig. IV.6.9 Trends of heavy metals annual characteristics in the
Czech Republic, 2006–2016
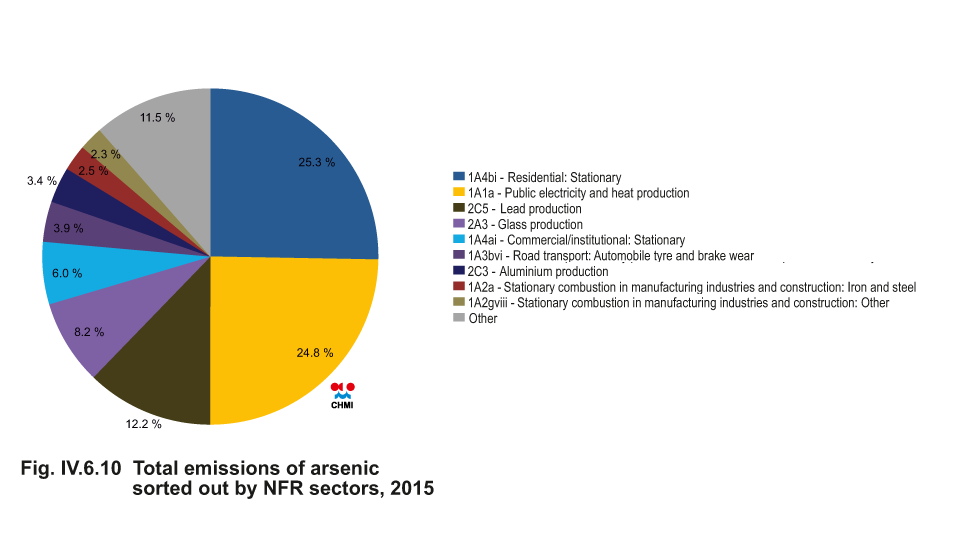
Fig. IV.6.10 Total emissions of arsenic sorted out by NFR
sectors, 2015
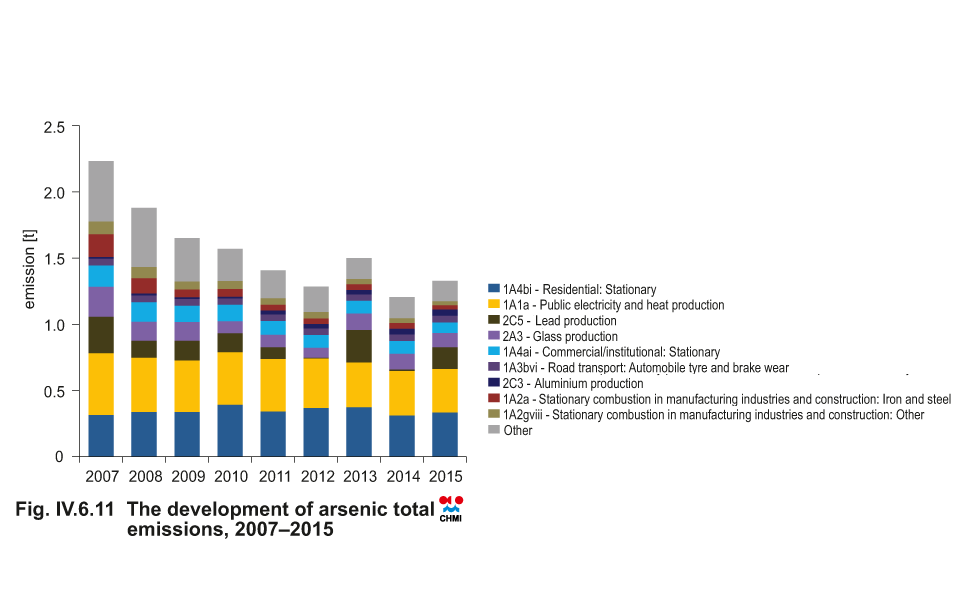
Fig. IV.6.11 The development of arsenic total emissions,
2007–2015

Fig. IV.6.12 Total emissions of nickel sorted out by NFR sectors,
2015

Fig. IV.6.13 The development of nickel total emissions,
2007–2015
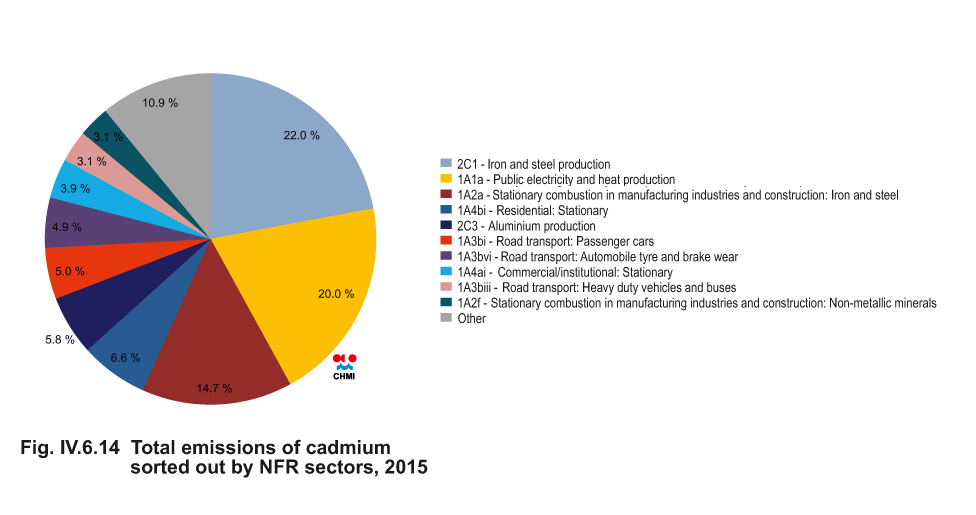
Fig. IV.6.14 Total emissions of cadmium sorted out by NFR
sectors, 2015
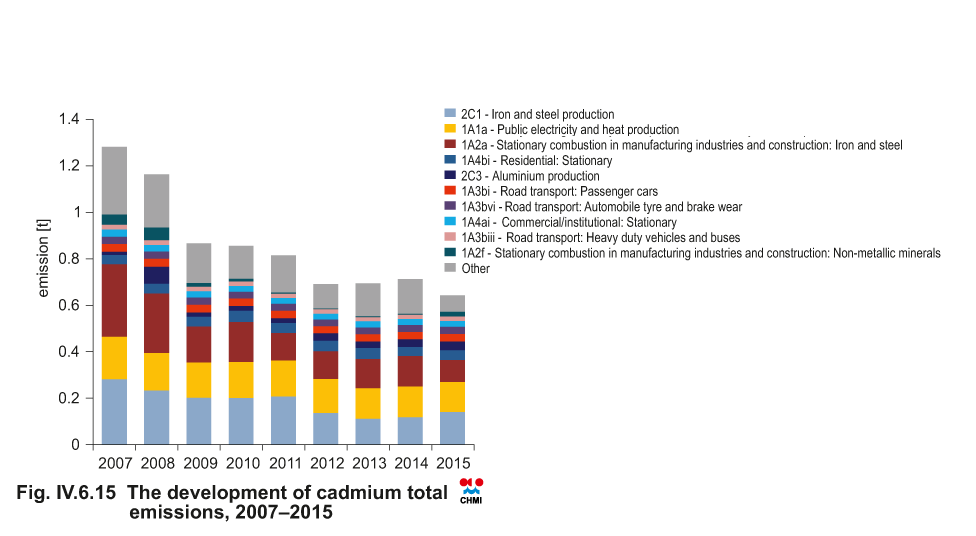
Fig. IV.6.15 The development of cadmium total emissions,
2007–2015
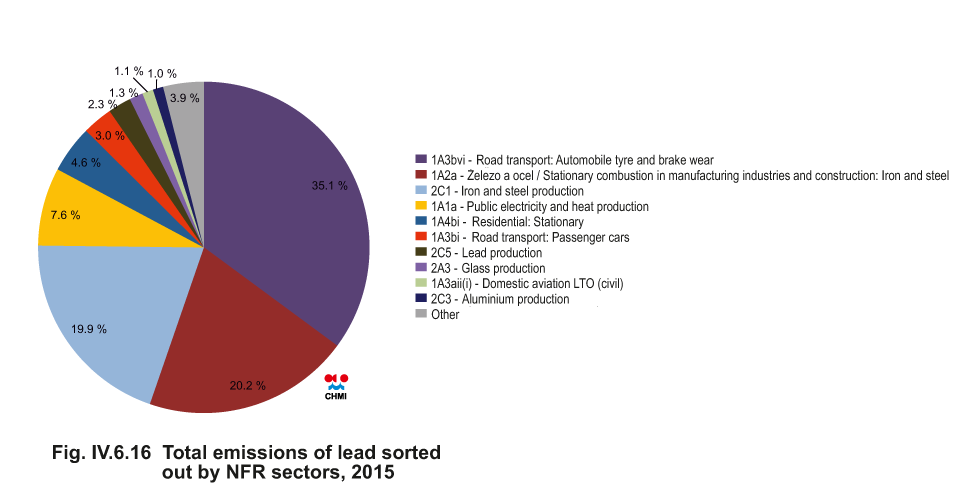
Fig. IV.6.16 Total emissions of lead sorted out by NFR sectors,
2015
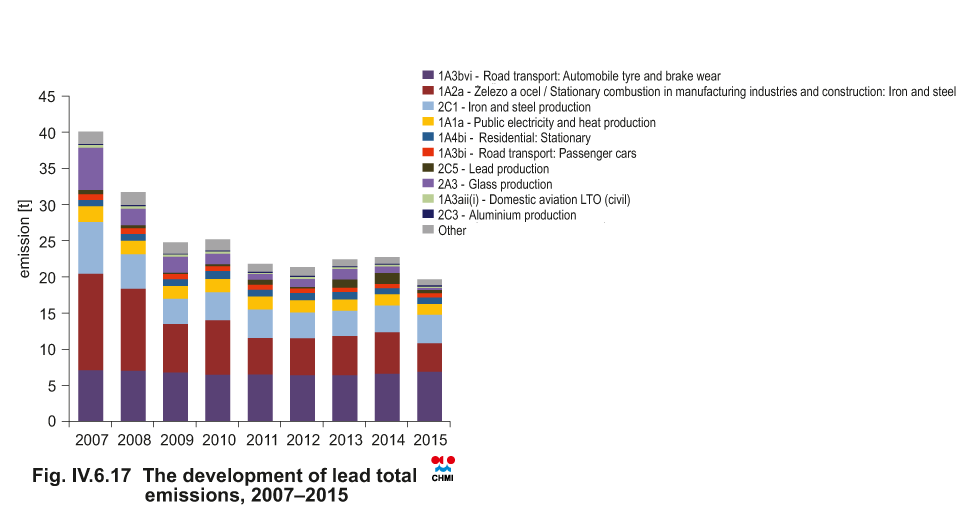
Fig. IV.6.17 The development of lead total emissions, 2007–2015
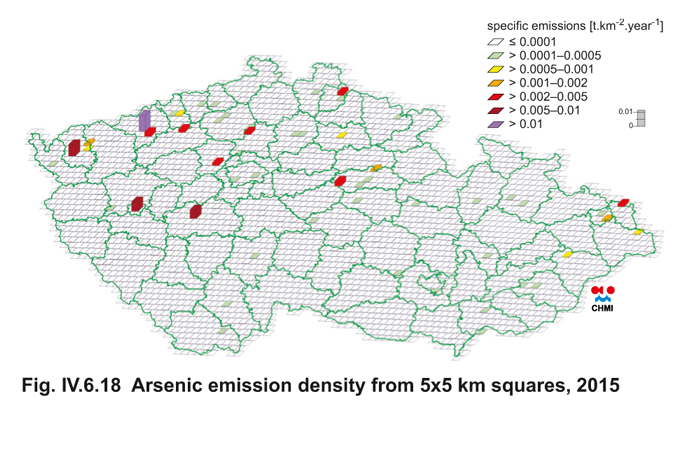
Fig. IV.6.18 Arsenic emission density from 5x5 km squares, 2015
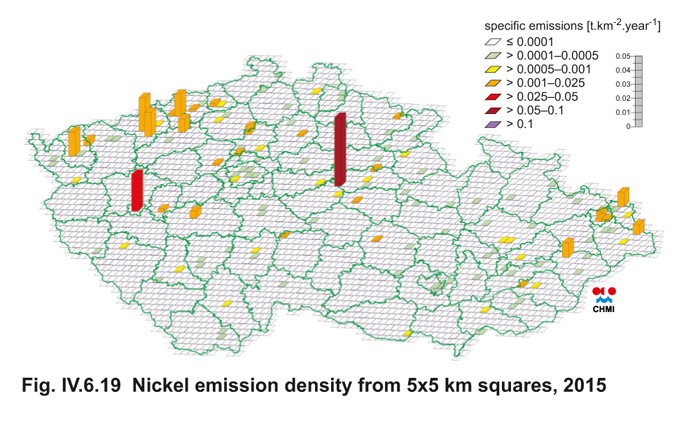
Fig. IV.6.19 Nickel emission density from 5x5 km squares, 2015
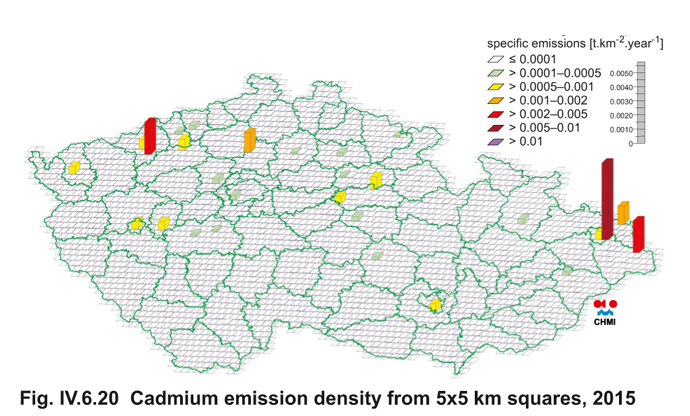
Fig. IV.6.20 Cadmium emission density from 5x5 km squares, 2015
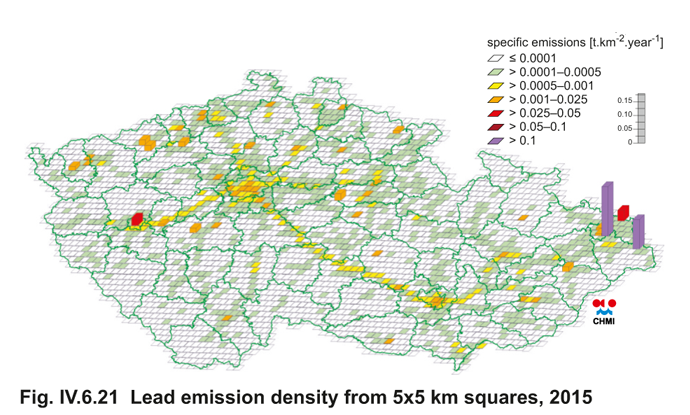
Fig. IV.6.21 Lead emission density from 5x5 km squares, 2015