IV.5 BENZENE
IV.5.1 Air pollution caused by benzene in the
year 2015
The annual pollution limit value for benzene of (C6H6) 5 μg.m-3 was not exceeded in 2016 at any of the 37 monitored locations (Fig. IV.5.1). The highest concentrations were attained, similarly to previous years, at stations in the O/K/F-M agglomeration. The Ostrava-Přívoz and Ostrava-Radvanice Medical Centre (Tab. XIII.13). At the Ostrava-Přívoz location, the average annual concentration de creased compared to 2015 from 5.0 μg.m-3 to 3.3 μg.m-3. At the Ostrava-Radvanice Medical Centre site, the concentration decreased slightly from 3.5 μg.m-3 to 2.9 μg.m-3. The concentrations decreased at seven of the eight locations in the O/K/F-M agglomeration. Higher concentrations of C6H6 in the O/K/F-M agglomeration are connected primarily with industrial activity, i.e. with the production of coke and with processing of chemical products (Fig. IV.5.1, Fig. IV.5.3; ČHMÚ 2013b).
Compared to 2015, the average benzene concentration decreased at 77% of locations (23 locations) and increased at 3% of locations (1 location) (of the total number of 30 stations where the benzene concentration was measured in 2015 and 2016). Benzene concentrations are usually lower in the summer than in the winter, probably because of the less favourable dispersion conditions in the winter (Schnitzhofer et al. 2008).
IV.5.2 Trends in Benzene concentrations
The annual average benzene concentrations in the Czech Republic in the 2005–2016 period passed through a maximum in 2006. Since then, they have slowly decreased with a slight deviation in 2010. The dispersion conditions were somewhat worse in the Czech Republic in 2006 and 2010 and this could have led to accumulation of pollutants in the atmosphere (Fig. IV.5.4). In 2015 the annual average concentration incereased marginally compared to the year 2014. This was caused by an increase of concentrations at industrial localities. At localities of other types, concentrations decreased.
Higher average concentrations are measured in urban locations, where the highest benzene concentrations are usually attained at stations classified as urban industrial and urban transport stations. On the other hand, lower values are attained at rural locations (Fig. IV.5.4). This difference is a result of the accumulation of industrial production and automobile transport in cities The same results were described by Karakitsios et al. (2007).
The average annual concentrations have decreased since 2012 in the O/K/F-M agglomeration, where the highest benzene concentrations were recorded over a long time (Fig. IV.5.1, Fig. IV.5.2). The only exception was the Ostrava-Přívoz location in 2015. The annual pollution limit value was exceeded at the Ostrava-Přívoz station before 2013 because of the occurrence of hourly concentrations greater than 50 μg.m-3, i.e. concentrations that were measured far less frequently at other stations in Ostrava and did not occur at all outside of Ostrava. The elimination of old environmental damage at Ostrava- Mariánské Hory1 had a temporary effect in increasing the benzene concentrations in Ostrava in 2011. The annual concentrations decreased after termination of operations at Koksovna Jan Šverma coke plants (shut down on 31 December 2010) and after implementation of a number of measures to reduce emissions at the sources of BorsodChem MCHZ, s. r. o., and OKK koksovny, a. s., (ČHMÚ 2013b).
IV.5.3 Benzene emissions
The balance of benzene emissions is based to a substantial degree on calculations from reported VOC emissions. Reporting of emissions can be found only for sources that have a legislative obligation to determine pollution levels, especially for reasons of compliance with emission limit levels. Some sources are exceptions, for example coke batteries and related chemical production, for which the obligation to monitor benzene emissions is imposed in the context of integrated permits and special procedures are used to determine leakages. The O/K/F-M agglomeration, where these technologies are operated, have long belonged among one of the few areas where the set emission limits were exceeded.
pared only exceptionally, usually as part of work on projects. The last of these corresponds to data from 2010 and, of the overall national amount of benzene of approx. 1250 t. p.a., the greatest amounts were derived from the use of coatings (Resler, Jareš 2014). The fractions of benzene in VOC emissions are partly a result of the composition of the products employed (e.g. solvents, paint, varnishes and adhesives) or fuels and can be determined from the anticipated compositions of specific organic substances formed in the combustion of various kinds of fuels. The greatest amounts of reported benzene emissions in 2015 (and in previous years) were reported from the operations of DEZA, a. s. – Chemical production, Valašské Meziříčí (3.46 t. p.a.); emissions from other sources are approx. an order of magnitude lower.
Tab. XIII.13 Stations with the highest values of annual average
concentrations of benzene

Fig. IV.5.1 Field of annual average concentration of benzene,
2016
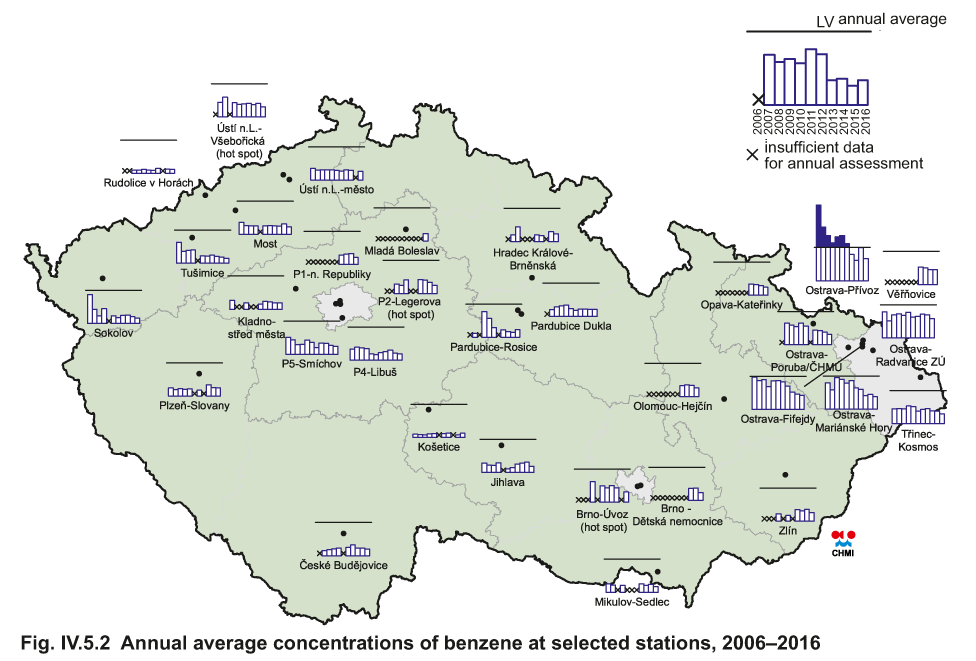
Fig. IV.5.2 Annual average concentrations of benzene at selected
stations, 2006–2016

Fig. IV.5.3 Five-year average of annual average concentrations
of benzene, 2012–2016
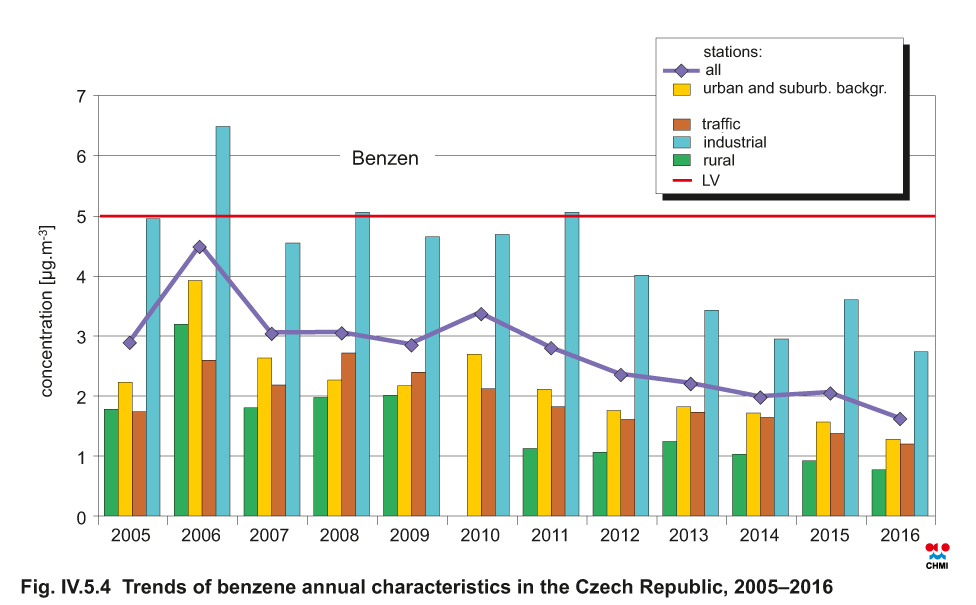
Fig. IV.5.4 Trends of benzene annual characteristics in the
Czech Republic, 2006-2016
1 Remediation of old environmental damage at Ostrava-Mariánské Hory proceeded through decontamination of waste-water lagoons formed by deposition of waste from refinery production, which was commenced in the 19th century (after 1965, waste from regeneration of used lubricating oils by the state enterprise OSTRAMO Ostrava and, after 1992, also by OSTRAMO-Vlček a spol., s r. o. were also deposited here). Operations were terminated in 1996.