IV.4 TROPOSPHERIC OZONE
IV.4.1 Air pollution caused by tropospheric ozone in the year
2015
Air pollution caused by tropospheric ozone in the year 2014 with regard to the limit values for the protection of human health
The pollution limit value for tropospheric ozone (O3) over the 2014–20161 three-year period was exceeded at 29% of locations, i.e. at 22 of 75 locations at which the concentration of O3 was measured (Tab. XIII.10 and Fig. IV.4.5). Compared to the previous 2013–2015 period, the number of cases where the pollution limit value was exceeded increased to 34% of locations (23 locations), a decrease was recorded at 48% of locations (32 locations) and no difference was recorded at 18% (12 locations).
In comparison of the three-year evaluated periods, a role is played by emissions of precursors and meteorological conditions, i.e. the intensity of solar radiation, temperature, wind speed and the occurrence of precipitation and/or the relative humidity (Blanchard et al. 2010; Ooka et al. 2011). The relationship between the amount of emitted precursors and the concentration of tropospheric ozone O3 is, however, not linear. This nonlinearity is a result of long-range transmission of O3 and its precursors and other factors, including climate change, emissions of non-methane volatile organic compounds (NMVOC) from vegetation and forest fires (EEA 2013a). Considering the very complicated atmospheric chemistry of the formation and decomposition of O3, its dependence on the absolute amounts and relative contents of its precursors in the air, which is also related to long-range transmission, and also on the meteorological conditions (Chap. IV.4.3), it is difficult to comment on the year-to-year changes in any detail.
Of the monitored locations, the lowest O3 concentrations were measured at traffic stations, where O3 is decomposed by chemical reactions with NO (Chap. IV.4.3). It can be assumed that the O3 concentrations are also below the limit in other areas with heavy traffic where, however, because of the lack of measurements, this probable reduction cannot be documented using current methods of map construction. On the other hand, the highest concentrations were measured at rural background locations (Table XIII.10). The pollution limit value for O3 was exceeded in the 2014–2016 three-year period over 18.5% of the territory of the Czech Republic with approx. 3.5% of the population (Fig. IV.4.1). Compared with the previous 2013–2015 period, the area of the affected territory decreased by 8.3 percentage points (from 26.8%).
Tab. XIII.12 lists the numbers of hours when the informative threshold value for O3 was exceeded (i.e. an hourly average concentration of180 μg.m-3) over the 2000–2016 measuring period at selected AIM stations. More detailed evaluation related to exceeding of the threshold value of 180 μg.m-3 can be found in Chap. VI.
The annual progression of average monthly concentrations of O3 (maximum 8-hour running average for the relevant month) is characterised by an increase in concentration in the spring and summer (Fig. IV.4.3) because of the favourable meteorological conditions for formation of O3, such as high solar radiation intensity, high temperatures and low atmospheric humidity. In this case it is also clear that the highest maximum 8-hour running averages are recorded at rural locations at which the value of the pollution limit value is also most often exceeded (Fig. IV.4.5).
Air pollution by tropospheric ozone in 2016 in
relation to the pollution limit value for protection
of ecosystems and vegetation
The pollution limit value for O3 for protection of vegetation of 18,000 μg.m-3.h was exceeded at 8 locations of the total number of 36 rural and suburban stations for which calculation of the exposure index AOT40 is relevant according to the legislation (for the 2012–20162 average). This applied to the stations at Štítná n. Vláří, Kuchařovice, Ostrava-Radvanice OZO, Červená hora, Mikulov- Sedlec, Polom, Brno-Tuřany and Rudolice v Horách (Table XIII.11). Compared to the previous evaluated five-year period of 2011–2015, there was an increase in the number of locations where the limit value was exceeded from 15% (5 locations) to 24% (8 locations) of the total number of 34 locations evaluated in both periods. Compared to 2015, an increase in the value of the exposure index AOT40 in 2016 was recorded at 53% of locations (18 locations), while a decrease was found at 47% of locations (16 locations).
IV.4.2 Trends in the concentration
of tropospheric ozone
Since 2000, the trend in the 26th highest daily maximum 8-hour running average of the average O3 concentration has a decreasing tendency, where marked exceptions were recorded in 2003 (i.e. the three-year average for 2001–2003), 2006 (i.e. the average for 2004–2006) and 2015 (i.e. the average for 2013–2015). In 2003, the 26th highest value of the maximum 8-hour running average was the highest for the entire monitored period (Fig. IV.4.6). In that year, all of Europe was characterised by substantially above-average concentrations of tropospheric O3 (Sicard et al. 2011; Cristofanelli et al. 2007; Pires et al. 2012) with above-average temperatures during the summer season (EEA 2014). Characteristically favourable conditions for the formation of tropospheric O3 were recorded in 2003, 2006 and 2015. Until 2008, the pollution limit value was exceeded in several years; in the following years, the 26th highest value of the maximum 8-hour average varied under the pollution limit value and the pollution limit value was exceeded for the last time in 2015. It is apparent from this evaluation that the highest values are regularly attained at rural locations compared to the urban and suburban background stations (Fig. IV.4.6).
A decreasing trend in the concentrations of tropospheric O3 was recorded, not only in Europe (Sicard et al. 2013; EEA 2013a), but also in the U.S.A. (Butler et al. 2011). In 1990–2010, a difference was observed between the concentrations measured at rural and urban locations at stations in Europe and the U.S.A. (Paoletti et al. 2014). Simultaneously, the maximum values measured at these stations also decreased. The mentioned decrease in the concentrations of tropospheric O3 is ascribed, amongst other things, to a reduction in emissions of precursors, especially of NOx, in advanced countries (Sicard et al. 2013).
The exposure index AOT40 (five-year average for 2012–2016) in 2016 registered a decrease after increasing for two years (Fig. IV.4.8 and Fig. IV.4.8).
IV.4.3 Formation of tropospheric ozone
O3 does not have a significant source of its own in the atmosphere. This is a "secondary" substance formed by a number of complicated nonlinear photochemical reactions, which were described in detail, e.g. by Seinfeld and Pandis (2006). Precursors of O3 include nitrogen oxides (NOx) and nonmethane volatile organic compounds (NMVOC), while methane (CH4) and carbon monoxide (CO) play a role on a global scale. The photolysis of NO2 by radiation with a wavelength of 280–430 nm is an important reaction, forming NO and atomic oxygen. O3 molecules are formed by the reaction of atomic and molecular oxygen in the presence of a catalyst. Simultaneously, O3 is titrated with nitrogen oxide, NO, with the formation of NO2 and O2. If O3 is replaced by radicals in this reaction, its concentration increases in the atmosphere. The OH radical plays an especially important role in this reaction.
NOx are formed in all combustion processes. NMVOC are emitted from a number of anthropogenic sources (transport, manipulation with petroleum and its derivatives, refineries, the use of coatings and solvents, etc.), and also natural sources (e.g. biogenic emissions from vegetation).
In the formation of O3 from precursors, the absolute
amounts of precursors is not important, but rather
their mutual ratios (Sillman et al. 1990; Fiala,
Závodský 2003). In areas where the regime is limited
by NOx, characterised by relatively low concentrations
of NOx and high concentrations of VOC, the
O3 concentrations increase with increasing NOx
concentrations, but only minimally with increasing
VOC concentrations. On the other hand, in areas
with a regime limited by VOC, the O3 concentrations
decrease with increasing NOx concentrations
and the O3 concentrations increase with increasing
VOC concentrations. Areas with a high NOx/VOC
ratio are typically polluted areas around the centres
of large cities. The dependence of the formation of
O3 on the initial concentrations of VOC and NOx is
frequently expressed by ozone isopleth diagrams,
which depict the maximum attained ozone concentration
as a function of the initial NOx and VOC
concentrations (Moldanová 2009). Not only the
concentrations of precursors, but also meteorological
conditions, play an important role in the
formation of O3 (Colbeck, Mackenzie 1994). The
pollution concentrations of O3 increase with increasing
ultraviolet radiation and temperature, but
decrease with increasing relative atmospheric
humidity. High concentrations are often connected
with prolonged anticyclone situations. In addition
to the above-described photochemical mechanisms,
the concentrations of O3 can also increase in
episodes as a result of penetration of stratospheric
O3 into the troposphere and also during thunderstorms.
Recently, there has also been an increase
in the importance of long-range transmission of O3
in the air streams in the northern hemisphere to
Europe and North America from source areas in
south-east Asia. O3 is removed from the atmosphere
by reaction with NO and dry deposition.
Tab. XIII.11 Stations with the highest AOT40 values of ozone at rural and suburban stations
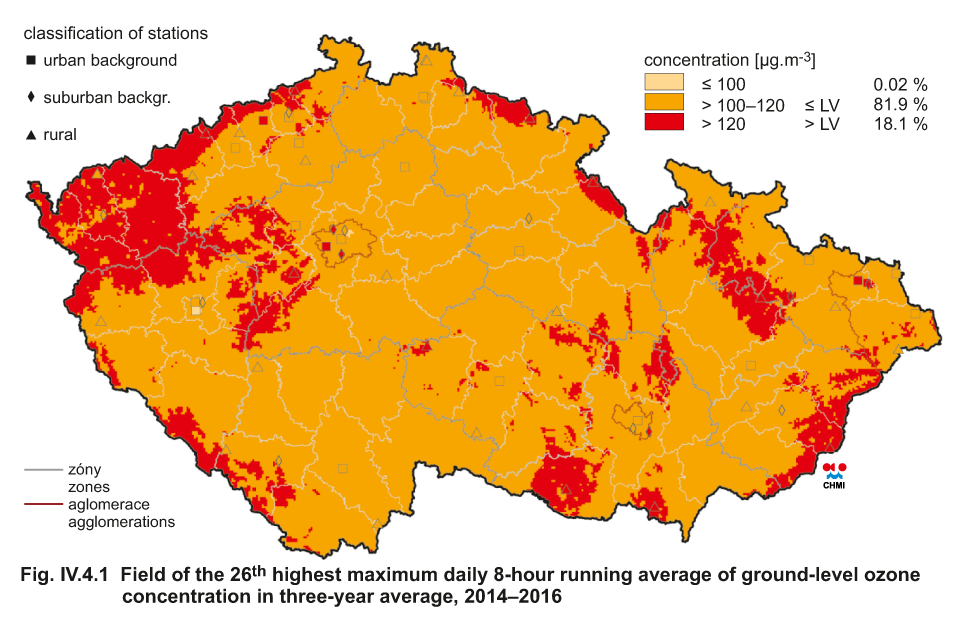
Fig. IV.4.1 Field of the 26th highest maximum daily 8-hour
running average of ground-level ozone concentration in three-year
average, 2014–2016
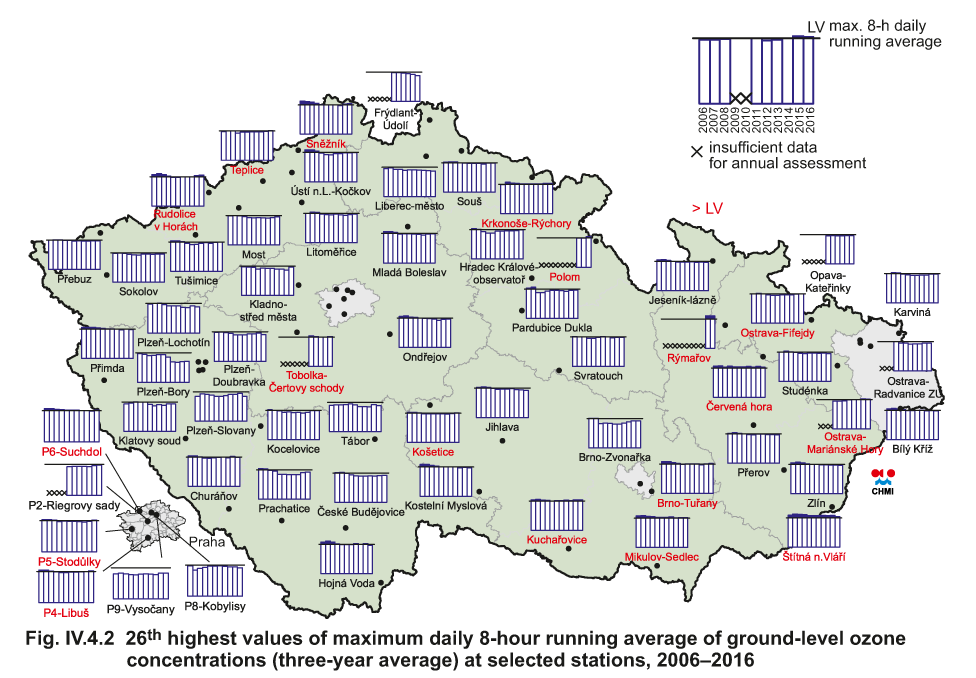
Fig. IV.4.2 26th highest values of maximum daily 8-hour running
average of ground-level ozone concentrations (three-year average)
at selected stations, 2006–2016
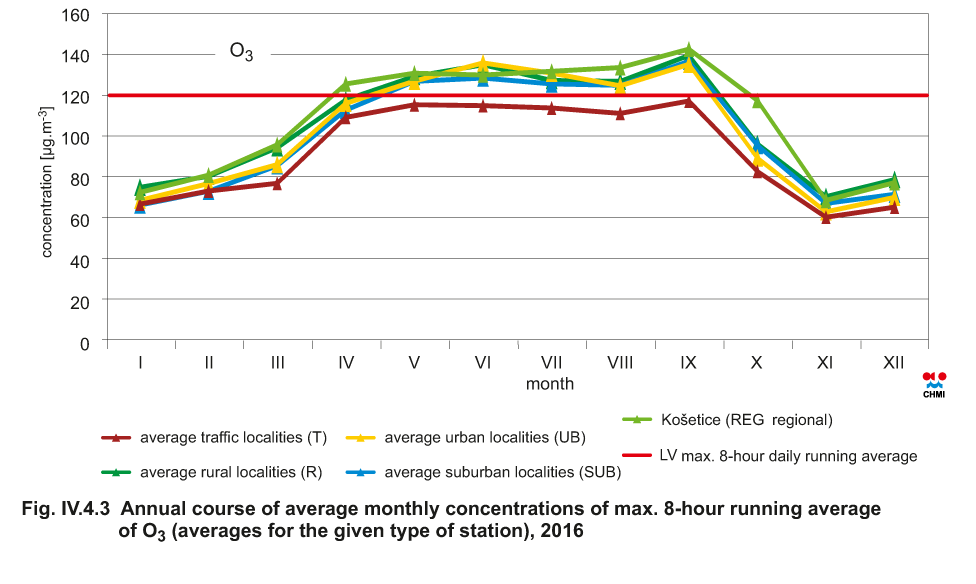
Fig. IV.4.3 Annual course of average monthly concentrations of
max. 8-hour running average of O3 (averages for the given type
of station), 2016
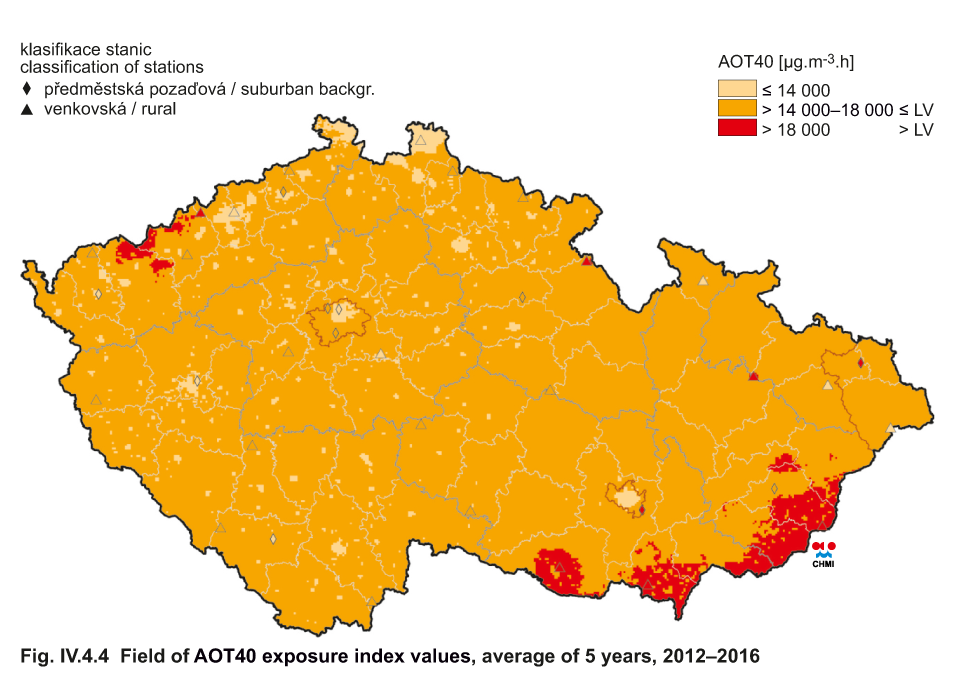
Fig. IV.4.4 Field of AOT40 exposure index values, average of 5
years, 2012–2016
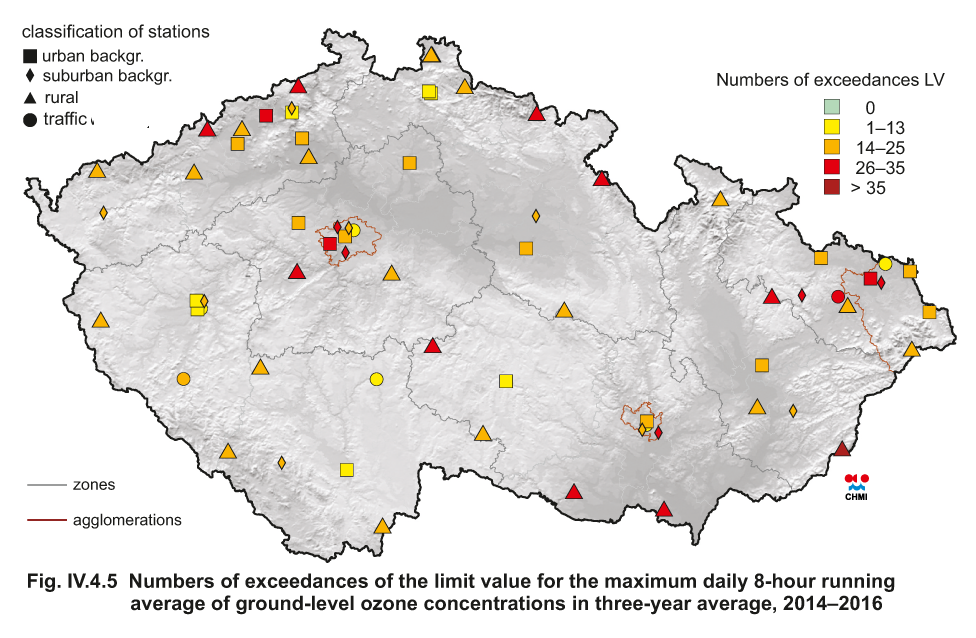
Fig. IV.4.5 Numbers of exceedances of the limit value for the
maximum daily 8-hour running average of ground-level ozone
concentrations in three-year average, 2014–2016

Fig. IV.4.6 Trends of O3 annual characteristics in the Czech
Republic, 2000–2016
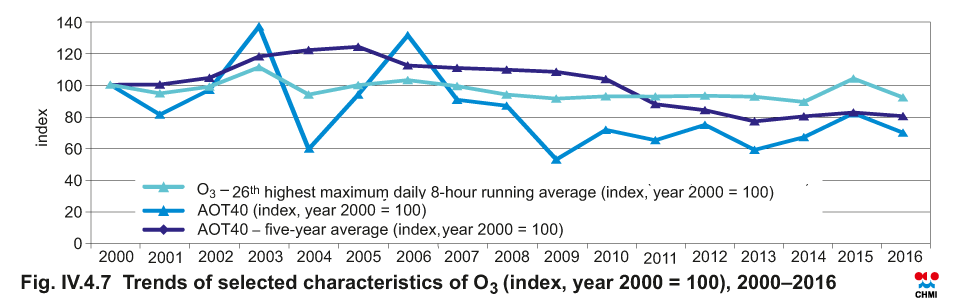
Fig. IV.4.7 Trends of selected characteristics of O3 (index,
year 2000 = 100), 2000–2016
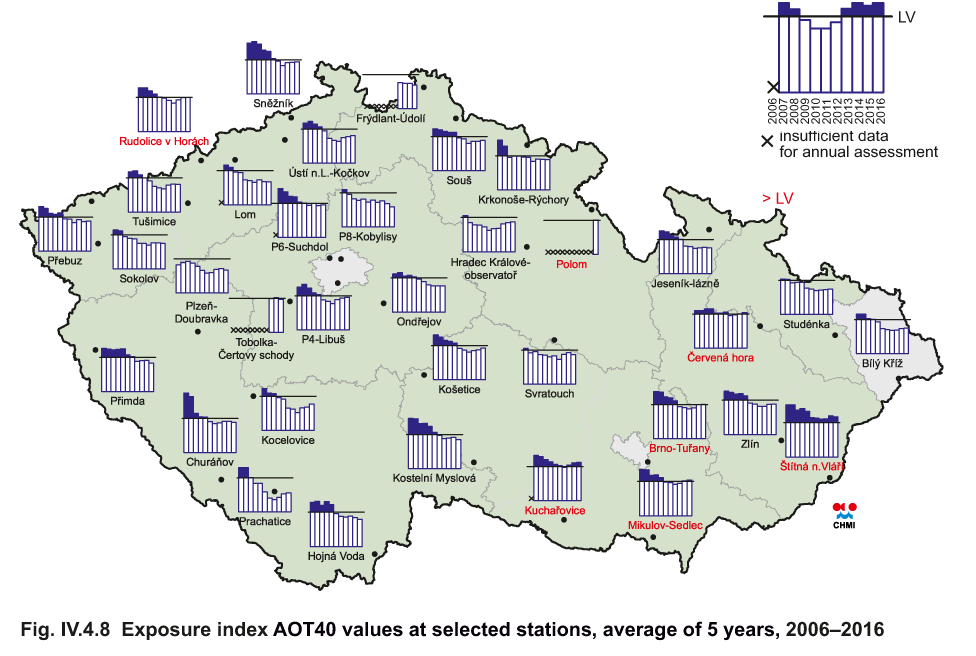
Fig. IV.4.8 Exposure index AOT40 values at selected stations,
average of 5 years 2006–2016
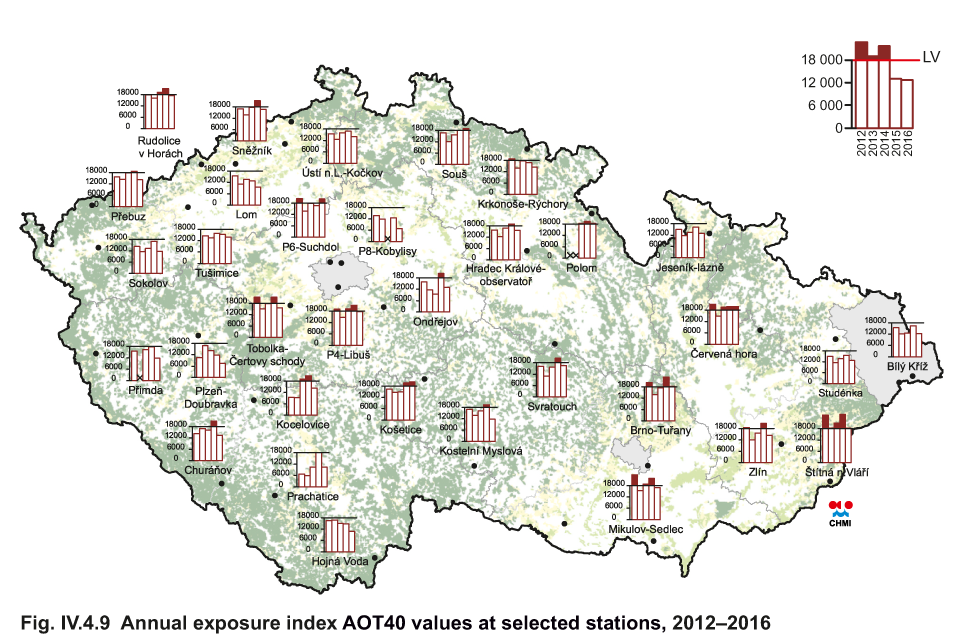
Fig. IV.4.9 Annual exposure index AOT40 values at selected
stations, 2012–2016
1 The annual pollution limit value is exceeded if the maximum daily 8-hour sliding average of O3 is greater than 120 μg.m-3 at least 26 times on an average over 3 years.
2 In accordance with the relevant EU Directive, the Czech legislation employs the exposure index AOT40 for evaluating the protection of vegetation against excessive ozone concentrations. The cumulative exposure to ozone AOT40 is calculated as the sum of the differences between the hourly concentration of ozone and the threshold value of 80 μg.m-3 (= 40 ppb) for each hour when this threshold value was exceeded. According to the requirements of Government Regulation No. 597/2006 Coll., AOT40 is calculated for a period of three months from May to July, measured every day between 8:00 and 20:00 CET [7:00 to 19:00 UTC].