IV. AIR QUALITY IN THE CZECH REPUBLIC
IV.1 SUSPENDED PARTICLES
Air pollution by suspended particulate matter in the PM10 and PM2.5 fractions remains one of the main problems that must be resolved to provide for air quality in the Czech Republic. Exceeding of the pollution limit levels for PM10 and PM2.5 continues to make a significant contribution to definition of areas with above-limit air pollution. Since 2008, measurements have begun of the fine parts of the fraction, PM1, at some locations.
IV.1.1 Air pollution caused by suspended particles in the year 2016
Suspended particles of PM10 fraction
The pollution limit level for the average 24-hour concentration of PM10 was exceeded in 2016 over 1.4% of the territory of the Czech Republic with approx. 7.3% of the population. Only a local value exceeding the pollution limit level of PM10 for the average annual concentration at a single station was recorded in 2016 (Figs. IV.1.1 and IV.1.2).
The 24-hour pollution limit level for PM10 was exceeded in 2016 at 15.9% of stations (23 stations of a total number of 145 with sufficient data for evaluation). This is less than in 2015, when exceeding of the daily pollution limit value for PM10 was recorded at 23.4% of stations (29 stations of 124; Fig. IV.1.8). The trend thus continued in decreasing the number of territories in which the daily pollution limit level for PM10 was exceeded, which has been apparent since 2010 with minor deviations. There was a decrease from 2.5% of territories, where approx. 10.4% of the population of the Czech Republic lived in 2015, to the above-mentioned 1.4% with 7.3% of the population in 2016. The above decrease in the territory where the 24-hour limit value was exceeded was manifested particularly in the Moravian-Silesian region and in the O/K/F-M agglomeration. The most burdened continuous area, similar to previous years (Fig. IV.1.5 and Fig. IV.1.6), was the O/K/F-M agglomeration, where the daily pollution limit level for PM10 was exceeded at the greatest number of stations in 2016. However, the 24-hour pollution limit value for PM10 was also exceeded in other zones and agglomerations. Values exceeding the limit value were measured in 2015 in all the zones and agglomerations, with the exception of the North-East and South-East and the agglomeration of Prague (ČHMÚ 2016). In 2016, exceeding of the limit value was not recorded in the North-East, Central Bohemian, South-West and South-East zones and in the agglomeration of Prague (Fig. IV.1.3). In the Brno agglomeration, the 24-hour pollution limit level for PM10 was exceeded in 2016 only at the Brno-Svatoplu-kova and Brno-Zvonařka traffic locations (Chapter V.2). Exceeding of the pollution limit levels in Prague and Brno was connected primarily with high traffic levels; in the O/K/F-M agglomeration and the other zones, however, the pollution limit levels were also exceeded at the background urban, sub-urban and rural stations.
The pollution limit levels for the average annual concentration of PM10 were exceeded in 2016 at 0.7% of stations, i.e. at only 1 of the total number of 152 stations in the Czech Republic with a sufficient amount of data for the evaluation, at the Ostrava- Radvanice Health Centre station in the O/K/F-M agglomeration (Tab. XIII.2 and XIII.5). This local above-limit value was not reflected in the map of the average annual concentration on the scale in which it is presented (Fig. IV.1.2). One year earlier, in 2015, the annual pollution limit level was exceeded at 2.3% of stations (3 stations of 132; Fig. IV.1.8), corresponding to above-limit values over 0.02% of the territory, with 0.01% of the population. Reduction of the annual concentration of suspended particulates is most apparent in the Hradec Králové, Olomouc and Moravian-Silesian regions.
The PM10 concentrations exhibit a clear annual variation with the highest values in the colder months of the year (Fig. IV.1.11). Higher PM10 concentrations in the air during the colder season are related both to greater emissions of particulates the seasonal heating sources and also deterioration of the dispersion conditions, which occurs more frequently in the winter. For example, local heating sources contribute 36% and almost 55% to PM10 and PM2.5 emissions, resp., in the Czech Republic (Fig. IV.1.17 and Fig. IV.1.19). Compared with 2015, the annual variation in the PM10 concentrations in 2016 had a different shape, with larger average monthly concentrations in January, during which smog situations were announced (Chap. VI). A greater reduction in the PM10 concentration occurred in February, which had unusually above-normal temperatures with excellent dispersion conditions. Higher PM10 concentrations were also recorded in September of 2016 (Fig. IV.1.11). This was caused by the above-average temperatures, which caused elevated resuspension1 with a slight deterioration in the dispersion conditions, which improved during October.
A decrease in the concentrations of PM10 and PM2.5 compared to the previous year was caused primarily by the favourable meteorological and dispersion conditions and the warmer temperatures in the heating season (Chapter III).
Suspended particles of PM2.5 fraction
A certain reduction in the level of air pollution in 2016 compared to 2015 occurred for PM2.5 particulates. The pollution limit level for the average annual concentration of PM2.5 was exceeded over 0.5% of the territory of the Czech Republic with approx. 3% of the population (Fig. IV.1.4), compared to 0.9% of the area with 5.1% of the population in 2015. The limit level was exceeded in 2016 at nine stations in the Moravian-Silesian region and at one station in the Ústí region (Tab. XIII.3, Fig. IV.1.7). Exceeding of the pollution limit level was recorded at 10 (12.4%) of a total of 81 stations, where the level was exceeded in 2015 at 6 stations (12.5%) of 48 (Fig. IV.1.8).
Higher air pollution levels by PM2.5 occurred mainly in the colder part of the year (Fig. IV.1.12) and, similar to PM10, are a consequence of emissions from heating and worse dispersion conditions. Similarly as for PM10, the highest average monthly concentration of PM2.5 in 2016 was measured in January.
Suspended PM1 particles
The fine particulate fraction PM1 was measured in 2016 at 14 locations, of which four stations were in Plzeň, four were in the Brno-city district, two stations were in the Brno-rural district and in the O/K/F-M agglomeration and one each in the Zlín and Prague districts (Tab. XIII.4). The highest maximum annual and daily concentrations (23.7 μg.m-3 and 168.6 μg.m-3 resp.) were attained at the Ostrava- Českobratrská (hot spot) station.
Ratio between the PM2.5 and PM10 fractions
of suspended particles
The ratio of the PM2.5 and PM10 fractions is not constant, but exhibits seasonal variations and is also dependent on the character of the location (Fig. IV.1.13). In 2016, this ratio varied on an average from measurements at 49 locations in the Czech Republic where PM2.5 and PM10 are measured simultaneously and the locations have a sufficient number of values, in the range from 0.67 (August) to 0.87 (January and December) with lower values in the summer season. In Prague, where the annual variations are affected by the large fraction of traffic locations, this ratio was in the range from 0.62 (June) to 0.85 (January), Brno 0.63 (August) to 0.83 (December), in the O/K/F-M agglomeration, 0.70 (July) to 0.88 (January) and in the Ústí region 0.67 (August) to 0.84 (March and December). When this ratio is compared according to the classification of locations, the ratio at rural locations is from 0.64 (July) to 0.88 (January and December), urban 0.68 (July and August) to 0.88 (January), suburban 0.71 (August) to 0.89 (March) and traffic 0.62 (August) to 0.84 (January and December).
The annual variation in the ratio of the PM2.5/PM10 fractions is related to the seasonal character of some emission sources. Emissions from combustion sources exhibit a greater content of the PM2.5 fraction than, e.g., emissions from agricultural activities and resuspension during dry and windy weather. Heating in the winter season can thus lead to a greater content of the PM2.5 fraction compared to the PM10 fraction. The decrease during the spring and start of the summer is explained in some works also as being a result in the amount of larger biological particulates, e.g. pollen (Gehrig, Buchmann 2003). The higher ratio of the PM2.5/PM10 fractions as a result of combustion processes has been observed at industrial stations.
The PM2.5/PM10 ratio is smallest at traffic locations (Fig. IV.1.13). During combustion of fuel in traffic, the particulates belong mainly in the PM2.5 fraction and the ratio should be large at traffic locations. The fact that this is not true emphasises the importance of emissions of the largest particulates from abrasion of tyres, brake linings and highways. The content of the larger fraction at traffic stations also increases as a consequence of resuspension of particulates from winter grit scattering. An increase in the PM10 concentration can also occur as a result of greater abrasion of the road surface by grit and subsequent resuspension of the abraded material (EC 2011).
IV.1.2 Development of PM10 and PM2.5 concentrations
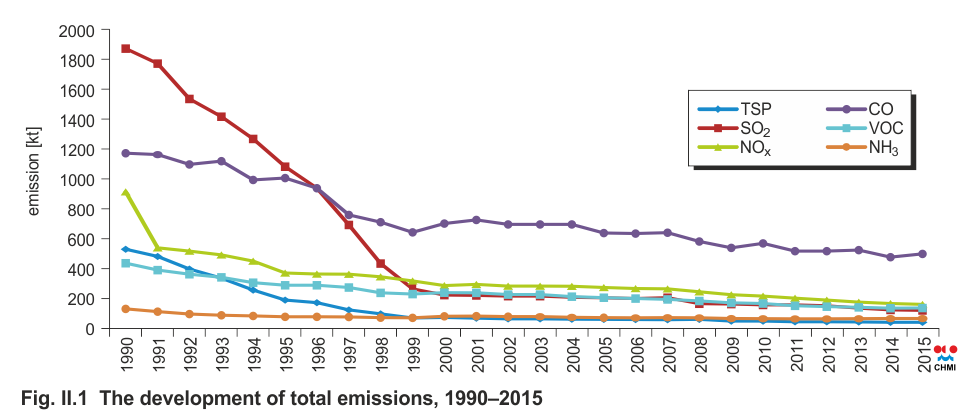
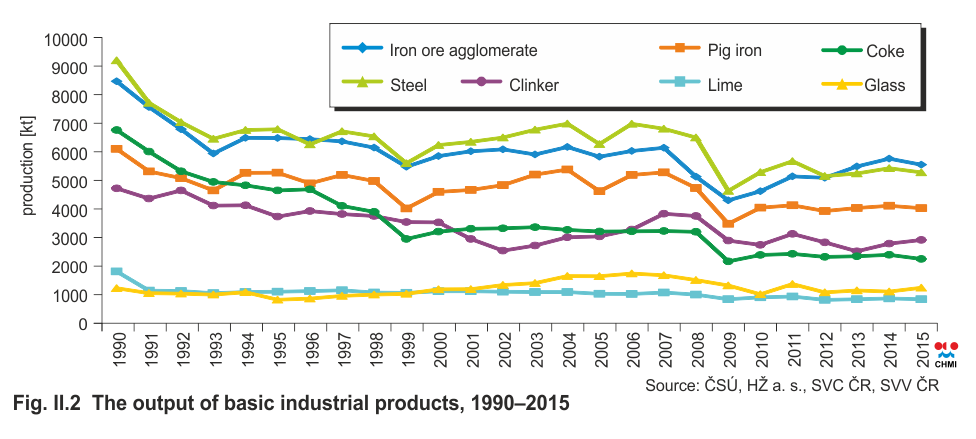
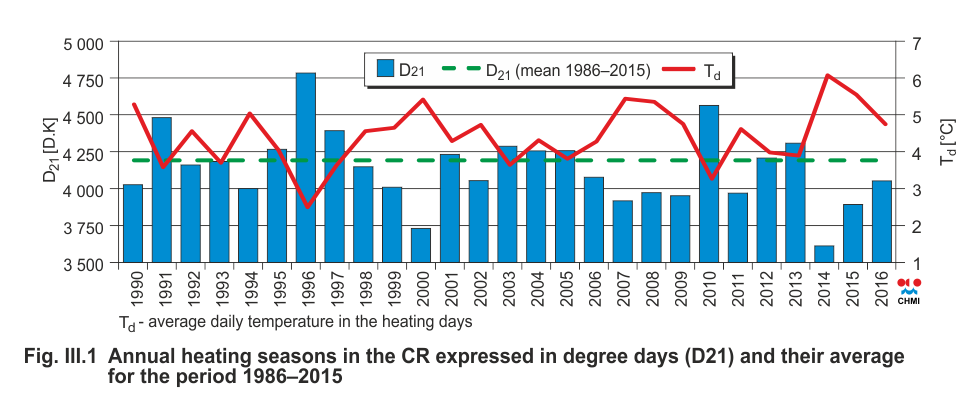
The concentration of suspended particulates PM10, similar as for other air pollutants, decreased substantially in the 1990's. This was because of a substantial reduction in emissions of SPM and precursors of suspended particulates (SO2, NOx, NH3 and VOC) in 1990–2001 as a consequence of legislative changes, restructuring of the economy and modernisation or termination of operation of the sources (Chapter II, Fig. II.1). The reduction in emissions in 2001 was slower (Fig. II.2) and thus the resultant pollutant concentrations were determined mainly by the predominant meteorological and dispersion conditions in the given year. Air pollution by PM10 increased from 2001 to 2003 at almost all the locations in the Czech Republic. The highest values of PM10 concentrations in the period after 2000 were measured in 2003. The higher PM10 concentrations in 2003 were a consequence of both unfavourable dispersion conditions in February and December and a subnormal amount of precipitation. After a temporary decrease in 2004, high concentrations of suspended particulate matter were again recorded in 2005 and 2006, especially as a consequence of long episodes with unfavourable dispersion conditions in the winter. In 2007–2009, the dispersion conditions were better and the concentrations of particulates decreased substantially compared to 2003. 2005 and 2006. In 2008, lower concentrations of particulates were probably a result of the substantial reduction in emissions of some precursors during temporarily reduced operations in some branches of the economy as a consequence of the economic crisis (Chapter II). The subsequent increase in the concentrations of suspended particulates in 2010 was caused especially by the occurrence of unfavourable meteorological conditions in the winter at the beginning and end of the year and the coldest winter season since 1996 (Fig. III.1). The average concentrations of suspended particulates have decreased over the past six years since 2010 (Figs. IV.1.14, IV.1.15 and IV.1.16). A decrease in the PM10 concentrations was manifested at locations in all the categories (Fig. IV.I.14). The average annual concentration of PM10 has long remained below the pollution limit value; however, the annual average PM2.5 concentration and the highest 36- day concentration of PM10 vary around the pollution limit level value (in all cases averaged for all types of locations and all of the Czech Republic; Figs. IV.1.14 and IV.1.15).
Annual above-limit concentrations of PM10 and PM2.5 have long affected 0.3% and 1.6%, resp., of the territory of Czech Republic (Fig. IV.1.9 and IV.1.10, resp.). These areas are primarily the territory of the O/K/F-M agglomeration and part of the Moravian-Silesian zone. The decreasing trend in recent years is apparent from comparison of the territorial distribution of the five-year average and annual average for 2016, where a decrease in the territory with annual above-limit concentrations can be seen. Above-limit concentrations of PM10 occurred almost only in the O/K/F-M agglomeration and above-limit PM2.5 concentrations occurred only occasionally (Figs. IV.1.2 and IV.1.9 or IV.1.4 and IV.1.10, resp.).
IV.1.3 Emissions of PM10 and PM2.5
Solid, liquid or mixed suspended particulates can be formed during fuel combustion and other industrial activities. Summarily these suspended particulates are designated in the Czech legislation as solid pollutants (SP) and in the foreign literature as Total Suspended Particulates (TSP). SP emissions have various sizes and chemical compositions depending on the character of the source and the means of formation. They can contain heavy metals and act as a carrier medium for VOC and PAH. M10 and PM2.5 size fractions are most frequently distinguished in emission inventories in dependence on the pollution limit levels.
Emission inventories of PM10 and PM2.5 performed by contemporary methods encompass only the primary emissions of these substances. Simultaneously, a considerable contribution to the concentrations of PM10 and PM2.5 measured in the air comes from secondary suspended particulates formed directly in the air from their gaseous precursors by physicalchemical reactions. The fraction of secondary suspended inorganic particulates in total PM2.5 concentrations in urban environments can be between 20 and 40% (Vlček, Corbet 2011). The contribution of secondary suspended organic particulates of biogenic origin under European conditions can equal 2–4 μg.m-3 (Fuzzi et al. 2015).
Compared to emissions of other pollutants, PM emissions are emitted into the air from a great many important groups of sources. In addition to sources from which these substances are emitted through controlled chimneys or stacks (industrial sources, local heating units, transport), significant amounts of PM emissions are derived from fugitive sources (quarries, dusty material dumps, operations involving dusty materials, etc.). Emissions from abrasion of tyres, brake linings and abrasion of roads calculated from traffic levels are also included. The quality of the air is also affected by resuspension of particles (stirring-up), which is not included in standard emission inventories. The main sources of PM emissions in 2015 included the 1A4bi sector – Residential: Stationary, which contributed to air pollution on a country-wide scale with 36.4% PM10 substances and 54.5% PM2.5 substances (Fig. IV.1.17 and Fig. IV.1.19). Further important sources of PM10 emissions include 3Dc – Farmlevel agricultural operations, where these emissions are formed during tillage of the soil, harvesting and cleaning agricultural crops. This sector corresponded to 12.7% of PM10 emissions. A substantial risk to human health is caused by particulates derived from transport, especially from fuel combustion in diesel engines, which produce particles with a size of units to hundreds of nano-metres (Vojtíšek 2010). Sectors 1A3biii – Road transport: Heavy duty vehicles and buses, 1A3bi – Road transport: Passenger cars and 1A4cii – Agriculture, forestry and fishing: Off-road vehicles and other machinery contributed 9.3% to PM10 emissions and 14.1% to PM2.5 emissions.
The contribution of household heating with solid fuels did not change much in the 2007–2015 period and thus the trend in PM10 and PM2.5 emissions was affected most by meteorological conditions during the heating season (Fig. IV.1.18 and Fig. IV.1.20). Natural renewal of the vehicle fleet, reduction of agricultural production and application of the best available technology for reducing SP (textile filters) made the greatest contributions to the reduction in emissions.
In various regions of the Czech Republic, the contributions of the individual emission sources differ depending on the composition of sources in the given area. As the main sources of PM10 and PM2.5 emissions are in the sector of local heating, the production of these substances is distributed throughout the territory of the Czech Republic with residential buildings (Fig. IV.1.21 and Fig. IV.1.22). When the territory of the Czech Republic is divided into 5 x 5 km squares, locations where important energy production burning solid fossil fuels and large industrial complexes (especially the Moravian- Silesian and Ústí districts) are located correspond to substantially higher emissions. The fraction of emissions from transport is greater primarily in large cities.
IV.1.4 Measurements of numerical size distribution of
aerosol particles
Atmospheric aerosols (AA), defined as solid and liquid particles suspended in the atmosphere, are its natural component. AA cause optical phenomena in the atmospheric such as colourful sunsets, rainbows and halo phenomena). AA reflect and absorb solar radiation, and also play an important role in the formation of clouds and precipitation (as cloud condensation nuclei; Hinds 1999, Pöschl 2005, Seinfeld, Pandis 2006). The range of AA particle sizes spans five orders of magnitude (from units of nm to thousands of μm). They therefore comprise a wide spectrum of particles of different shapes, properties and chemical composition.
The negative impact of suspended particles (PM10 and PM2.5) on human health has been described in a great many studies (e.g. Brook et al. 2004; Schladitz et al. 2015; WHO 2013). However, the most serious problem is associated with ultra-fine particles (with a size below 100 nm). These particles can readily pass from the respiratory system into the blood stream and can then be transported to sensitive organs or to the central nervous system. The presence of these particles in the blood can affect their functioning and properties (Borsós et al. 2012; Pöschl 2005). Ultra-fine particles are highly reactive and can contain heavy metals and toxic substances (Chen et al. 2016). The weight of ultrafine particles is negligible in the standardly measured PM10 and PM2.5 size spectrum and thus measurement of the health impact is better performed by measu-ring the number of particles and their size distribu-tion (Tuch et al. 1997), which is also an important parameter for evaluating the extent of direct and indirect impacts on the climate (Stanier et al. 2004).
In the context of cooperation of CHMI with the Institute of Chemical Process Fundamentals of the Czech Academy of Sciences (ICPF CAS), measurement of the size distribution of aerosol particles has been performed since 2008 at the Košetice Observatory. The performance of these measurements is also supported by participation of the station in the ACTRIS-2 and ACTRIS-CZ (Aerosols, Clouds, and Trace gases Research InfraStructure Network) projects. The Košetice background station is located away from direct pollution sources. The daily spectrum of particle sizes in 2016 exhibits a radual increase in the number of particles in the nucleation mode (smaller than 20 nm) that continues until a maximum is attained between 7 and 8 P.M. The trends in the numbers of particles in the remaining parts of the spectrum (the Aitken and accumulation modes) attain the greatest values in the afternoon and evening (Fig. IV.1.23). Particles in the nucleation mode are either emitted directly into the air or are formed as a result of the presence of gaseous precursors (e.g. SO2, NOx, O3, VOC) in the atmosphere. At this location, the increase in the number of particles in the nucleation mode is probably caused by events in which new particles are formed.
One example of the influence of human activity could be the hourly spectra of the number of particles on the last day of April, when traditional evening bonfires are lit to mark Walpurgis (Witches') Night (Fig. IV.1.24). The above-described event of the formation of new particles took place in the morning of 30 April 2016. The daily spectrum exhibits a sharp increase in the number of particles in the nucleation mode from 9 o'clock in the morning until the afternoon. In addition to these events, the spectrum is dominated by an increase in the number of particles in the Aitken mode (between 20 and 100 nm) in the evening, where the particles are formed, amongst other things, by combustion processes from local sources.
A more pronounced daily progression of the number of particles is observed at the Ústí nad Labem-city station, where measuring the size distribution of particles has been performed since mid-2011. The increasing number of particles in all parts of the spectrum starting in the morning reflects not only peak traffic conditions, but also the increasing occurrence of combustion products from industrial sources. These sources are connected with elevated production of both particles and their gaseous precursors, from which secondary particles can be formed by photochemical processes. A reduction in concentration is followed by a repeated increase in the evening and at night. While the number of particles in the nucleation mode decreases at night, particles in the 100 to 200 mm category become predominant (Fig. IV.1.25). Starting in 2017, measuring of the particle size distribution will also be performed at the Lom station. The scanning mobility particle size scanner (SMPS) at both stations is equipped with a thermodenuder that enables determination of the fraction of volatile substances at both stations. Data from the measurements are sent to the ACTRIS-2 database.
The number of particles in the size fraction from 250 to 3200 nm has been monitored at the background urban site of Ostrava-Fifejdy since 2008; in 2012–2015 this was extended to the background suburban site at Ostrava-Poruba. At the beginning of 2016, the measurement was moved from Poruba to the background rural station at Věřňovice.
In 2016, the average number of particles at the Ostrava-Fifejdy station was 1071 particles per cm3, i.e. more than in 2015. The average number of particles at the Věřňovice station was 1659 per cm3. The Věřňovice station exhibited a higher number of particles per cm3 than the Fifejdy station in all the fractions, indicating, amongst other things, a higher fraction of pollution sources in the border region with Poland and the agricultural areas around the station. In the cooler part of the year, the number of particles is also substantially affected by the higher concentrations of the gaseous precursors sulphur dioxide and nitrogen oxides, which is typical for the entire Ostrava-Karviná area.
The median daily progression in the number of particles is more pronounced at Věřňovice (Fig.IV.1.27) for the larger 1–2 μm fractions; the daily variation in these size fractions is more balanced at Fifejdy (Fig. IV.1.26). The lowest values during the day are attained in the afternoon and the highest values occur during the evening, night and early morning. None of these locations is substantially affected by transport and there is no visible increase in the number of particles during peak traffic hours.
In recent years, it has become increasingly important to monitor the number of aerosol particles. In the context of improved monitoring of air quality, measurement of particles in the 0.172–17.165 μm size range will be begun at 6 further CHMI locations in 2017.
IV.1.5 Monitoring concentrations of elemental and organic
carbon
Carbonaceous aerosol particles in the atmosphere are formed mainly of elemental carbon and organic compounds (Seinfeld, Pandis 2006). Elemental (EC) and organic carbon (OC) are the products of imperfect combustion of organic materials (coal, oil, petrol, wood and biomass); sources of OC also include the resuspension of dust, which is related to transport, and biogenic particles (viruses, bacteria, pollen, fungal spores and all kinds of vegetation fragments; Schwarz et al. 2008). While EC is emitted into the atmosphere only directly (primary particles), OC can be formed by the reactions of gaseous organic precursors. In addition to designating carbonaceous aerosol particles as EC and OC, the term black carbon (BC) is also used. Black and elemental carbon basically designate the same component of the atmosphere. While EC contains only carbon, BC can contain both EC and organic admixtures (Chow et al. 2009; Husain et al. 2007; Petzold et al. 2013). The use of the correct terminology to designate elemental and black carbon depends on the concept of the nature of these substances. The term EC is defined by volatility properties, while black carbon (BC) is described by absorption properties across the spectrum of visible wavelengths (Seinfeld, Pandis 2006).
The large number of toxicological studies collected in the WHO document of 2012 are related to the negative effects of these particles on human health. These studies concur with the fact that BC can act as a carrier of a wide range of chemical substances that are toxic for the human organism (WHO 2012). Compared to OC, EC and (especially BC) passes more readily into the human body and aggravates heart and lung diseases (Na, Cocker 2005). Organic particles (including organic carbon), which can contain, amongst other things, polycyclic aromatic hydrocarbon (PAH) fractions, are studied for their carcinogenic and mutagenic effects (Seinfeld, Pandis 2006; Satsangi et al. 2012).
Regular EC/OC measurements in the Czech Republic (in the PM2.5 fraction) were commenced in February of 2009 at the Košetice background station. Sampling was suspended for technical reasons in March of 2015 and was renewed on 1 January 2016. The average total carbon (TC) concentration in 2009–2016 in the sampled PM2.5 fraction was 3.6 μg.m-3, of which EC constituted 0.5 μg.m-3 and OC 3.1 μg.m-3. In 2016, TC contributed an average of 28.9% to overall PM2.5 concentrations (of which 3.8% corresponded to EC and 25.1% to OC). The highest TC concentrations were measured in February and September. As EC is a direct product of imperfect combustion, the annual variations in its amounts reflect the heating season in that the highest average values of 0.42 and 0.39 μg.m-3 were measured in the winter and autumn. The decrease in OC values in the summer was not as marked as that for EC and OC concentrations va- ried around 1.7 μg.m-3. In this period, more secondary OC is formed due to increased vegetation activity and good radiation conditions (Fig. IV.1.28).
The BC concentrations have been measured at the Ústí nad Labem station since mid-2012 (Ultraschwarz 2014). Since 2017 the BC concentrations will be measured at the Lom station in the framework of the OdCom project. BC concentrations have also been measured since 2012 at the Křešín u Pacova station, operated by the Global Change Research Institute of the Czech Academy of Sciences. This station is located in the immediate vicinity of the Košetice Observatory and is part of the Košetice National Atmospheric Laboratory.
In 2016 the average BC concentration at the Ústí nad Labem station was 1.75 μg.m-3. The highest average monthly values were measured in January, November and December (2.7–4.1 μg.m-3) and the lowest average monthly concentration of 0.85 μg.m-3 was recorded in July. The BC concentration measured at the Křešín u Pacova station attained average values of 0.55 μg.m-3, where the highest average monthly value was measured in January (0.98 μg.m-3) and the lowest in June (0.31 μg.m-3).
In 2015 the average concentration of BC at the station in Ústí nad Labem was 1.95 μg.m-3. The greatest average monthly values were measured in February, November and December (varying between 2.5 μg.m-3 and 3.6 μg.m-3). The lowest average monthly con- centration of 0.82 μg.m-3 was recorded in July. Concentrations of BC detected at the station Křešín u Pacova reached average values of 0.59 μg.m-3. The greatest monthly average was recorded in February (0.90 μg.m-3) and the lowest in July (0.33 μg.m-3).
The annual variability in the BC concentrations and their dependence on combustion values is well characterised by the average daily concentrations in the individual months (Fig. IV.1.29). The station in Ústí nad Labem is characterized by two maxima, one in morning and one in evening. In the cold part of the year, these maxima have similar values while, in the warmer part of the year, the morning maximum is more pronounced. The variations in the daily BC concentrations measured at the background station Křešín u Pacova reflect more substantial changes related to heating. Outside of the heating season, the morning maximum caused by traffic is more pronounced, in contrast to the cooler part of the year, when the evening increase in the concentrations is predominantly related to local heating.
Based on the results of inventories in the Czech Republic in 2015, up to 69.4% of BC emissions were derived from the transport sector, particularly from combustion of fuel in compression-ignition engines. Of this, the following sectors contributed the most to total BC emissions: Agriculture, forestry, fishing: Off-road vehicles and other machinery (1A4cii) 26.6%, Road transport: Heavy duty vehicles and buses (1A3biii) 19.6% and Road transport: Passenger cars (1A3bi) 13.0%. Of stationary sources, the greatest BC emissions were produced in the sector of Residential: Stationary (1A4bi) contributing 28.8% of total emissions (Fig. IV.1.30). Developments in total BC emissions in the 2007–2015 period are characterised by a decreasing trend, caused particularly by measures in the transport sector (Fig. IV.1.31).
Tab. XIII.1 Stations with the highest numbers of exceedances of the 24-hour limit value of PM10
Tab. XIII.2 Stations with the highest values of annual average concentrations of PM10
Tab. XIII.3 Stations with the highest values of annual average concentrations of PM2.5
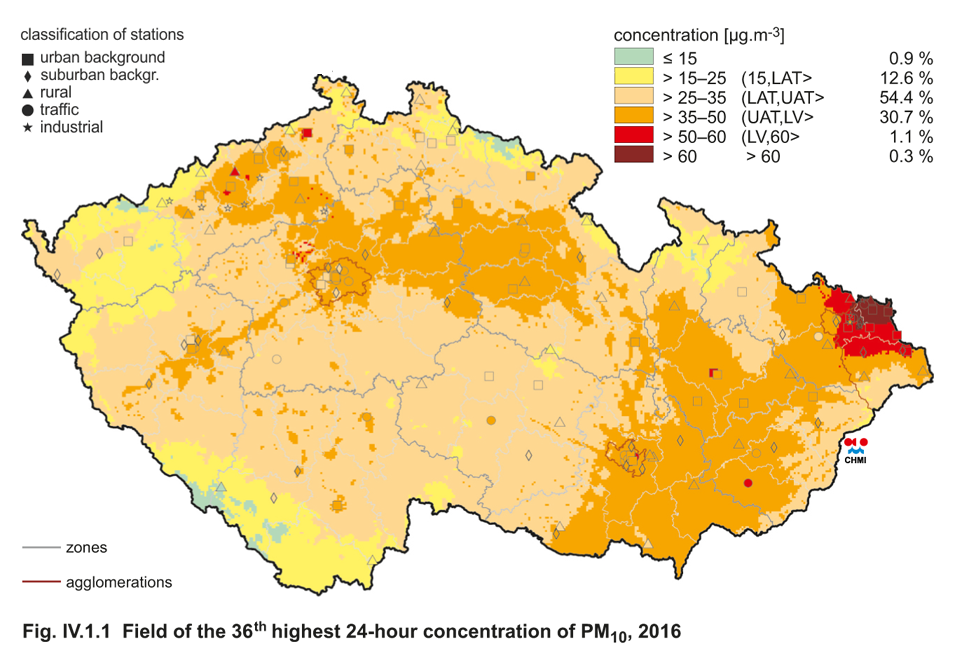
Fig. IV.1.1 Field of the 36th highest 24-hour concentration
of PM10, 2016
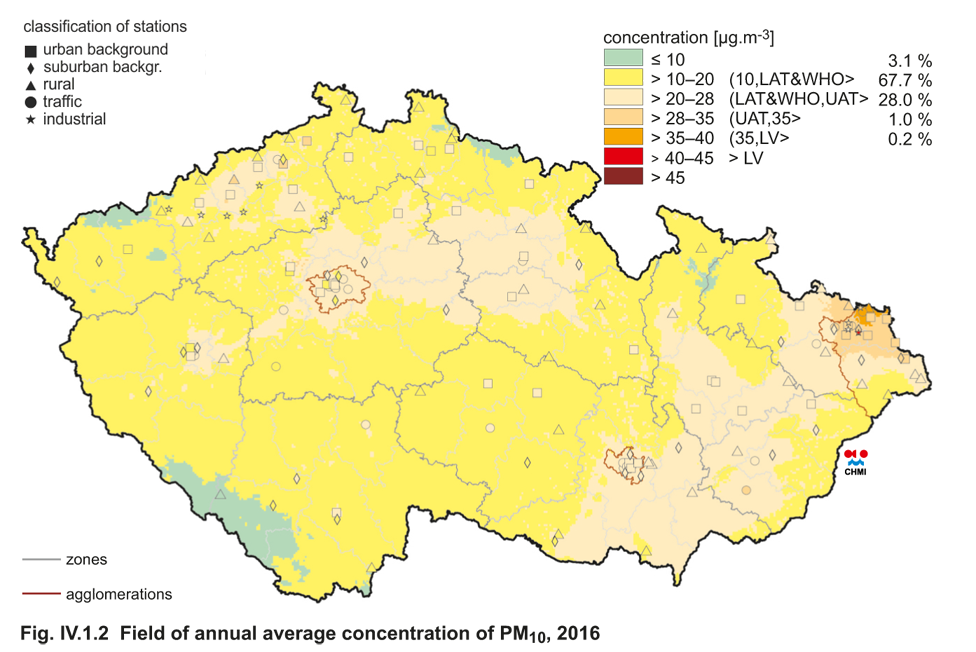
Fig. IV.1.2 Field of annual average concentration of PM10, 2016

Fig. IV.1.3 Numbers of exceedances of the limit value for 24-hour
concentration of PM10, 2016
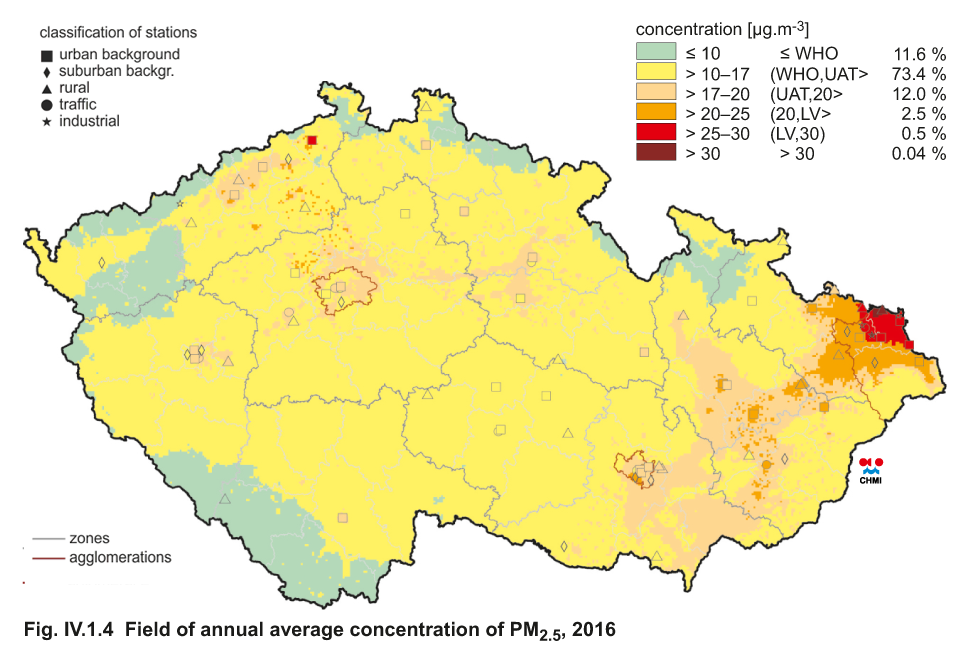
Fig. IV.1.4 Field of annual average concentration of PM2.5, 2016
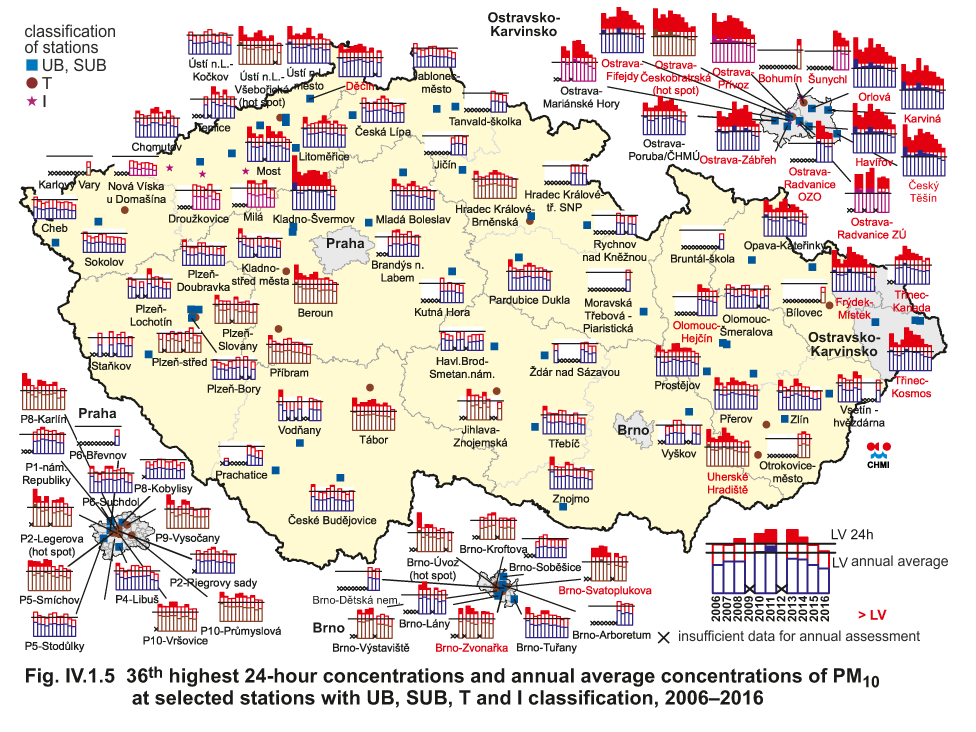
Fig. IV.1.5 36th highest 24-hour concentrations and annual
average concentrations of PM10 at selected stations with UB,
SUB, T and I classification, 2006–2016

Fig. IV.1.6 36th highest 24-hour concentrations and annual
average concentrations of PM10 at selected rural (R) stations,
2006–2016
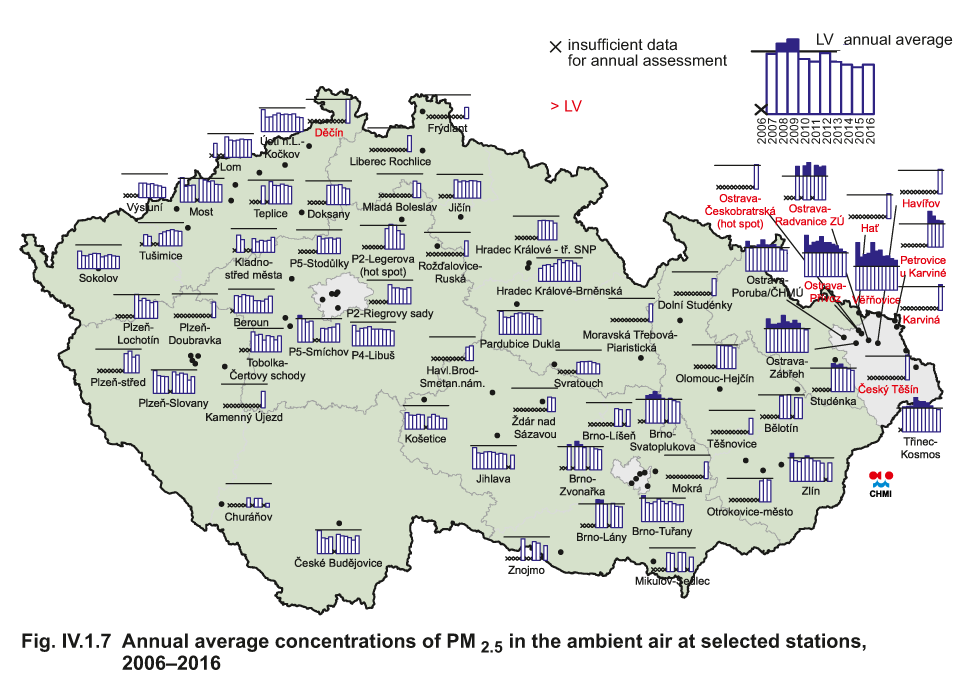
Fig. IV.1.7 Annual average concentrations of PM2.5 in the
ambient air at selected stations, 2006–2016
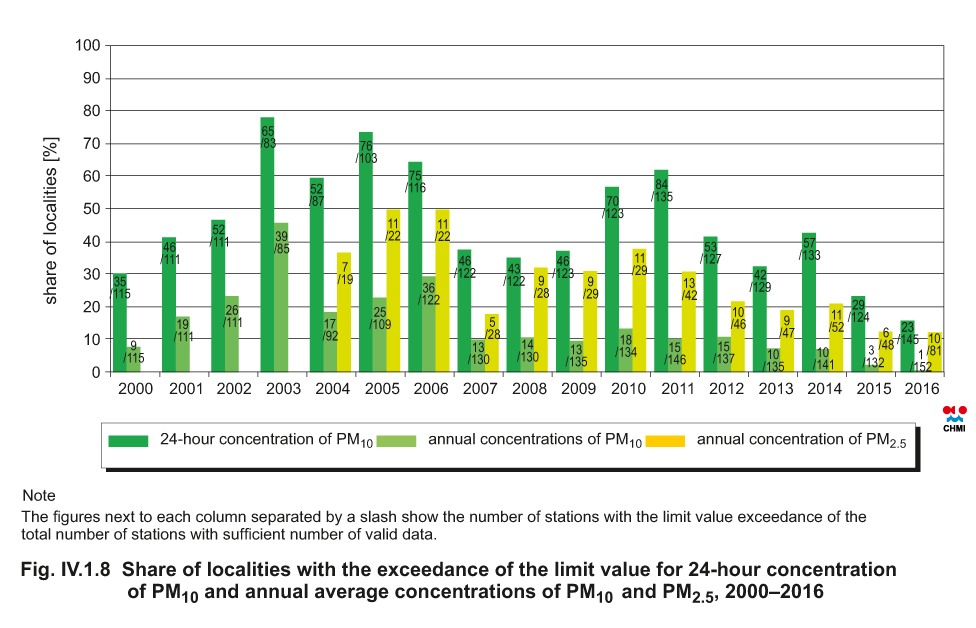
Fig. IV.1.8 Share of localities with the exceedance of the limit
value for 24-hour concentration of PM10 and annual average
concentrations of PM10 and PM2.5, 2000–2016
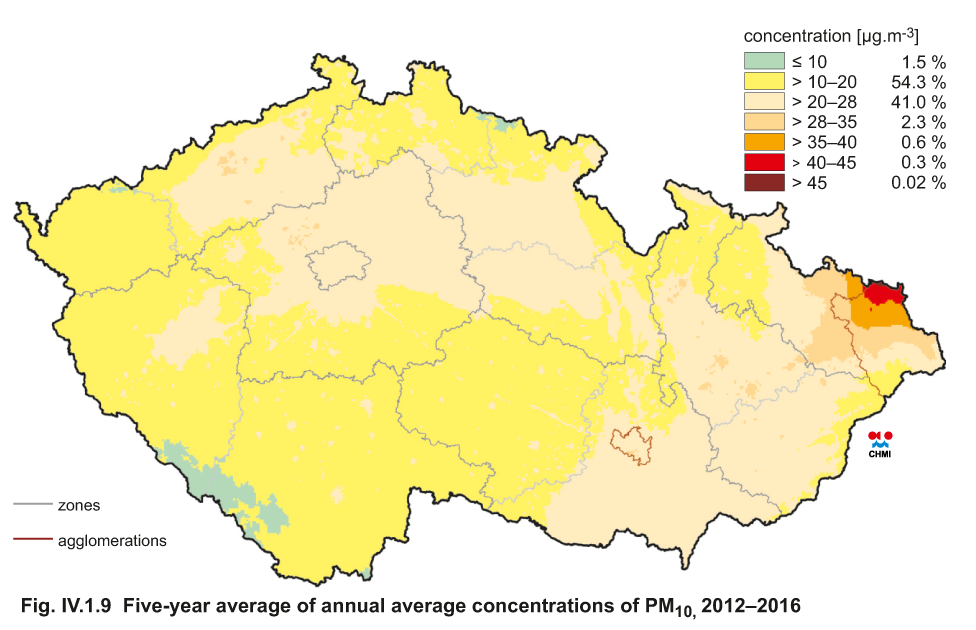
Fig. IV.1.9 Five-year average of annual average concentrations
of PM10, 2012–2016

Fig. IV.1.10 Five-year average of annual average concentrations
of PM2.5, 2012–2016
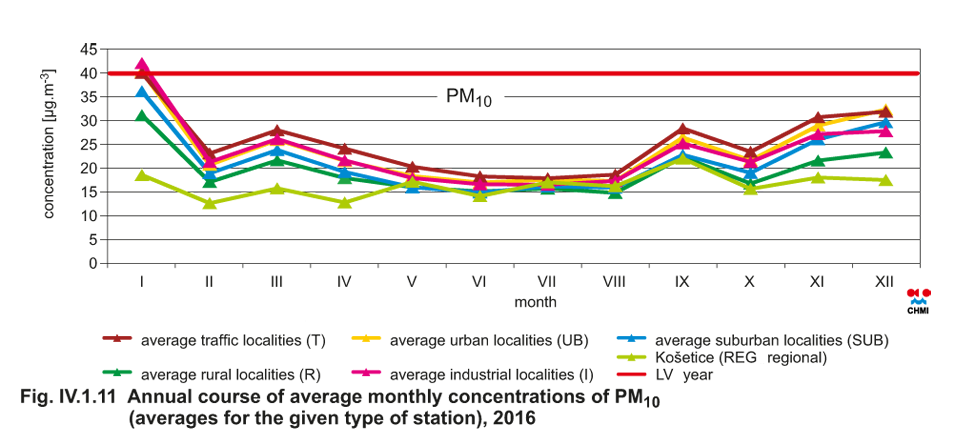
Fig. IV.1.11 Annual course of average monthly concentrations of
PM10 (averages for the given type of station), 2016
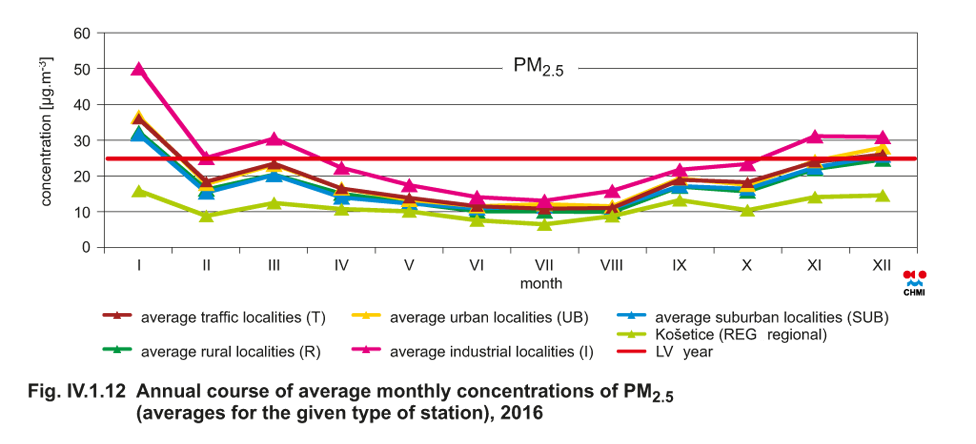
Fig. IV.1.12 Annual course of average monthly concentrations of
PM2.5 (averages for the given type of station), 2016
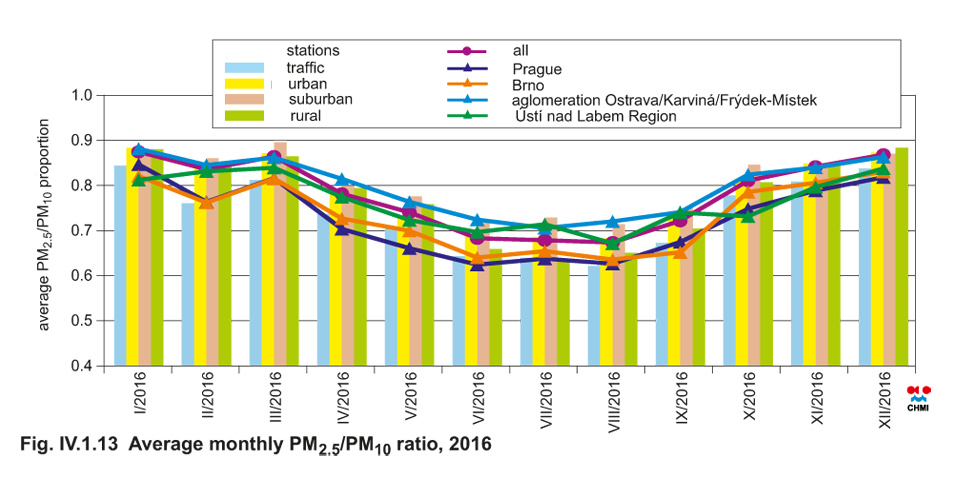
Fig. IV.1.13 Average monthly PM2.5/PM10 ratio, 2016
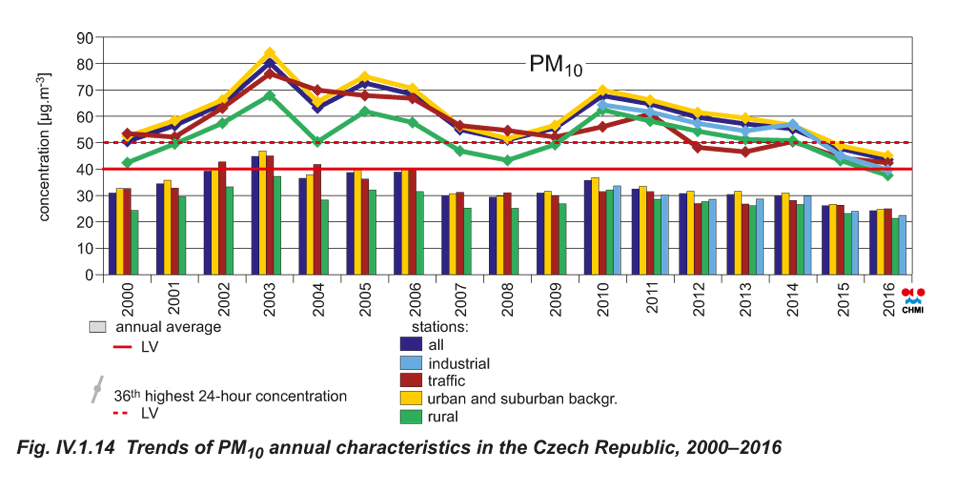
Fig. IV.1.14 Trends of PM10 annual characteristics in the Czech
Republic, 2000–2016
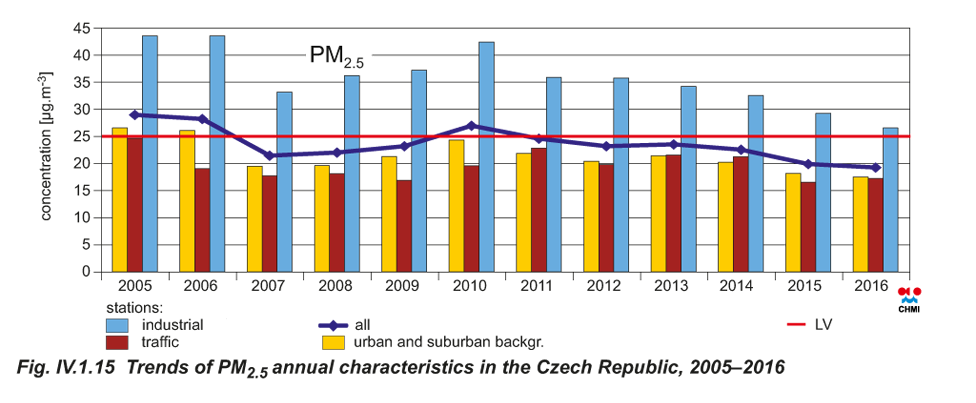
Fig. IV.1.15 Trends of PM2.5 annual characteristics in the Czech
Republic, 2005–2016
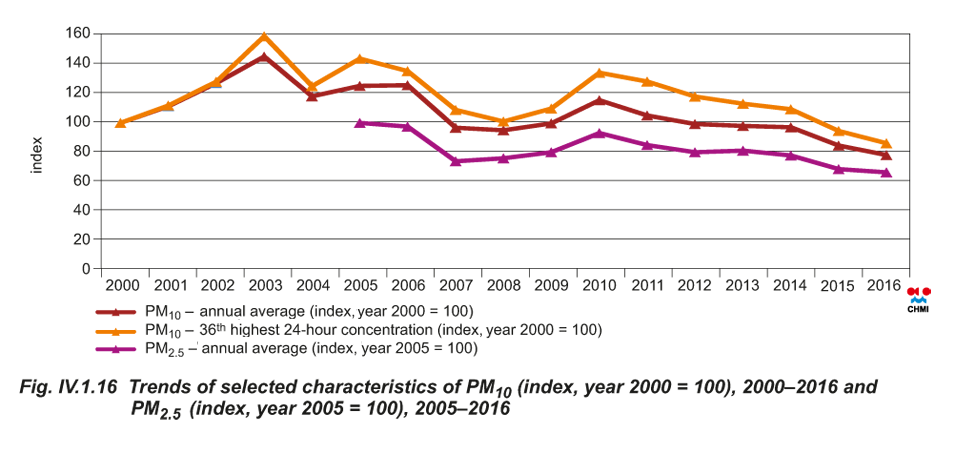
Fig. IV.1.16 Trends of selected characteristics of PM10 (index,
year 2000 = 100), 2000–2016 and PM2.5 (index, year 2005 = 100),
2005–2016
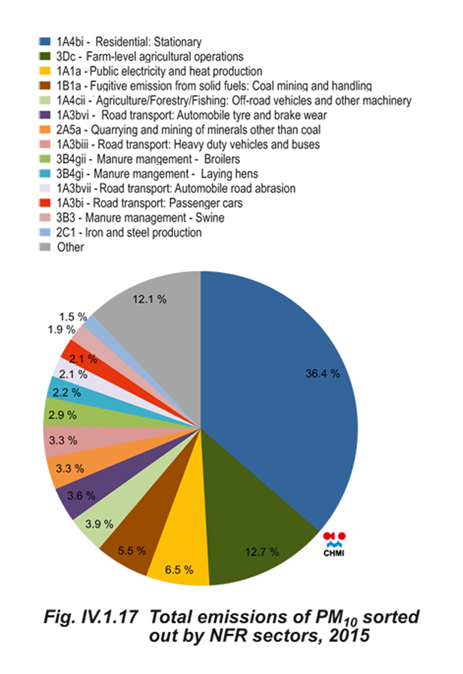
Fig. IV.1.17 Total emissions of PM10 sorted out by NFR sectors,
2015
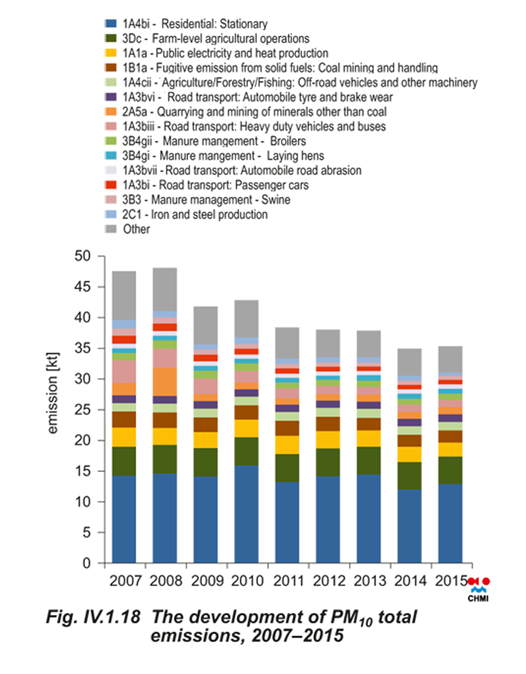
Fig. IV.1.18 The development of PM10 total emissions, 2007–2015
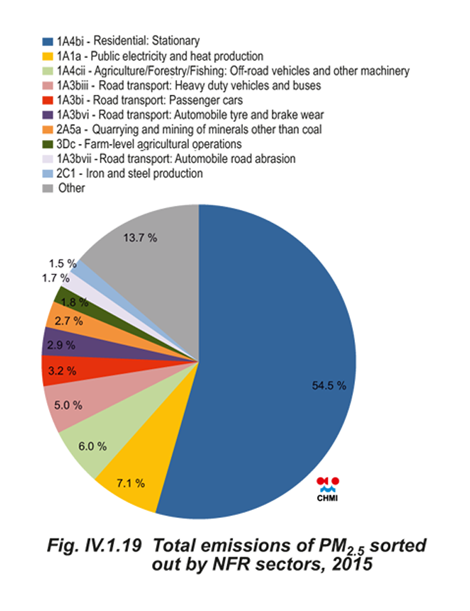
Fig. IV.1.19 Total emissions of PM2.5 sorted out by NFR sectors,
2015
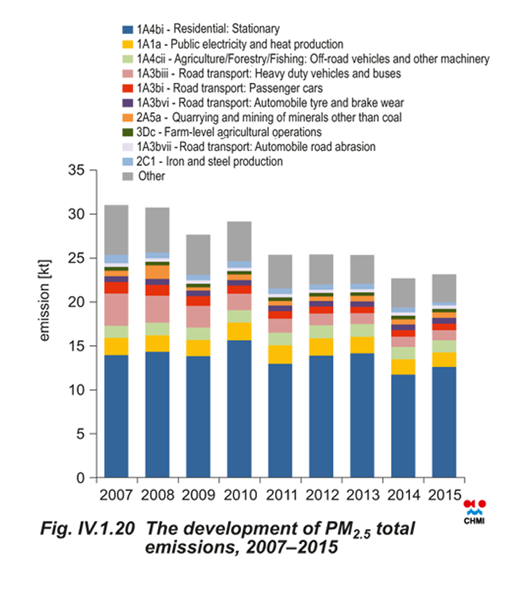
Fig. IV.1.20 The development of PM2.5 total emissions, 2007–2015
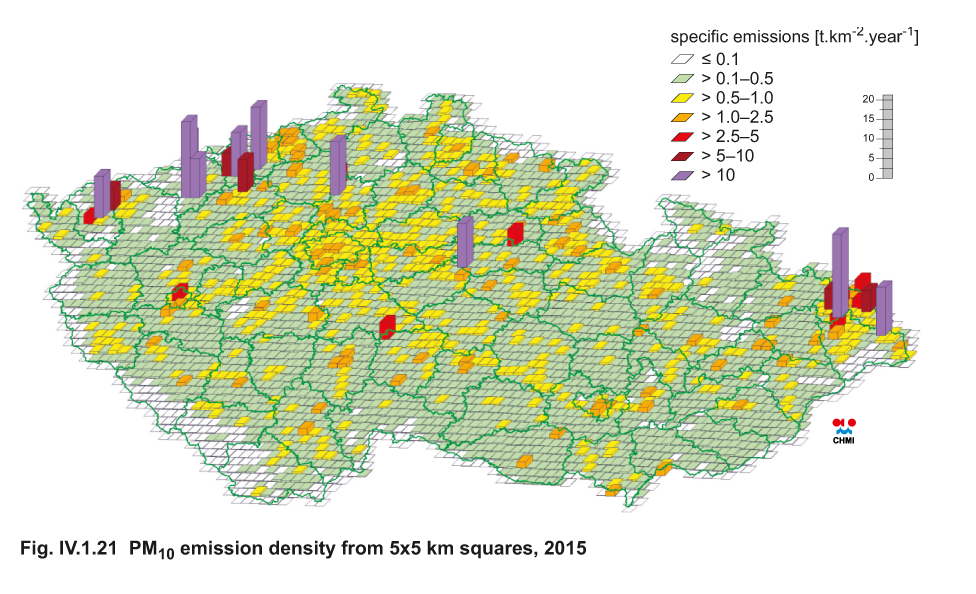
Fig. IV.1.21 PM10 emission density from 5x5 km squares, 2015
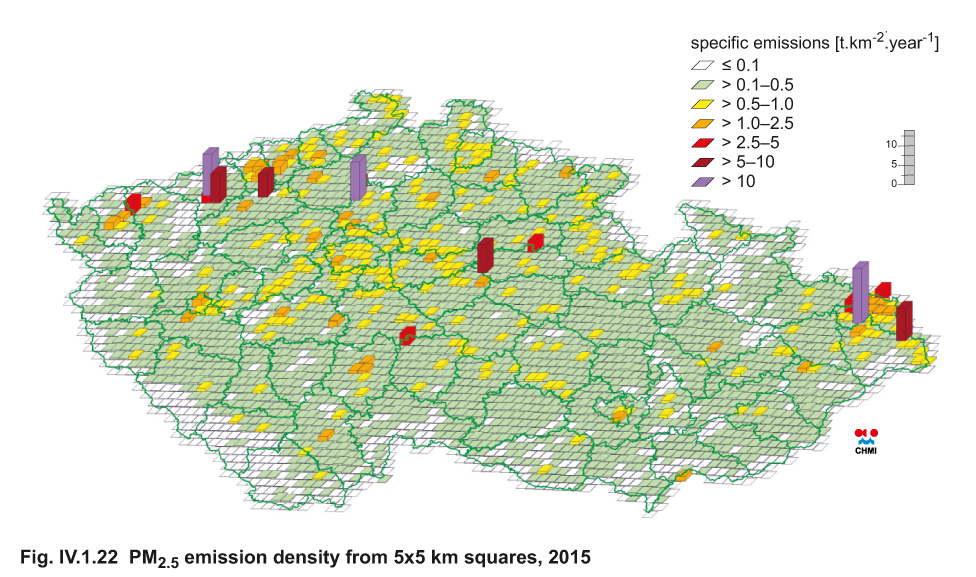
Fig. IV.1.22 PM2.5 emission density from 5x5 km squares, 2015

Fig. IV.1.23 Median spectrum of the daily progression of the number of particles, Košetice Observatory, 2015

Fig. IV.1.24 Median spectrum of the daily progression of the number of particles, Košetice Observatory, April 30, 2016

Fig. IV.1.25 Median spectrum of the daily progression of the number of particles, Ústí nad Labem-město, 2016
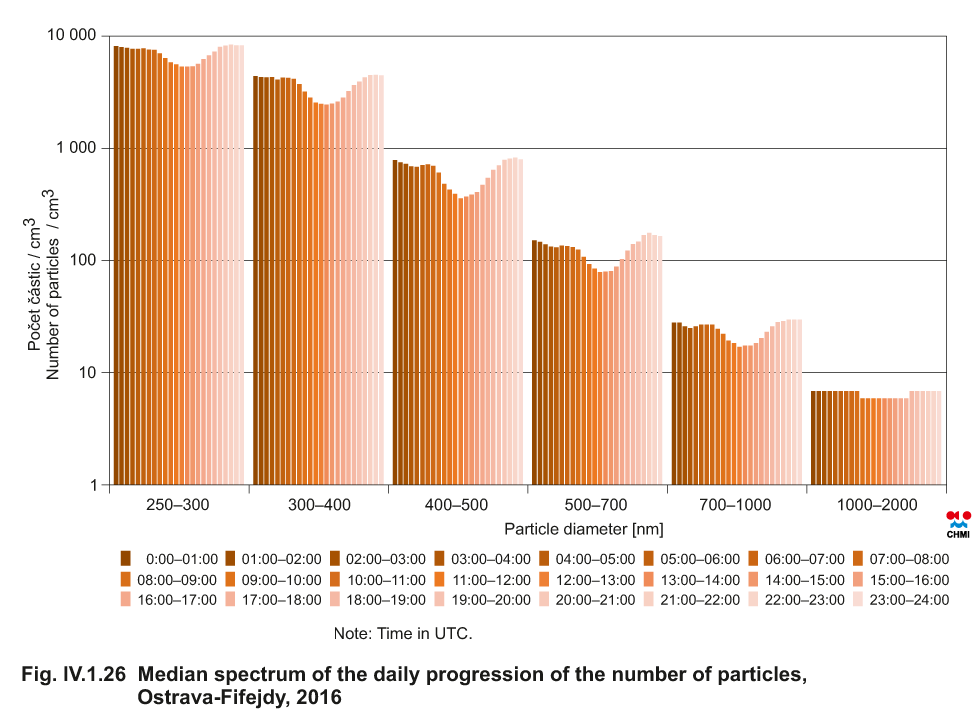
Fig. IV.1.26 Median spectrum of the daily progression of the number of particles, Ostrava-Fifejdy, 2016

Fig. IV.1.27 Median spectrum of the daily progression of the number of particles, Věřňovice, 2016
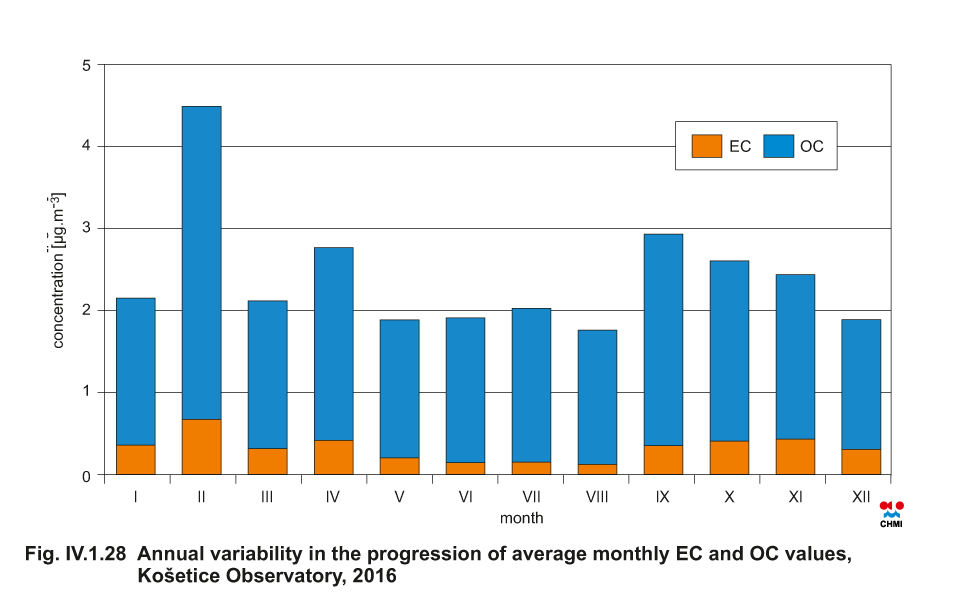
Fig. IV.1.28 Average monthly concentrations of EC and OC at the Košetice Observatory, 2016
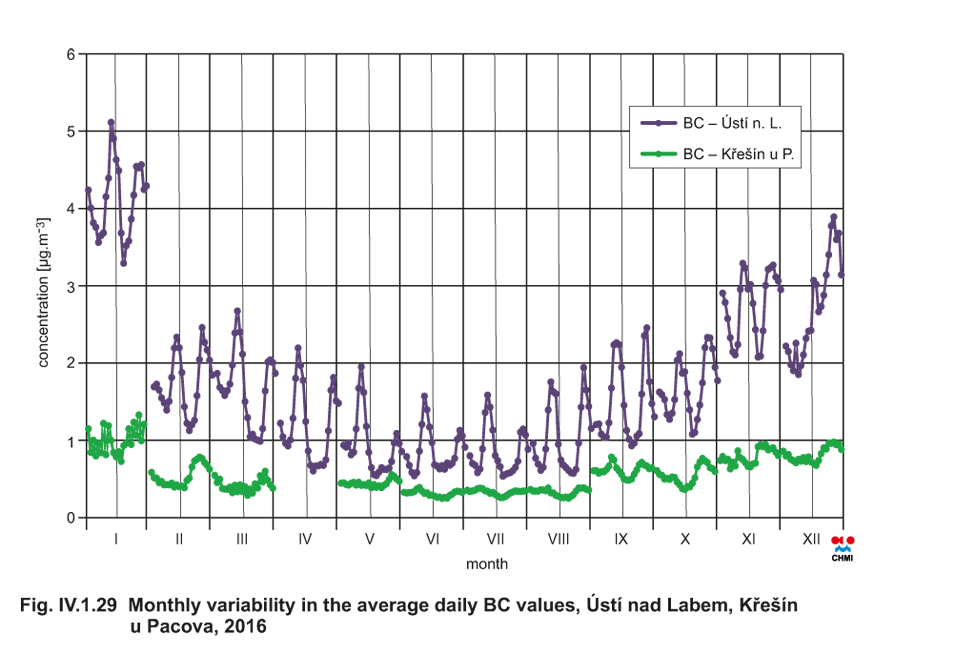
Fig. IV.1.29 Average monthly progressions of concentrations of BC at the stations Ústí nad Labem and Křešín u Pacova, 2016
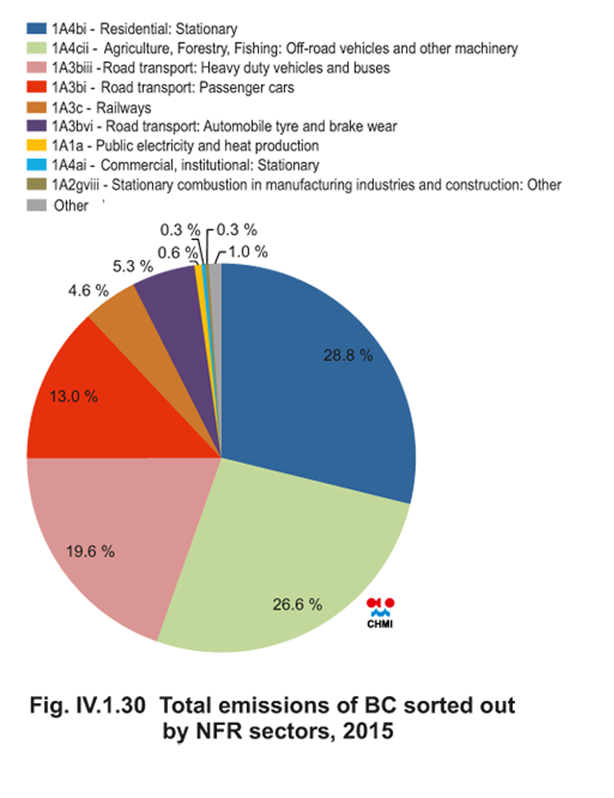
Fig. IV.1.30 Total emissions of BC sorted out by NFR sectors, 2015

Fig. IV.1.31 The development of BC total emissions, 2007–2015
1 Resuspended particles are particles previously settled on the Earth surface that are then lifted back into the air by wind or moving vehicles.
2 The author of this text wishes to thank Ing. Z. Wagner, CSc. (Institute of Chemical Processes CAS) for the processing of data from measurements taken by the SMPS spectrometer at Koše- tice, which have been used in the preparation of this subchapter.
3 Project ‘Air quality information system in the Polish-Czech border area in the Silesian and Moravian-Silesian region’, financed under the Operational Programme Cross-Border Cooperation Czech Republic-Poland 2007–2013; project registration number: CZ.3.22/1.2.00/09.01610.