III. METEOROLOGICAL AND DISPERSION CONDITIONS
In addition to the actual air pollution sources, air quality is also fundamentally affected by the meteorological conditions. These conditions determine the dispersion conditions and thus the pollutant concentration levels in the atmosphere; they also influence the amounts of emissions from anthropogenic and natural sources, and affect the formation of secondary pollutants as well as the rate of their removal from the air.
The effect of meteorological conditions
on emissions
Meteorological conditions have the greatest effect
on anthropogenic emissions from heating. Emissions
from heating are determined on the basis of
calculation of heating days and the temperatures
that occurred during these days. Long-distance heat
supply is regulated by Decree No. 194/2007 Coll.1 Households with their own combustion equipment
behave somewhat differently from central heat
suppliers. Consequently, for the purposes of this
yearbook, in contrast to the Decree, heating days
are considered to be days during which the average
daily temperature at the relevant site decreased
below 13 °C. Temperature conditions in the heating
season (January–May, September–December) or
parts thereof are characterised in terms of
degree days – i.e. the sum of differences between the
reference indoor temperature and the average daily outdoor
temperature on heating days:
where Dtref are degree days, tref is the reference indoor air temperature (21 °C) and td is the average daily temperature on individual heating days.
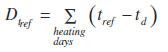
The degree days for the territory of the Czech Republic presented below (Figs. III.1 and III.2) correspond to average values from more than 200 climatological stations operated by the CHMI. A comparison of Fig. III.1 and Fig. II.4 reveals that higher consumption of fuels in 2010 corresponds to highly supernormal values whereas their lower consumption in 2015 corresponds to subnormal degree-day values.
Low temperatures may increase combustion emissions from motor vehicles, especially during cold starts (ATEM 2012, Chan et al. 2013, Vojtíšek 2013). Emissions of volatile organic compounds (VOC) from solvents and petrol storage and distribution are also dependent on temperature. Temperature and the photosynthetically active component of solar radiation influence biogenic emissions of non-methanic volatile organic compounds (e.g. isoprene and terpenes), which act as precursors of secondary organic aerosols and ground-level ozone. Emissions from forest vegetation are especially significant (e.g. Bednář et al. 2013, Zemánková et al. 2010). Wind (with a velocity approx. above 4 m.s-1) can cause the resuspension of settled dust particles. Meteorological conditions also influence the volatilization of persistent organic pollutants from soil, present mainly due to agricultural activities.
The effect of meteorology on dispersion conditions
Dispersion conditions are determined primarily by the stability of the boundary layer of the atmosphere and the velocity of flow in this layer. The boundary layer refers to the part of the atmosphere adjacent to the surface of the Earth in which, as a consequence of interactions with the surface of the Earth, mechanical and thermal turbulence is induced and leads to intense vertical transfer of mobility, temperature, water vapour and pollutants.
The greater the stability of the boundary layer, the less is the vertical mixing of the air. Simultaneously, the stability depends on the temperature changes with height. Under the most stable conditions, the air temperature increases with height (inverse layering) and the conditions for vertical mixing are the least favourable. In unstable layering, the temperature decreases with height more rapidly than would correspond to normal conditions in the atmosphere. This is then manifested in ordered thermal convection and thermal turbulence, whose actual causes lie in Archimedes forces valid in the field of turbulent air fluctuations (Bednář 2008). The wind speed and direction affect horizontal emission scattering. In addition, stronger wind leads to the development of mechanical turbulence and thus contributes to vertical mixing.
One way to quantify dispersion conditions is the so-called ventilation index (VI), which is defined as the height of the mixing layer multiplied by average wind velocity within it2. Under the conditions in the Czech Republic, the ventilation index expressed in this way reach hundreds to 30,000 m2.s-1. Values above 3,000 m2.s-1 indicate good dispersion conditions, values between 1,100 and 3,000 m2.s-1 indicate moderately poor dispersion conditions, and values below 1,100 m2.s-1 indicate poor dispersion conditions. Poor dispersion conditions do not necessarily mean the occurrence of high concentrations of pollutants. On the contrary, however, we can state that significant and extensive exceedances of limit values occur almost exclusively during moderately poor and poor dispersion conditions. The frequency of different dispersion conditions depends on the time of day and the part of the year. From the standpoint of long-term averages, it can be said that whereas in winter individual types of dispersion conditions tend to be distributed evenly during the day, in summer the frequency of unfavourable dispersion conditions is much lower during the day.
The effect of meteorological conditions on the
formation of secondary pollutants and the
chemism of the atmosphere
Meteorological conditions, especially the temperature, relative humidity of the air and solar radiation, directly affect the chemical and physical processes taking place among the pollutant substances in the air (e.g. Baek et al. 2004). Meteorological conditions can also have an indirect impact, e.g. intense mixing can lead to dilution of emitted substances and thus to a reduction in the rate of a reaction. Solar radiation is decisive during a photochemical reaction. In the summer, high temperatures and especially intense solar radiation contribute to high ozone concentrations (Blažek et al. 2013).
Removal of pollutants
Pollutants are removed from the atmosphere through dry and wet deposition. In wet deposition, the pollutants are washed out of the air onto the Earth’s surface by precipitation. Wet deposition can be classified as cloud deposition, occurring in clouds and encompassing dissolution of gaseous substances or their role as condensation nuclei, and sub-cloud, where the particles are captured and gaseous substances are dissolved by falling drops. The effectiveness of the washing-out depends on the duration of the precipitation, the type of precipitation and its intensity. Dry deposition includes all the other processes and, although its intensity is lower than that of wet deposition, over a longer time interval it can make the greatest contribution to removing substances from the air.
Meteorological conditions in 2016:
In 2016, temperatures were substantially above normal. The average annual temperature in the territory of the Czech Republic was 8.7 °C, which is 1.2 °C above the normal value for 1961–1990. 2016 was the seventh warmest year since 1961. Most months in 2016 had normal temperatures. The month of February had extremely above-normal tempera-tures and the months of July and August also had greatly above-normal temperatures. The greatest annual deviation from normal was recorded in February (+4.1 °C).
It follows from comparison of the degree-days in the individual months of the heating season that the production of emissions from heating were greater only in the months of April, October and November of 2016 compared to the long term average for 1986–2015. In January and December, the production of emissions from heating was identical and it was lower in the remaining months (Fig. III.2).
Precipitation in 2016 was normal. The average total annual precipitation on the territory of the Czech Republic was 635 mm, corresponding to 94% of the normal value for 1961–1990. The largest amount of precipitation fell in February (the average total precipitation equalled 161% of normal) and the smallest amount was recorded in August (53% of normal).
Fig. III.4 shows the proportions of the individual kinds of dispersion conditions in the months of 2016 for the Czech Republic and agglomerations. The zero occurrences of unfavourable conditions in February to November are caused by the method used for their evaluation, which was performed on the basis of daily averages of the ventilation index, which correspond better to the average daily concentrations. Compared to the nine-year average for 2007–2015 (tab. III.1), there was a substantial decrease in the occurrence of unfavourable dispersion conditions in January, October and November of 2016. From April to August, the occurrence of unfavourable dispersion conditions was mostly comparable with the eight-year average.
Fig. III.3 depicts the connection between the meteorological conditions and the pollutant concentrations for the O/K/F-M (Ostrava/Karviná /Frýdek-Místek) agglomeration. The annual variation in the ventilation index, temperature and above-limit PM10 and O3 values in the agglomeration or at stations are depicted and, for the purposes of illustration, can be considered to be representative for the area of the agglomeration.
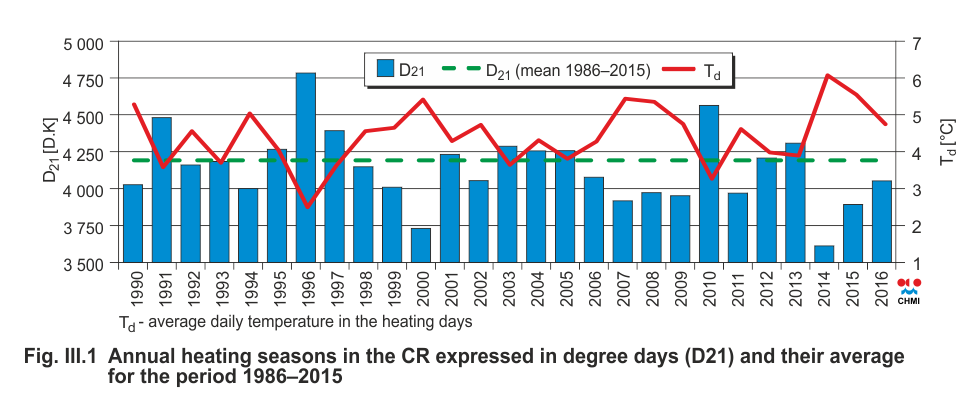
Fig. III.1 Annual heating seasons in the CR expressed in
degree days (D21) and their average for the period 1986–2015
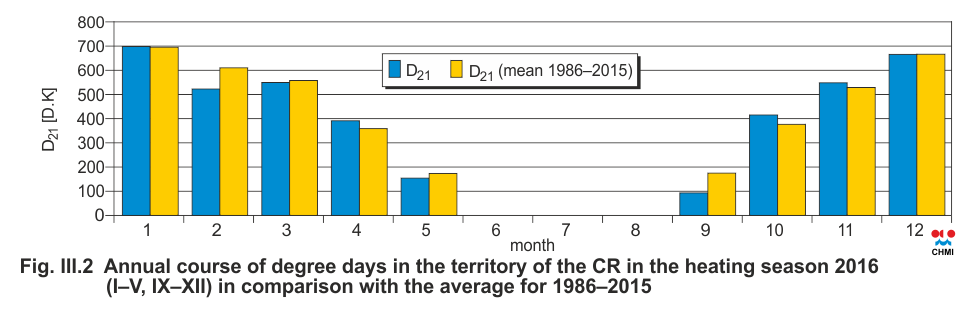
Fig. III.2 Annual course of degree days in the territory of
the CR in the heating season 2016 (I–V, IX–XII) in comparison
with the average for 1986–2015
Fig. III.3 Temperature, dispersion conditions, and
concentrations of PM10 and O3 in the agglomeration of
Ostrava/Karviná/Frýdek-Místek, 2016

Fig. III.4 Annual course of the occurrence of dispersion
conditions in the CR and agglomerations, 2016
1According
to Decree No. 194/2007 Coll., the supply of heat starts in the
heating season (i.e. the period from 1 September to 31 May) if
the average daily outdoor air temperature at the site decreases
below +13 °C for two consecutive days and is not expected to
rise above +13 °C on the next day. Heating in the heating season
is reduced or interrupted if the average daily outdoor air
temperature at the given site or locality rises above +13 °C for
two consecutive days and when the temperature is not expected to
decrease on the next day. At a subsequent decrease of the
average daily outdoor air temperature below +13 °C, the heating
is started again..
2In practice, for the purposes of this yearbook, the ventilation
index is calculated as the product of the thickness of the boundary
layer of the atmosphere and the average wind speed in it.