V.2 AGGLOMERATION OF BRNO
The agglomeration of Brno is located in the centre of the South Moravia region. It is identical with the administrative territory of the city of Brno. As concerns the assessment of ambient air quality, Brno is one of the three Czech agglomerations, and as such it is not included in the South-eastern zone (South Moravia region excluding Brno and the Vysočina region). The area of the agglomeration is 230.22 km2, and the number of its inhabitants is 377,028 (401,003 including foreigners; source: MV ČR data as of 1 January 2016, data of the CSO as of 1 January 2016).
In the last five years, limit values for the protection of human health have been exceeded in the Brno agglomeration, namely in the cases of suspended particles PM10 and PM2.5, benzo[a]pyrene, and in parts of the agglomeration with the heaviest traffic loads also in the case of NO2. The year 2015 was exceptional from the perspective of ambient limits because only a single limit was exceeded at a single station (Brno-Zvonařka, ambient limit for the daily concentration of PM10). The part of the agglomeration where the limit value for daily PM10 concentrations is exceed may range from units of per cent (2013–2015) to almost the entire territory of the agglomeration (2010). Similar variability exists in the case of the fraction of the territory where the limit value for benzo[a]pyrene is exceeded; however, due to the very small number of stations, the highest degree of uncertainty in defining this fraction may occur. As concerns average annual concentrations of PM10, not a single area where this limit value is exceeded has been delineated in the Brno agglomeration since the year 2007. The areas of the agglomeration exceeding the limit value for the average annual concentration of NO2 are constant in the long term (with differences on the order of several per cent) and are found near the busiest transport routes (Table V.2.1).
Traffic contributed the greatest share to increased concentrations of the above-mentioned pollutants in the Brno agglomeration. Multiple important traffic communications intersect there (the D1 and D2 motorways and the expressways R52 to Vienna and R43 to Svitavy). Due to the as yet unfinished bypass from the D1 motorway in the direction of Svitavy, large volumes of transit traffic pass through the city centre, further increasing the already high number of cars in Brno. The fluidity of transit traffic is not ensured because the outer ring road around Brno is not complete in the area of Pisárky and Židenice.
Air quality measurements were expanded in 2015 as part of an upgrade of the state ambient air quality monitoring network. Especially strengthened were measurements of PM2.5 at the localities Brno-Dětská nemocnice and Brno-Úvoz (traffic hotspot). Thanks to the switch from manual to automatic mode in measuring PM10 and PM2.5 at the localities Brno- Líšeň and Brno-Úvoz (traffic hotspot), it is now possible to view the immediate concentrations measured by these stations online at the CHMI portal. The upgrade of the state ambient air quality monitoring network is thus improving public awareness.
V.2.1 Ambient air quality in the agglomeration of Brno
Suspended particles PM10 and PM2.5
In 2015 the limit value for the average annual PM10 concentration was not exceeded at any locality in the territory of the Brno agglomeration. This ambient limit was last exceeded in the Brno agglomeration in 2010, specifically at the station Brno-Svatoplukova. The highest concentrations were, as usual, measured at localities with the highest traffic loads, namely Brno-Svatoplukova and Brno-Zvonařka (Fig. V.2.1). Compared to the year 2014, the average annual PM10 concentrations decreased at most localities. An increase in concentrations occurred at the localities Brno-Arboretum 2.4, in Brno-Soběšice by 1.3 μg.m-3 and Brno-Kroftova by more than 1.7 μg.m-3. The worst air pollution situation was confirmed at traffic stations, where, on average for the years 2010–2015, the concentrations were 5.4 μg.msup>-3 greater than at background localities (Fig. V.2.1). The situation at urban and suburban background stations was very similar to the situation at the regional rural background station Mikulov-Sedlec. In the years 2010–2015, the concentrations in urban and suburban background localities were on average greater by approximately 4.2 μg.msup>-3.
As concerns PM2.5 particles measured in the agglomeration of Brno, the ambient limit for the average annual concentration is exceeded in the long term only at localities with traffic loads (Fig. V.2.2). This ambient limit is not exceeded at background localities. In 2015 average annual concentrations of PM2.5 decreased compared to the year 2014 at all localities except Brno-Líšeň, where concentrations increased slightly, approximately to the level of 2013. None of the localities exceeded the ambient limit for the average annual concentration of PM2.5 in 2015, which was the first time since this ambient limit came into force.
In 2015 the limit value for 24-hour PM10 concentration was exceeded only the traffic locality Brno- Zvonařka (Fig. V.2.3). Although this is classified as a background locality, the degree to which it is affected by the D1 motorway is noticeable. Besides traffic, building activity also had a certain effect on the elevated concentrations at this locality (construction of a distribution substation for the future Southern centre accompanied by movements of heavy machinery) in the immediate vicinity of the station in the second half of the year. The background locality Brno-Tuřany exceeded the limit value in years with longer episodes of unfavourable dispersion conditions (2010–2011). The ambient limit was not exceeded a single time at the locality Brno-Soběšice in the period 2010–2015. The number of days with concentrations greater than 50 μg.m-3 decreased at all stations with the exception of the locality Brno-Arboretum. In some cases, the decrease is less significant. In the case of the locality Brno- Svatoplukova, for example, the number deceased from 62 to 32 days, in the case of the locality Brno- Lány from 51 to 33 days and in the case of the locality Brno-Úvoz (traffic hotspot) from 31 to 19 days. The locality Brno-Úvoz (traffic hotspot) was in 2014 significantly influenced by roadworks in the immediate vicinity of the station (see CHMI 2015). The situation in 2015 thus reverted to the level of 2013. The 36th highest 24-hour concentrations in the Brno agglomeration followed a similar decreasing trend at both traffic and background localities. At traffic localities in 2010–2015, they were on average 6.4 μg.m-3 greater than background concentrations, which are on average 6.7 μg.m-3 greater than values measured at the regional background station in Mikulov-Sedlec (Fig. V.2.3).
Generally, however, the concentration levels are highly dependent on meteorological/dispersion conditions during the winter season. The negative influence of unfavourable dispersion conditions in the winter period together with the heating season (residential heating) is reflected also in the distribution of days with PM10 concentrations higher than 50 μg.m-3; such days occur mainly in the cold part of the year. In 2015, the largest number of days with concentrations greater than 50 μg.m-3 was recorded in February and March. A larger number of such days also occurred in November. By contrast, dispersion conditions in January and December were good, and almost all of the localities detected a maximum of two days with concentrations greater than 50 μg.m-3. The only exceptions were the sta- tions Brno-Lány in January and Brno-Zvonařka in December. At the locality Brno-Lány, there was a possible interference with a local source (the highest concentrations were measured at wind speeds below 0.2 m.s-1, which occurred in 17 % of January at this locality). Under higher speeds of air flow, the greatest concentrations were measured during air flow from the north, northeast and east. In the case of the locality Brno-Zvonařka, the mentioned building activity in the close vicinity affected the concentrations measured in the second half of the year. The locality Brno-Soběšice recorded the lowest number of days with concentrations of PM10 greater than 50 μg.m-3 in the Brno agglomeration – a mere 2 μg.m-3 more than at the regional back- ground locality Mikulov-Sedlec. By contrast, the greatest number of days on which the PM10 concentration of 50 μg.m-3 was exceeded in the Brno agglomeration was for the reasons given above recorded by the station Brno-Zvonařka (Fig. V.2.4).
The development of concentrations since 1996 shows that there is almost no difference between the agglomeration of Brno and the agglomeration of Prague or the Northwest zone. As concerns average annual concentrations, the trends have almost identical course and very similar concentration levels, which is signified by supra-regional influence of meteorological conditions as well as a similar degree of influence. The Moravia-Silesia region is the only exception due to a different type of load. The trend of the 36th highest 24-hour PM10 concentration and the trend of the average annual PM2.5 concentration have similar courses. In both cases, concentrations in the agglomeration of Brno are higher than in the agglomeration of Prague, which can be caused firstly by generally higher background of concentrations of suspended particles in Moravia and also by a higher share of traffic stations in Brno.
Nitrogen dioxide
As in previous years in the Brno agglomeration, the limit value for the average annual NO2 concentration was exceeded, but only at localities with the heaviest traffic loads. By contrast, the limit value for 1-hour concentration of NO2 was not exceeded. In 2015 the limit value was not exceeded at any station that collected sufficient data for the calculation of an annual average concentration. At most traffic localities, the average annual concentration of NO2 increased. The sole exception is the locality Brno-Svatoplukova, where concentrations decreased slightly. By contrast, at background stations except the one in Brno-Lány, average annual concentrations of NO2 decreased. Milada Horáková street in the vicinity of the locality Brno-Dětská nemocnice was closed in 2014. In 2015 this road was already open, yet the concentration of NO2 at this locality decreased from 26.6 μg.m-3 to 24.8 μg.m-3. In the last years, background concentrations measured in the locality Brno-Tuřany reached levels below 20 μg.m-3, and in recent years a downward trend has been recorded. The average annual concentration in 2015 was 17.1 μg.m-3, which is almost the same value as in the year 2014 (Fig. V.2.5).
The long-term background concentrations measured in the locality Brno-Tuřany reach the levels around 20 µg.m-3, and in recent years a downward trend has been recorded; the average annual concentration in 2014 amounted to 17.2 µg.m-3 (Fig. V.2.7).
The trend of NO2 concentrations in the monitored period is relatively stable at all stations (except the already mentioned traffic hotspot locality Brno-Úvoz in the last year). Unlike in the case of suspended particles, the measured concentrations are not so much influenced by meteorological conditions; only the intensity of traffic in the vicinity of the station is especially significant. In this respect, however, nitrogen oxide (NO) is much more significant; never- theless, no limit value has been set for this pollutant.
Although in previous years at selected localities in the agglomeration of Brno the limit value for the average annual NO2 concentration is exceeded, the overall results for the agglomeration are very good; the average values are approximately the same as the average for the whole Czech Republic. The agglomeration of Brno has the best results in the long term compared to the remaining agglo- merations. As concerns 1-hour concentrations, a significant increase was recorded in certain years (2006, 2010). These are the years with a marked deterioration of ambient air quality in the cold part of the year due to unfavourable dispersion conditions (2006) or due to a very long heating season (2010). Still, the concentrations measured in the agglomeration of Brno are again the lowest in the long term.
Benzo[a]pyrene
Polycyclic aromatic hydrocarbons (PAH) are represented in legislation by benzo[a]pyrene, a carcinogenic substance formed during the combustion of solid and liquid fuels. In the territory of the Brno agglomeration, PAH are measured at two localities – in the city centre with traffic loads (Brno-Masná) and in a background residential area (Brno-Líšeň). The locality Kuchařovice serves as a background for the South Moravian region. The traffic locality Brno-Masná exceeded the limit value every year in the period 2010–2012, but concentrations of PAH at the locality Brno-Líšeň have not been exceeded so far. In 2013 and 2014, the concentration in the locality Brno-Masná decreased dramatically to the level representing 50 % of the concentration measured in the year 2012. The concentrations are lower than at the background locality Brno-Líšeň or at the rural background locality Kuchařovice. With regard to significant impacts of traffic in the centre of Brno and the concentration levels measured in previous years, the 2013 concentration is suspicious and cannot be considered reliable (Fig. V.2.6). Values of benzo[a]pyrene concentrations strongly differ between individual parts of the year. Whereas in summer they reach practically zero values, in winter they can reach maximum values of around 4 ng.m-3. This is caused by unfavourable meteorological and dispersion conditions and also by higher levels of the regional background. Residential heating is in operation practically only during the heating season and, at the same time, within the South Moravia region it is, after traffic, the second most important source of particles to which PAH are bound. The sector of residential heating increases spatial background concentrations in the whole region during the cold part of the year. Concentrations measured during the heating season in small settlements of the South Moravia region with local combustion heating can be substantially higher than in the Brno agglomeration, which has a central supply of heat from boiler stations using natural gas as fuel. The occurrence of this smog situation is also evidenced by measurements taken during an episode of deteriorated dispersion conditions at the beginning of November 2015, when the concentration of particulate matter as well as benzo[a]pyrene increased markedly (the Brno agglomeration announced a smog situation). While the concentration of benzo[a]pyrene in Líšeň reached the value of 2 ng.m-3 on 6 November 2015, in the village of Chudčice, with less than 1,000 inhabitants and no communal gas supply, the measured concentration was 18.4 ng.m-3. At the same time when concentrations spiked due to deteriorated dispersion conditions (3 and 6 November 2015), the station in Brno-Masná measured zero concentration of benzo[a]pyrene, which is highly unlikely considering the season and meteorological situation (Fig. V.2.7).
The long-term development of concentrations in the agglomeration of Brno, similarly as in the agglomeration of Prague or in the Northwest zone, shows levels close to the limit value. Generally, with regard to the long-term development in Brno, background localities record levels below the limit value; in the city centre, which is influenced by traffic, levels slightly exceeding the limit value are recorded.
Ground-level ozone
In 2015 the monitoring of ground-level ozone (O3) was carried out at four localities in the agglomeration of Brno. Background concentrations are measured at the stations Brno-Tuřany and Brno-Lány whereas urban background concentrations are measured at the new locality Brno-Dětská nemocnice. O3 is also measured in the traffic-burdened city centre at the Brno-Zvonařka station. For comparison, the regional background station in Mikulov-Sedlec was again included in the assessment. Ozone is a highly reactive molecule that readily reacts with most substances in the air. The highest concentrations of ground-level ozone are therefore measured in clean places with low concentrations of other pollutants. On the contrary, the most loaded (traffic) localities measure the lowest concentrations of ground-level ozone. Ozone reactivity is demonstrated also in concentra- tions measured as well as the numbers of excee- dances of the ambient limit for O3 in the territory of the Brno agglomeration. The regional background station Mikulov-Sedlec exceeds the ambient limit for O3 in the long term, on average for three years. Similar concentrations are measured also at the locality Brno-Tuřany. In 2014 this station did not even exceed the ambient limit, but in 2015, due to the very warm year, it again exceeded this value. The other background stations Brno-Lány and Brno-Dětská nemocnice have been measuring tropospherical ozone for only a short time; the values detected there do not reach those measured in Brno- Tuřany, but in 2015 there was a relatively significant increase in concentrations and the number of exceedances of the ambient limit. In the long term, the lowest concentrations are measured at the locality Brno-Zvonařka. Though even at this locality there was an apparent increase of concentrations in 2014 and 2015, the number of exceedances of the ambient limit is still lower than half of the number permitted by law (Fig. V.2.8).
The long-term development of ground-level ozone concentrations is dependent on meteorological conditions, particularly in summer periods when maximum concentrations are reached, and the agglomeration of Brno is no exception. Urban localities reach lower concentrations than rural localities, which is evident also at the localities discussed above. In spite of the fact that Brno-Tuřany is not a rural locality, the concentrations measured there are higher than in the city centre.
V.2.2 Emissions in the agglomeration of Brno
At present, approximately 600 individually registered plants – sources of ambient air pollution, included in the REZZO 1 and REZZO 2 database, exist in the territory of the Brno agglomeration. Only several dozen, however, contribute significantly to total emissions. These are primarily thermal energy sources (Teplárny Brno a. s.), the municipal waste incineration plant (SAKO Brno, a.s.) and a small number of plants of the formerly highly developed engineering sector (mainly foundries). According to the general census of 2011, central sources of heat energy prevail in the heating of households (about 54 % of flats), followed by and gas boiler stations and local gas boilers (altogether about 37 % of flats). Only in a small part of the housing stock, primarily in the city outskirts, coal, wood and coke are used for heating. Similarly, the majority of public sector buildings are connected to central sources of heat or have their own gas boiler rooms.
In the period from 2002 to 2013, the above-mentioned significant sources reduced all monitored emissions. As concerns TSP emissions, this decrease is connected with modernization and with the closure of some technological branches of production, primarily foundries (e.g. Slévárna Zetor or Šmeral, a. s.). According to the current data of the summary operational records, there is only one significant source of TSP emissions: Eligo, a. s., specialized in the production of dried milk products, followed by foundries (primarily the Královopolská foundry), where, in addition to the reported TSP emissions, we can expect also a certain share of hard to determine fugitive emissions.
As for SO2 emissions, the most significant share is contributed by the municipal waste incineration plant SAKO Brno, a. s. The marked decrease of emissions from heat supply sources results from the reduced combustion of high-sulphur fuel oils and the subsequent transition to burning natural gas as the only type of fuel.
The decrease of NOx emissions was reached, besides the gradual modernization of heat supply sources, also by the shutdown of the TEDOM unit in the company ERDING, a. s. Brno, which produced more than 200 t.year-1 of NOx until the year 2002.
V.2.3 Conclusion
As far as ambient air quality is concerned, the main problem of the Brno agglomeration is traffic. Due to the location of Brno, which makes it a motorway intersection with transit traffic passing through the city centre, this problem will probably not be solved in the near future. Similarly as in Prague, it will first be necessary to invest into the construction of bypasses to move traffic out of the city centre and thus displace and reduce pollution thanks to smoother traffic flow. Further traffic-shaping measures will have to follow. The situation outside the city centre is a little better. Limit values at background localities such as Brno-Líšeň, Brno-Soběšice or Brno-Tuřany are exceeded only in years with longer periods of unfavourable dispersion conditions. In recent years, however, no such exceedances occurred at any of these localities.
In the last five years, the agglomeration of Brno did not meet the limit values for suspended particles (both both PM10 and PM2.5), NO2 and benzo[a]pyrene. In 2015 the only exceeded ambient limit was that for the 24-hour concentration of PM10, and this was exceeded at only one station. All these pollutants are closely connected with traffic in this agglomeration.
Levels of other pollutants listed in the legislation comply with their limit values. In the cases of sulphur dioxide (both daily and hourly limit values), carbon monoxide, lead, arsenic, cadmium and nickel, long-term concentrations stay below the lower assessment threshold. Benzene concentrations fluctuate close to the lower assessment threshold.
V.2.4 Pollution roses for the Brno
agglomeration (locality Brno-Tuřany)
The pollution roses were created using data from the AIM station Brno-Tuřany and the professional meteorological station in Brno-Tuřany. The locality is situated on the Tuřany Terrace, on the premises of the Brno-Tuřany international airport. The locality is open from all directions and well ventilated. The most frequent wind directions are northwesterly, northeasterly and easterly; the least common are winds blowing from the southwest and south. Still air conditions lasted only 0.4 % of the time in the year 2015 (Fig. 7, Annex III).
In the case of suspended particles of the PM10 fraction, it is obvious that the highest concentrations are reached during air flow from easterly and northeasterly directions, respectively. Concentrations at the locality Brno-Tuřany are thus being more significantly influenced by sources outside Brno (Fig. 8, Annex III). Season-by-season analysis of the pollution roses shows that the most decisive season is winter (the heating season), during which the highest concentrations of PM are reached (Fig. 9, Annex III). The dominance of easterly and norheasterly winds during the heating season points to the influence of local combustion sources or long-distance transport, which during northeasterly winds influences a substantial part of Moravia. During northeasterly winds, pollution often gets transported from Poland and is shifted across the Moravia-Silesia region, through the Moravian Gate and then across central and south Moravia all the way to Austria. This situation is well documented, for example, by the progression of concentrations on 19 October 2015, when elevated concentrations of PM were detected at Moravian stations. The first affected was the locality Věřňovice on the border between the Czech Republic and Poland. This locality was later joined by the locality Český Těšín. Southeasterly air flow transported the pollution further south. Whereas concentrations in Věřňovice and Český Těšín were decreasing, pollution levels were rising almost identically in Studénka and Valašské Meziříčí, later followed by the localities Těšnovice and Zlín. This episode of elevated concentrations lasted for roughly four hours, after which they decreased and maximum detected values gradually decreased with distance. It is nevertheless still apparent that even at localities such as Těšnovice or Zlín, concentrations increased from the initial values of 20 and 40 μg.m-3, respectively, up to levels of around 100 μg.m-3 (Fig. 10, Annex III). On the contrary, the pollution rose shows that during the heating season the locality is hardly influenced by pollution spreading from the direction of Brno. Concentrations of PM are also significantly influenced neither by the D1 motorway, about 2 km far, nor by the landing area in the immediate vicinity of the locality.
Concentrations of NO2 at the locality Brno-Tuřany are low in the long term. The annual average varies under 20 μg.m-3 – that is, below half the ambient limit value. The pollution rose for NO2 indicates that higher concentrations are reached only during low wind speeds, at which this pollutant is not sufficiently dispersed. The weighted pollution rose then indicates that elevated concentrations are most contributed to by air flowing from the north-east and east under low wind speeds. Under wind speeds of over 5 m.s-1, however, concentrations are low in all directions (Fig. 11, Annex III). Season-by-season analysis of the pollution rose shows that under slow wind speeds concentrations of NO2 are elevated in all seasons. The vicinity of the international airport runway might also play a certain role. In autumn and winter months, however, elevated concentrations also occur during easterly and northeasterly air flow even during higher wind speeds. Concentrations during the heating season are therefore apparently also influenced by local combustion sources, being an important areal combustion source (Fig. 12, Annex III).
The locality Brno-Tuřany is a suburban background locality, where, unlike at stations in the centre of Brno, elevated concentrations of ground-level ozone, comparable to the regional background station in Mikulov-Sedlec, are reached. The pollution roses differ from previous ones for this locality in that maximum concentrations are reached during southerly and southeasterly air flows. This is tightly related to the meteorological situation, as warm air usually flows into the Czech Republic from the south and southeast, when the weather is sunny, that is, when conditions are suitable for the formation of ground-level ozone (Fig. 13, Annex III). Tropospheric ozone is produced by a series of photochemical reactions that require solar radiation of intensities that are usually accompanied by higher temperatures. This is very well illustrated by the following pollution rose, which is structured according to air temperature (Fig. 14, Annex III). Under temperatures lower than 25 °C, the conditions are not entirely suitable for the formation of ozone, so its concentrations are low. Elevated concentrations occur only during stronger southerly winds, which might indicate long-distance transport of this pollutant. At temperatures above 30 °C, by contrast, concentrations are practically always high, regardless on the direction of air flow. Between 25 and 30 °C, however, the direction of air flow is partly decisive and higher concentrations prevail during southerly and southeasterly winds, which correspond with sunny and warm weather. In this case, too, the station might be influenced by longdistance transport of O3 from more southerly positions, where concentrations are usually higher (see Chapter VIII.). Interestingly, if wind speeds are very low, concentrations of tropospheric ozone are always very low. This well corresponds with the pollution rose for NO2 (a precursor of tropospheric ozone), where concentrations are, conversely, higher under these conditions.
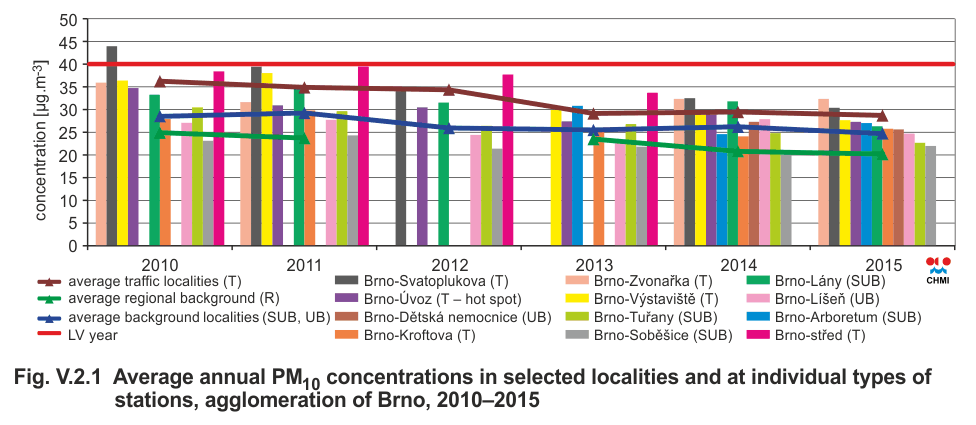
Fig. V.2.1 Average annual PM10 concentrations in selected
localities and at individual types of stations, Brno agglomeration, 2010–2015
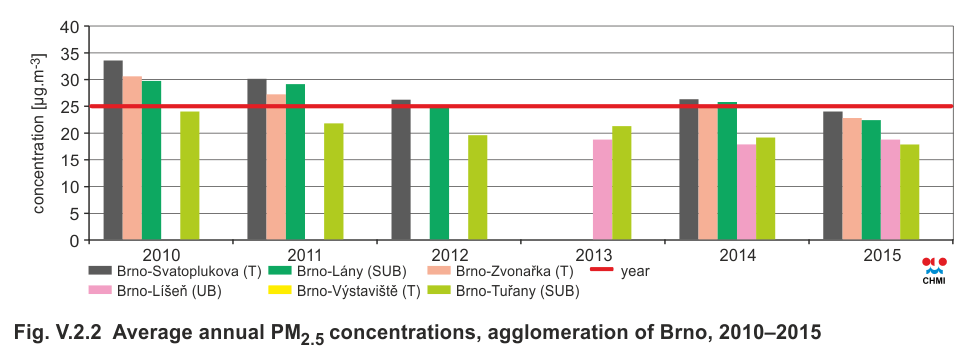
Fig. V.2.2 Average annual PM2.5 concentrations, Brno agglomeration, 2010–2015
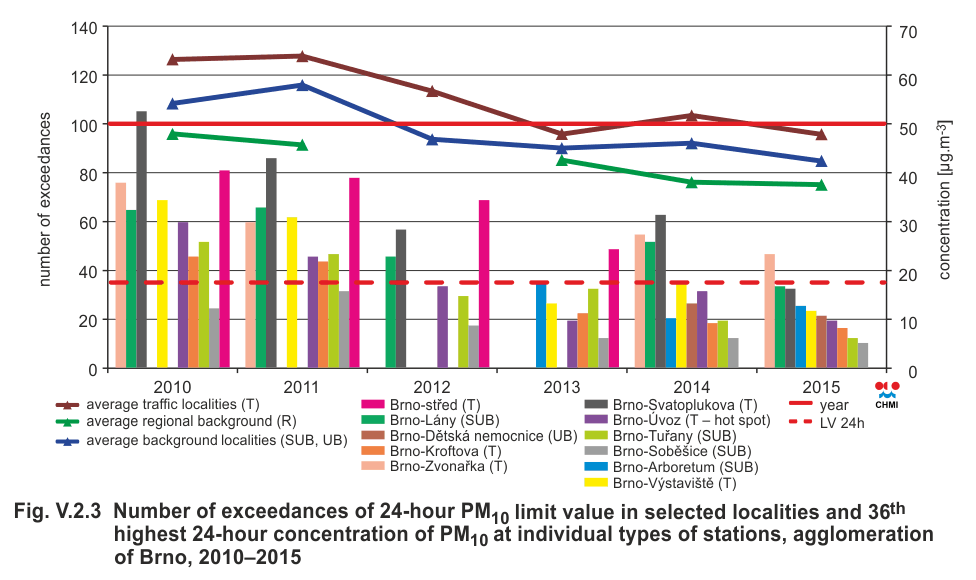
Fig. V.2.3 Number of exceedances of 24-hour PM10 limit value in
selected localities and 36th highest 24-hour concentration of
PM10 at individual types of stations, Brno agglomeration,
2010–2015
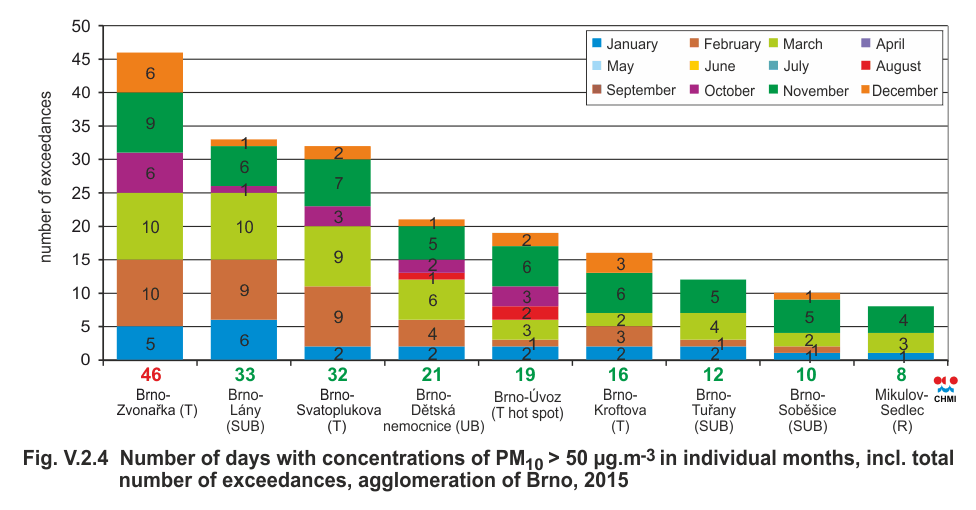
Fig. V.2.4 Number of days with concentrations of PM10 > 50
µg.m-3 in individual months, incl. total number of exceedances,
Brno agglomeration, 2015
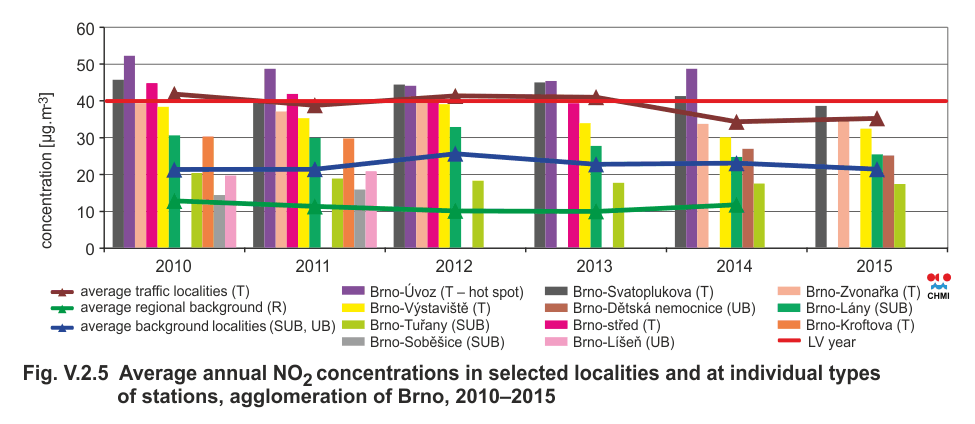
Fig. V.2.5 Average annual NO2 concentrations in selected
localities and at individual types of stations, Brno agglomeration, 2010–2015
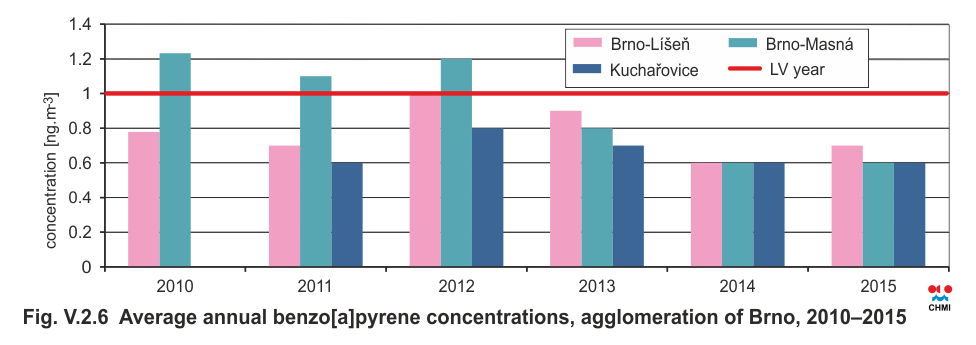
Fig. V.2.6 Average annual benzo[a]pyrene concentrations,
Brno agglomeration, 2010–2015
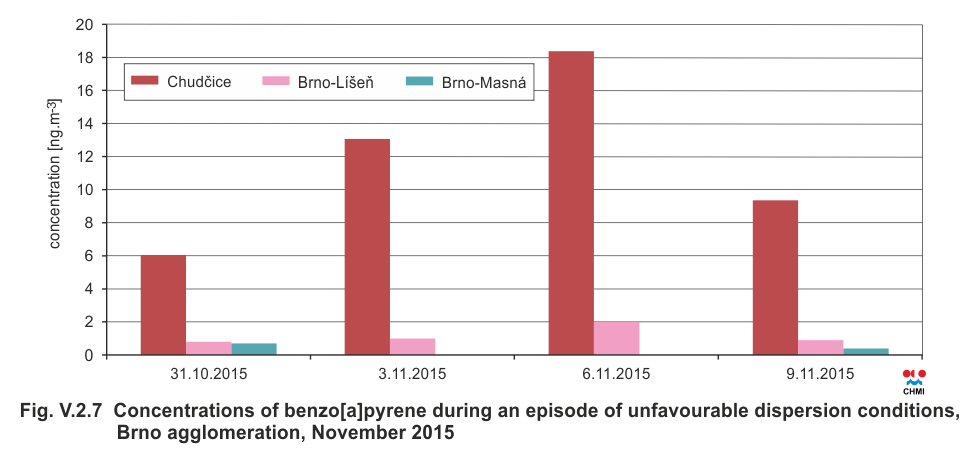
Fig. V.2.7 Concentrations of benzo[a]pyrene during an epizode of unfavourable dispersion conditions,
Brno agglomeration, November 2015
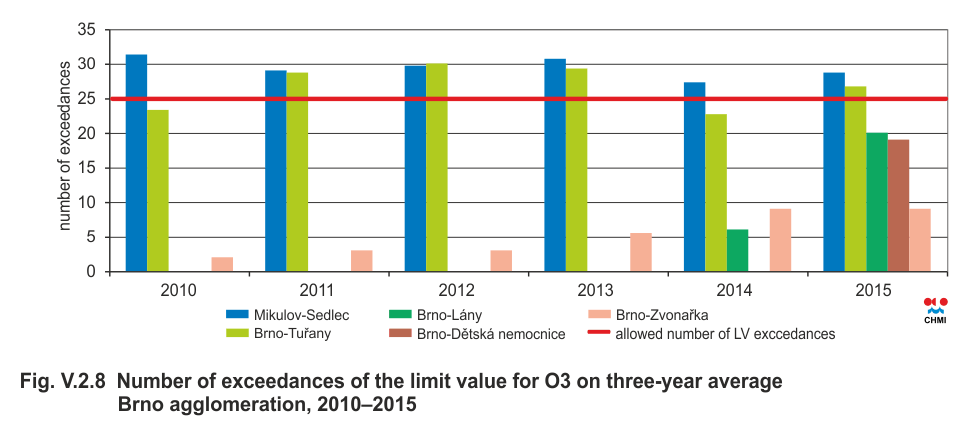
Fig. V.2.8 Number of exceedances of the limit value for O3 on three-year average,
Brno agglomeration, 2010–2015
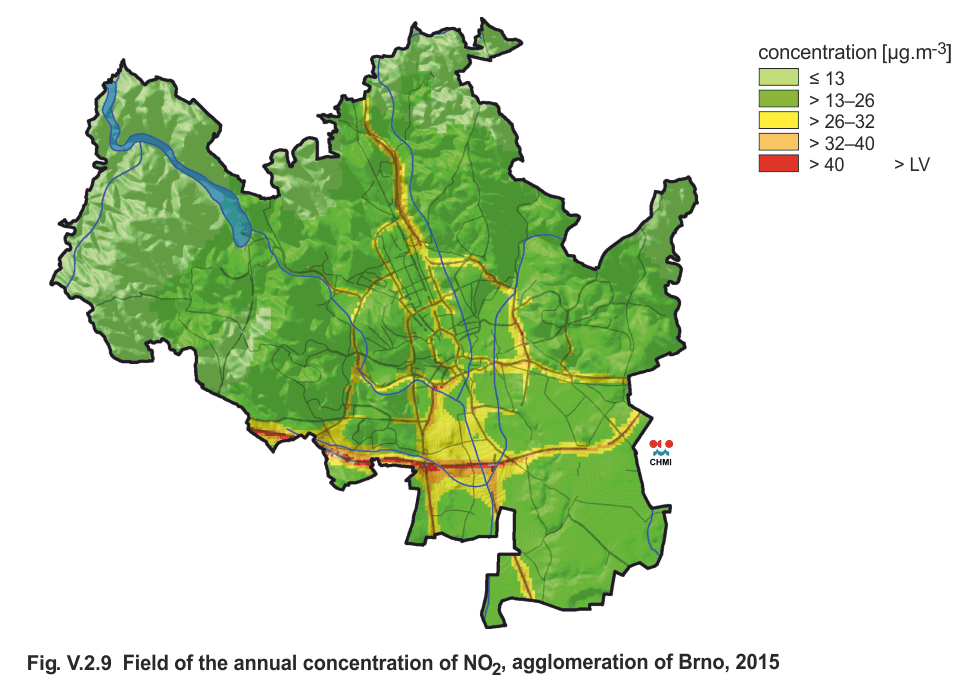
Fig. V.2.9 Field of the annual concentration of NO2,
Brno agglomeration, 2015
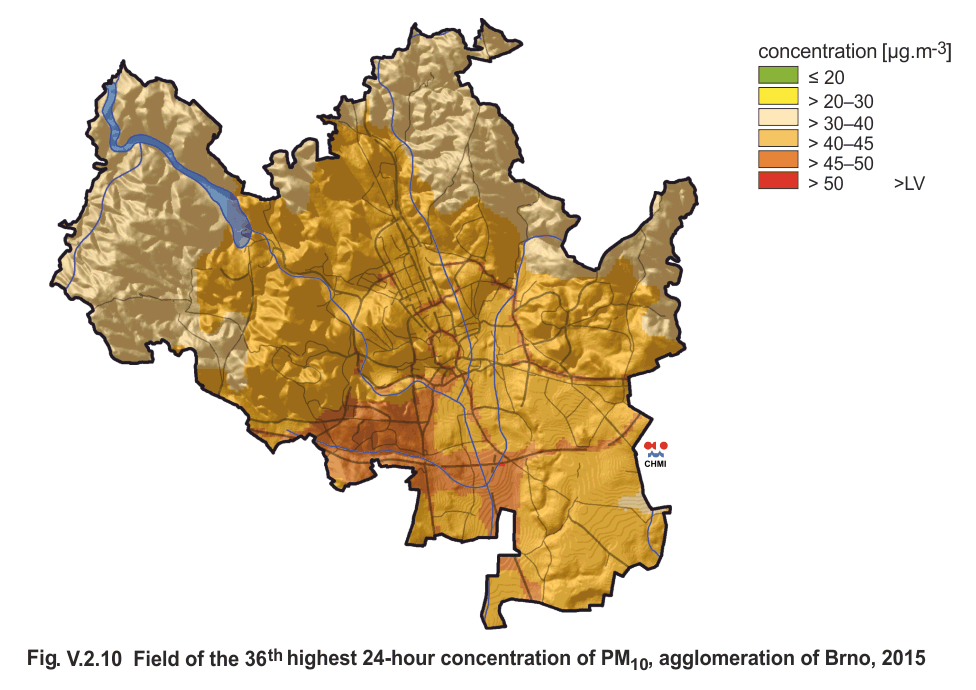
Fig. V.2.10 Field of the 36th highest 24-hour concentration of
PM10, Brno agglomeration, 2015