V.1 THE CAPITAL CITY OF PRAGUE
From the perspective of ambient air pollution, the capital city of Prague is ranked among the most burdened areas of the Czech Republic. This is the result of the interaction of a number of natural factors, particularly the high concentration of inhabitants and the dense transport network connected with it.
The unique setting of Prague in the broken terrain of the Prague basin significantly affects the climatic and dispersion conditions within its territory (Ložek et al. 2005). The Vltava river valley is usually poorly ventilated, and especially in the cold half of the year, there are favourable conditions for temperature inversions, when markedly warmer air gets shifted over cold air lying near the chilled ground. The heavy cold air remains close to the surface and thus prevents pollutants from dispersing into upper layers of the atmosphere. This results in increased pollutant concentrations in the breezeless ground-level layer of air (Bednář, Zikmunda 1985).
The deteriorated ambient air quality in Prague is connected mainly with significant traffic loads. Prague, because of its geographical position, is not only the main junction of the Czech road network, but also a significant crossroads of international transit transport. Multiple main routes lead directly through the centre of Prague. The current communication network in the inner city, however, is unable to accommodate such a huge concentration of traffic, leading to frequent gridlocks. The situation is expected to be partly solved primarily by the completion of the city’s inner and outer ring roads, by a considerable reduction of private cars in the most affected areas, and emphasis on the railway and city public transport (IPR Praha 2012).
For historical reasons, Prague also has a developed industrial infrastructure (IPR Praha 2012). In spite of the fact that numerous industrial plants that were not complying with the conditions of their operation have recently been closed down or had to reduce production, there is a growing focus on the sector of services. Consequently, new commercial and administrative centres have been built, placing high demands on transport services and the consumption of energy, including for heating.
The consumption of fossil fuels for household heating in family houses, mainly in the city’s outskirts, also has a considerable impact on the current air pollution situation in Prague.
V.1.1 Air quality in the agglomeration of Prague
Suspended particles PM10 and PM2.5
In 2015 the limit value for the average 24-hour concentration of PM10 (the value of 50 μg.m-3 must not be exceeded more than 35 times in one year) was not exceeded in the territory of the Prague agglomeration at any of the 14 localities with sufficient data permitting the assessment. The greatest number of limit value exceedances was reached at the monitoring station Prague 10-Vršovice (32 times). This locality is classified as a traffic locality. Although the year 2014 interrupted the decreasing trend in average 24-hour concentrations calculated separately for traffic and background stations, this trend reappeared in 2015 (Fig. V.1.1). The relatively steep decline of average 24-hour concentrations of PM10 in 2015 was influenced by favourable meteorological and dispersion conditions (Chapter III.).
In 2015, similarly as in the previous years, the annual PM10 limit value (40 μg.m-3) was not exceeded at any locality of 14 localities relevant to the evaluation of annual concentrations.
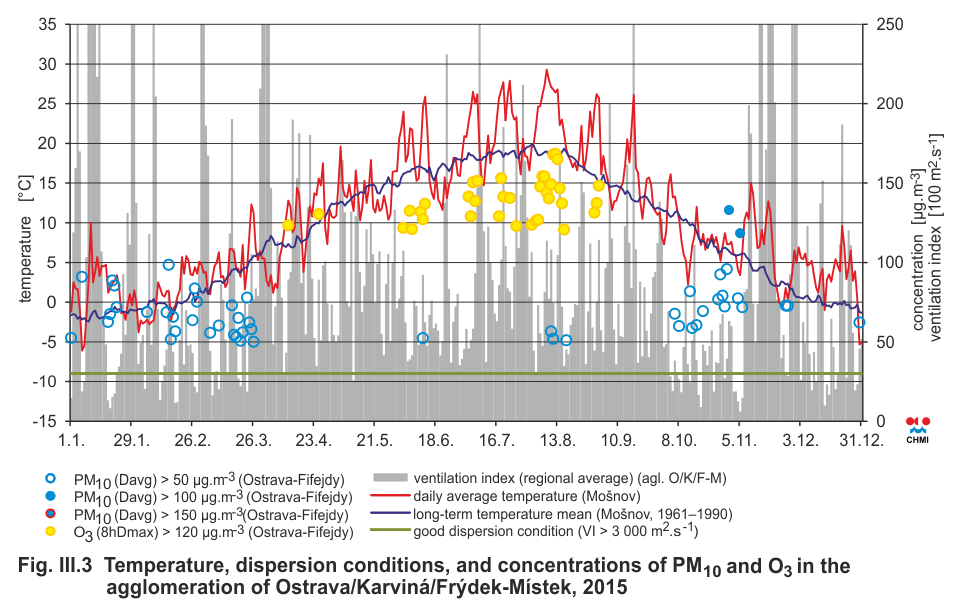
As a rule, high concentrations of suspended PM10 and PM2.5 particles and the most frequent exceedances of the 24-hour limit value for PM10 are reached in the cold period of the year due to higher emissions of TSP, caused both by higher intensity of heating (including local heating) and higher emissions from traffic (increased abrasion of the road surface caused by road gritting and subsequent resuspension of the abraded material; EC 2011) as well as due to less favourable meteorological conditions for the dispersion of pollutants. In 2015 the Prague agglomeration experienced the greatest number of exceedances of the 24-hour limit value (not more than 35 times) in the months of February, November, October and March (Fig. V.1.2). In these months, more frequent occurrences of unfavourable dispersion conditions were observed compared to the distribution of pollen dispersal conditions in other months (Fig. III.3).
The limit value for average annual concentrations of suspended PM2.5 particles was not exceeded in 2015 at any of the four stations with sufficient numbers of data points (Fig. V.1.3). The greatest concentration (19.9 μg.m-3) was measured at the station Prague 2-Legerova, which is classified as a traffic station (traffic hot spot).
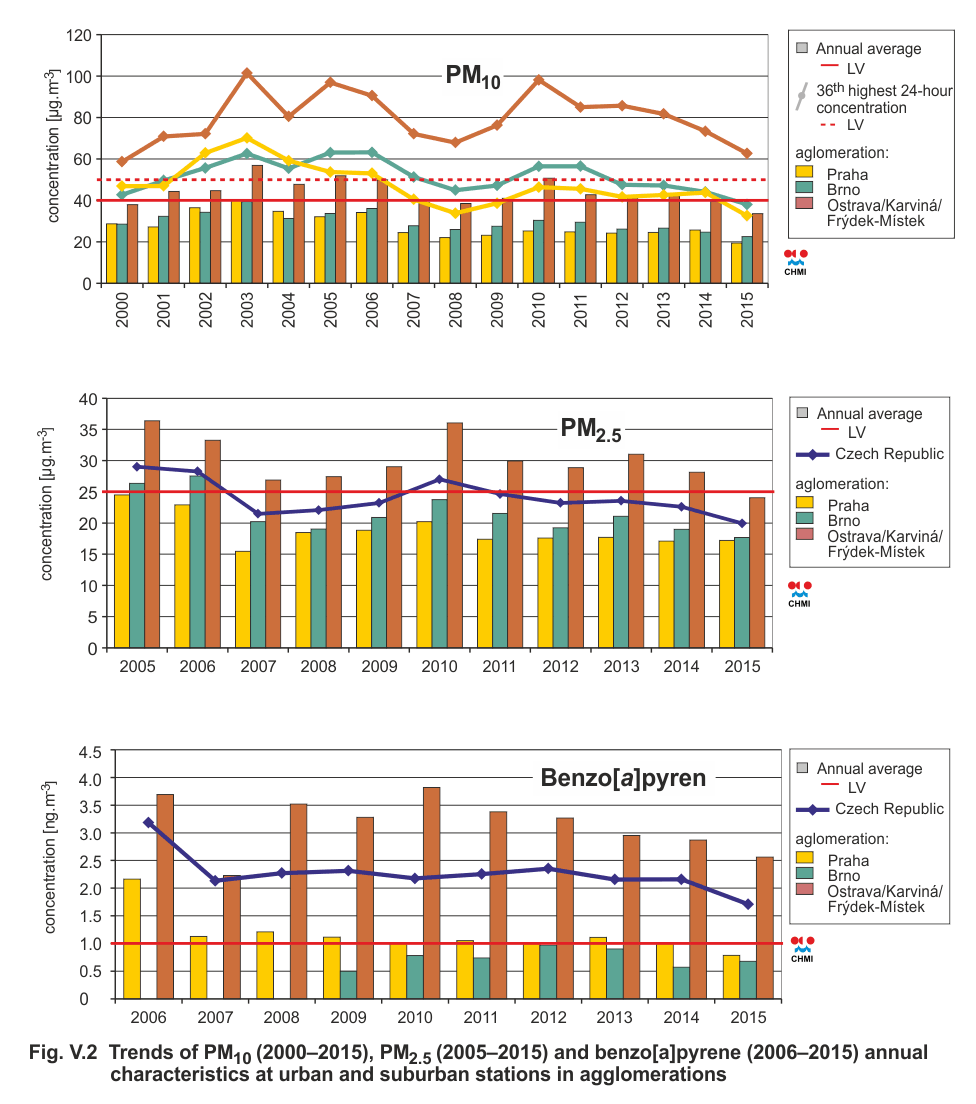
The trend of air pollution characteristics for PM10 is evaluated on the basis of data from stations for which there exists a complete time series starting with the year 2000 (Fig. V.2). A steep drop of PM10 concentrations was recorded between 1996 and 1999 (e.g. ČHMÚ 2014b). After 1999 the concentrations again increased, and in 2003 up until then maximum levels are reached due to unfavourable dispersion conditions in February and December and due to subnormal precipitation amounts. Since the year 2003 the overall trend of air pollution was decreasing; nevertheless, there were fluctuations in individual years, mainly due to meteorological and dispersion conditions. Higher PM10 concentrations were measured, for instance, in the years 2006, 2010 and 2011. In the years 2012–2014, the 36th highest daily concentration of PM10 did not exhibit any marked trend. In 2015 there was an apparent decrease of the 36th highest daily concentration as well as the annual average concentration of PM10. The average annual PM10 concentration remained below the level of the respective limit value starting from the year 2004. However, the 36th highest daily concentration of PM10 stayed below its limit since and including 2007; in some years, such as 2010 and 2011, it nevertheless approached this daily limit value.
The trend of pollution characteristics for PM2.5 is assessed based on data from stations for which there exists a complete time series since the year 2005; the annual average concentration reached its highest values in 2005, 2006 and 2010; in the years 2005 and 2006, the annual concentration (averaged across all stations) exceeded the pollution limit value. Between 2011 and the end of 2015, the trend in annual PM2.5 concentrations was stable.
Nitrogen dioxide
The hourly limit of 200 μg.m-3 was not exceeded in 2015 at any of the 12 localities of those which are relevant for the assessment. At the locality Prague 2-Legerova, the pollution limit was exceeded sixteen times. The permissible number of exceedances is 18. The hourly limit value for NO2 (200 μg.m-3) was thus not exceeded at any of these localities in 2015.
As regards exceedances of the limit value in Prague, the most problematic is the aforementioned traffic station Prague 2-Legerova (traffic hotspot) where NO2 has been measured since 2003. This station focuses on monitoring air pollution caused by traffic. The hourly limit value was not exceeded at this locality since 2012 (Fig. V.1.4).
The annual limit value for NO2 (40 μg.m-3) was exceeded at two out of the 12 localities in the territory of the Prague agglomeration. These localities were Prague 2-Legerova (the annual average concentration reached the value of 47.1 μg.m-3) and Prague 5-Smíchov (41.6 μg.m-3).
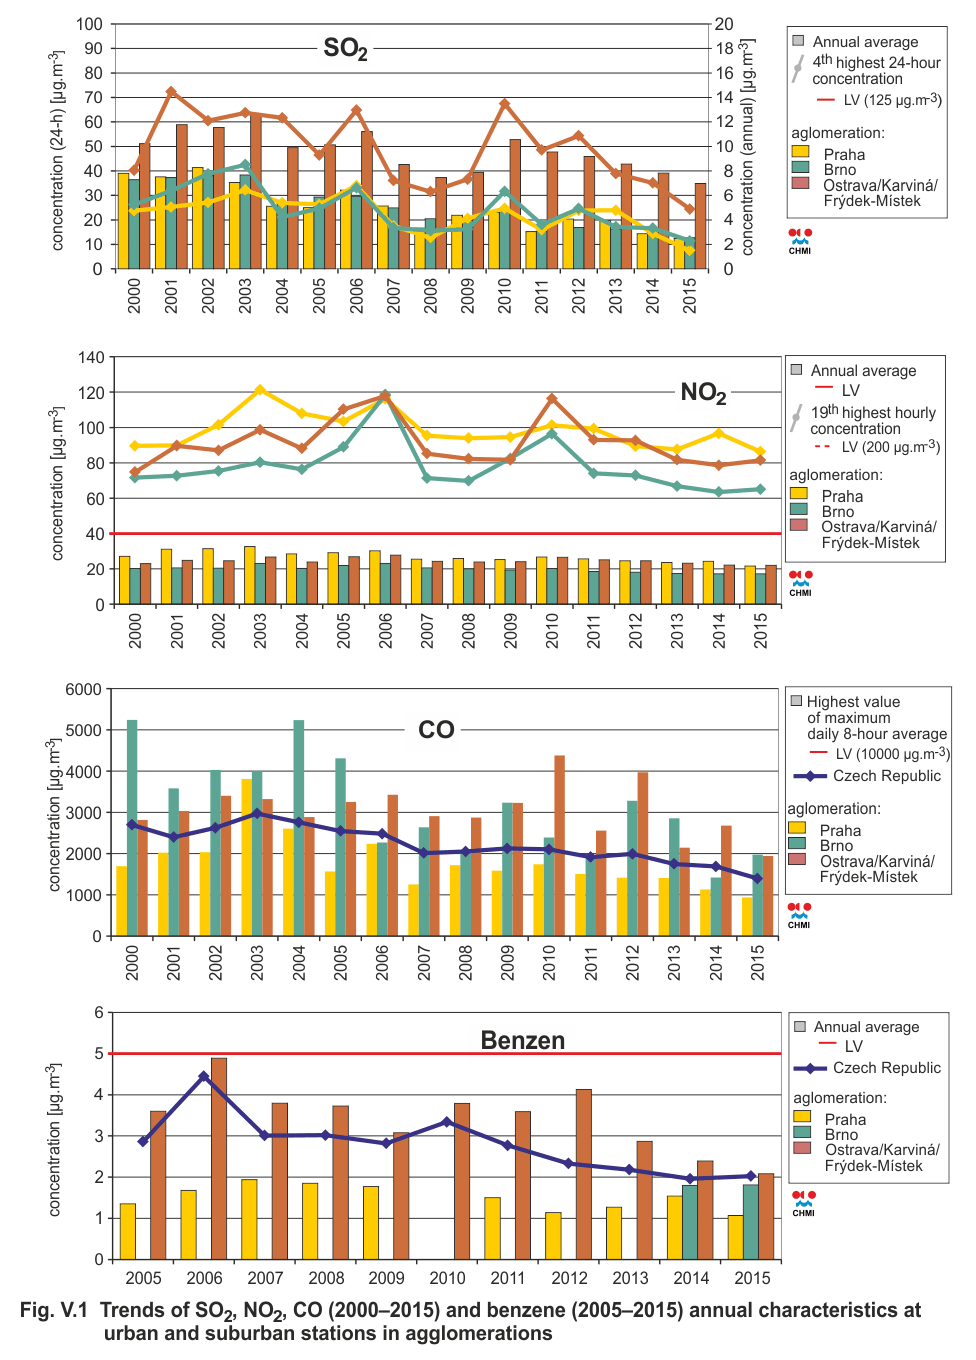
The trend of air pollution characteristics for NO2 is evaluated based on data from stations for which there is a complete time series starting from the year 2000 (Fig. V.1). The downward trend of NO2 concentrations of the 1990s (e.g. ČHMÚ 2014b) stopped in 2000 and, conversely, NO2 concentrations were increasing up until 2003 when the concentration levels recorded were similar to those measured in 1996. The higher concentrations of NO2 in 2003 were caused both by unfavourable dispersion conditions in February and December and by subnormal precipitation amounts. Since 2003 the air pollution characteristics of NO2 did not show any marked trends. On the whole, they were decreasing, but a year-on-year comparison reveals fluctuations that are caused mainly by the prevailing meteorological and dispersion conditions. An increase of both the annual average concentration and the 19th highest 1-hour concentration was recorded in 2006 and 2011. Since 2011, air pollution characteristics of NO2 have had a very slight decreasing trend, with the exception of the year 2014, when the 19th highest hourly concentration increased compared to the previous year. The year 2015 showed a decrease in ambient characteristics of NO2 as compared to the previous year. Since the beginning of the evaluated period, air pollution characteristics of NO2 remained below their respective limit values. It can be assumed, however, that pollution limits can be exceeded also at other localities exposed to traffic where no measurements are carried out.
Benzo[a]pyrene
Elevated concentrations of benzo[a]pyrene are still causing problems in the Prague agglomeration. In 2015, however, the limit value for the annual average concentration of benzo[a]pyrene was not exceeded at any of the stations within the Prague agglomeration. At the station Prague 4-Libuš, the annual average concentration stayed just below the annual limit (0.9 ng.m-3). Benzo[a]pyrene concentrations in the evaluated period starting with the year 2000 reached its highest level in 2006, then decreased until 2009, and from 2010 until 2014, they did not exhibit any marked trend. In 2015 concentrations of benzo[a]pyren declined. Since the monitoring of this pollutant began, its ambient limit was exceeded every year except 2015 at least at one monitoring station in the Prague agglomeration (Fig. V.1.5).
Ground-level ozone
In 2015 (averaged over three years from 2013 until 2015), the limit value for ground-level ozone was exceeded at the suburban background locality Prague 4-Libuš, where the ambient limit value of 120 μg.m-3 was exceeded 27 times on average over three years, the permissible number of exceedances being 25. This ambient limit was exceeded at this locality for the first time since 2008. At the stations Prague 5-Stodůlky, Prague 6-Suchdol and Prague 2-Riegrovy sady, this limit value got exceeded more than 20 times on average over three years, i.e. in more cases than in previous years. In the evaluated period 2006–2013, the ambient limit was exceeded at the locality Prague 6-Suchdol (Fig. V.1.6). In 2015 the stagnant trend was interrupted by a significant increase in the average number of limit value exceedances for ozone per locality. This fact was influenced by extremely high temperatures and intensive solar irradiation in July and August 2015. The lowest concentrations were measured at the traffic station Prague 9-Vysočany, which corresponded to the formation of ground-level ozone and the progression of its concentrations (Chapter IV.4.3).
Other pollutants
As concerns other pollutants listed in the legislation (CO, SO2, benzene and heavy metals), the limit values have in the long term been successfully met in the agglomeration of Prague. Concentrations of SO2, Ni and Cd exceeded their respective limit values at several stations in the 90s; after the year 2000, above-the-limit annual average concentrations of arsenic occurred at the station Prague 5-Řeporyje for the last time in 2011. Nevertheless, the concentrations of these substances also respond to the prevailing meteorological and dispersion conditions, and thus increases of several air pollution characteristics of these pollutants were recorded e.g. in the years 2003, 2006, 2010 or 2011.
V.1.2 Emissions in the agglomeration of Prague
At present, there are 2,040 individually registered sources of ambient air pollution in the territory of the Prague agglomeration, included in the REZZO 1 and REZZO 2 databases. Only a few of them, however, are contributing significantly to total emissions, primarily the cement plant Cementárna Radotín and the heating plant Teplárna Malešice (Pražská teplárenská, a. s. – PT, a. s.), the ZEVO Malešice (Pražské služby, a. s.), other thermal energy sources of PT, a. s., and industrial plants such as the tyre manufacturer MITAS, a. s. In the recent period, the share of emissions from the production of electric energy in cogeneration units has also increased (e.g. ÚČOV PVaK and TEDOM Daewo-Avia Letňany). According to SLDB 2011 outputs, most households are heated by central sources (ca 52 % of flats), followed by gas boiler rooms and local gas boilers (altogether ca 31 % of flats). A significant share is contributed by electrical heating (about 5 %) and other types of heating that are difficult to classify (a relatively high share of about 10 %). Only in a small part of the housing stock, primarily in the city’s outskirts, coal, wood and coke are used for heating. Similarly, the majority of community sector buildings are connected to central heat sources or have their own gas boiler rooms.
In the period 2002–2014, all monitored emissions decreased in the above significant sources. As concerns heat generating sources, the decrease is connected with the implementation of the large-scale project interlinking the thermal energy supply system Mělník-Prague, which was established in 1995. The essential decrease of SO2 emissions is related to reducing the amount of hard coal combusted in the heating plant in Malešice (starting from 2011).
From the nationwide perspective, the emission load of Prague is rather specific. Most sources monitored as point sources and area sources operated in the territory of Prague have minor significance, and the highest share of emissions is caused by traffic (Fig. V.1.9). With regard to the fact that significant sources usually have tall chimneys, their share in air pollution is often recorded in areas outside Prague.
The decrease in reported TSP emissions of REZZO 2 sources is in fact influenced to a certain extent by a change of the reporting methodology concerning emissions from quarries, which stems from the implementation of a provision determining the method of ascertaining emission amounts.
V.1.3 Conclusion
The capital city Prague is an area where a lot of people are exposed to ambient air pollution. Within the Prague agglomeration, ambient limit values for suspended particles, nitrogen dioxide and benzo[a]pyrene are exceeded in the long term. The limit value for ground-level ozone is usually exceeded in the outskirts of Prague. Most exceedances in the capital are connected with significant traffic loads, but also with household heating, mainly in built-up areas by family houses. The share of mobile sources in total emissions of TSP in the Prague agglomeration amounts to more than 60 % and in total emissions of NO2 to approximately 70 %.
In the Prague agglomeration in 2015, the ambient limit value was not met for the annual average concentration of NO2 and the maximum daily 8-hour running average for ground-level ozone (averaged over three years). Since 2011, annual average concentrations of PM10 at monitoring stations have stayed below the limit. In 2015, the ambient limit for the 24-hour concentration of PM10 was not exceeded for the first time in the period 2007–2015 (Fig. V.1.1). As concerns other pollutants, meeting their respective limit values does not pose a problem.
V.1.4 Pollution roses for the Prague agglomeration (locality Prague 2-Riegrovy sady)
The station Prague 2-Riegerovy sady is located in the centre of Prague, in a park approximately 50 m away from a not-too-busy street. The prevailing wind directions are southwesterly and westerly, as is typical for the Prague agglomeration (Fig. 1, Annex III). Conversely, the least frequent are north-easterly winds. The station itself is influenced by multi-storey residential buildings. The Riegerovy sady park is located to the south of the station.
According to the pollution rose for PM10 (Fig. 2, Annex III), the highest ambient levels of this pollutant occur during northwesterly to southeasterly air flow, when the influence of the town district of Vinohrady becomes significant.
The whole-year pollution rose for NO2 (Fig. 3, Annex III) emphasizes sources located close to the place of measurement, probably linear sources that are active year-round, mostly, however, those located in easterly directions and active mainly in winter (Fig. 4, Annex III).
Specific in character are pollution roses for secondarily formed ground-level ozone, whose formation is predominantly influenced by temperature and sunlight intensity. The pollution rose places the area of the highest concentrations of O3 into the southeastern sector (Fig. 5, Annex III) and also to the north to northwest. Temperature-structured pollution roses very well illustrate how the temperature affects the formation ground-level ozone, which is also confirmed by the pollution rose structured by season (Fig. 6, Annex III).
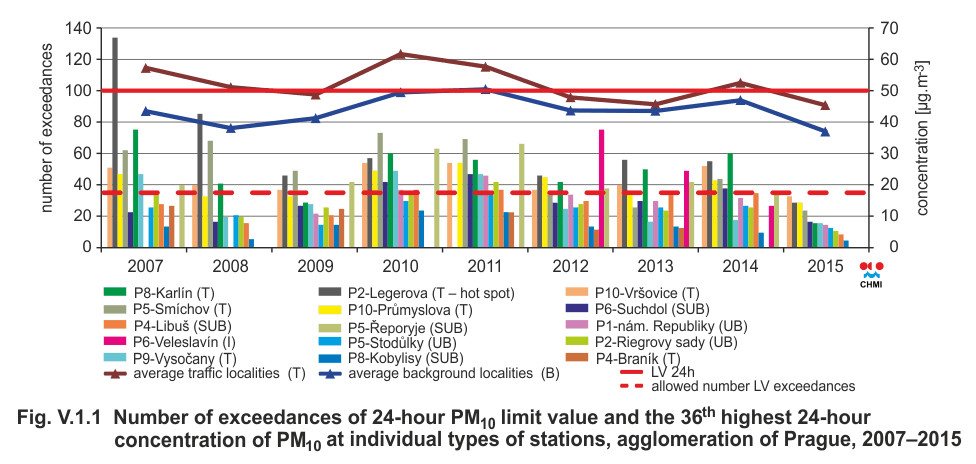
Fig. V.1.1 Number of exceedances of 24-hour PM10 limit value
and the 36th highest 24-hour concentration PM10 at individual
types of stations, agglomeration of Prague, 2007–2015
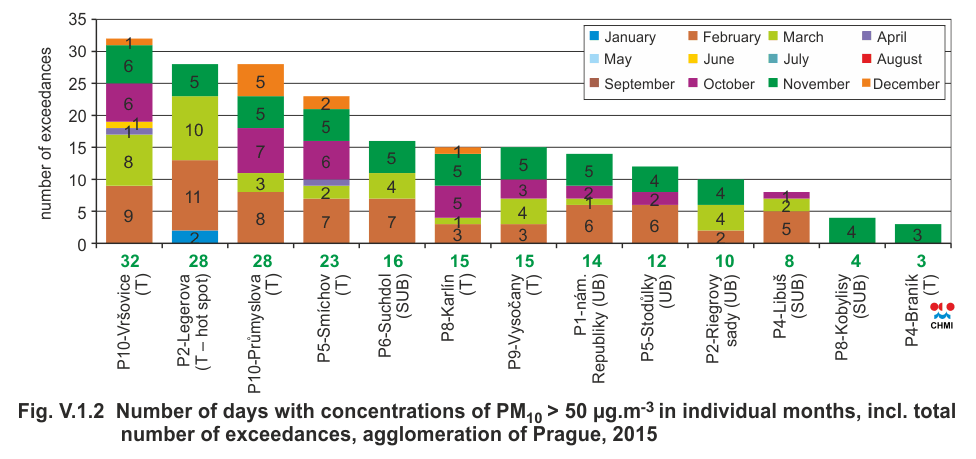
Fig. V.1.2 Number of days with concentrations of PM10 > 50
µg.m-3 in individual months, incl. total number of exceedances,
agglomeration of Prague, 2015
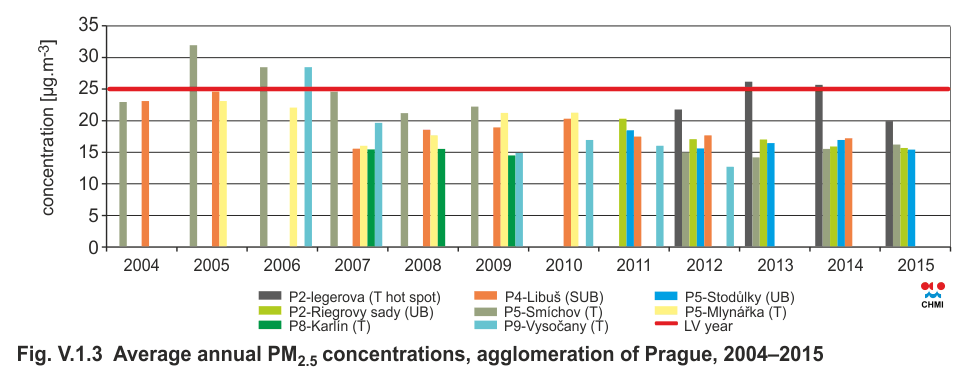
Fig. V.1.3 Average annual PM2.5 concentrations, agglomeration of
Prague, 2004–2015
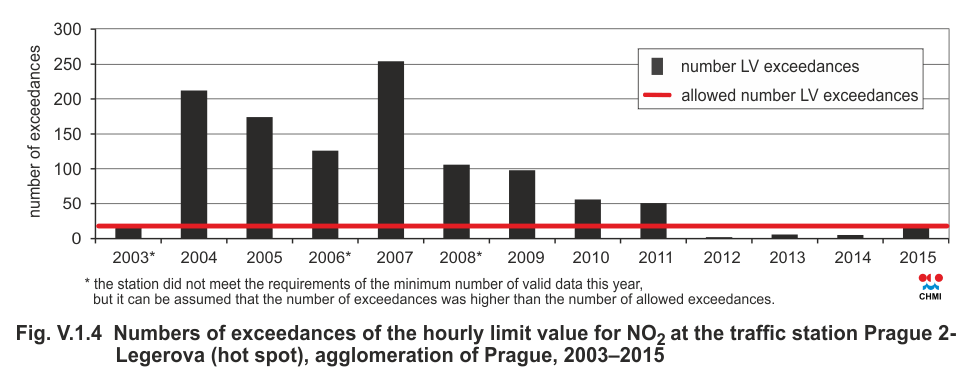
Fig. V.1.4 Numbers of exceedances of the hourly limit value for
NO2 at the traffic station Prague 2-Legerova (hot spot),
agglomeration of Prague, 2003–2015
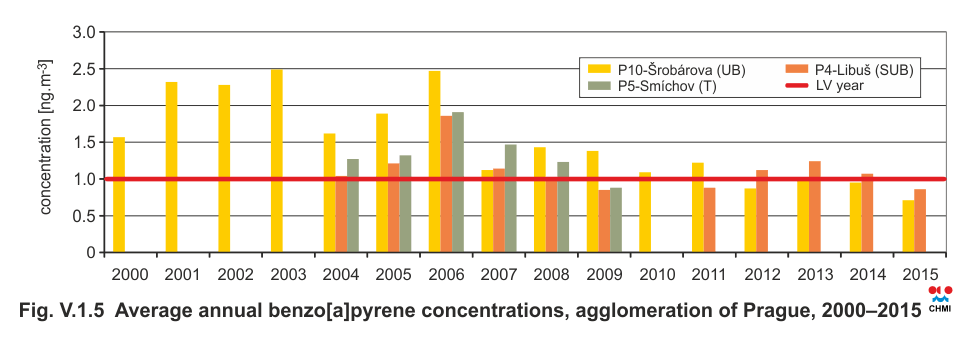
Fig. V.1.5 Average annual benzo[a]pyrene concentrations,
agglomeration of Prague, 2000–2015
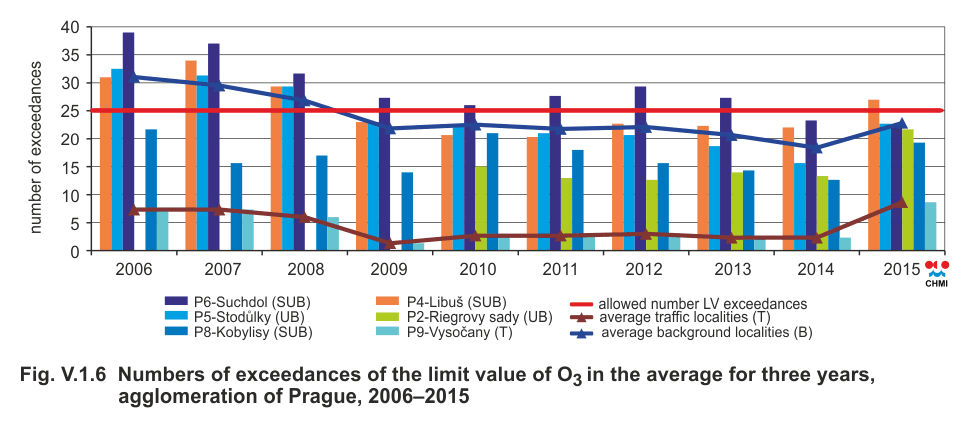
Fig. V.1.6 Numbers of exceedances of the limit value of O3 in the average for three years, agglomeration of Prague, 2006–2015
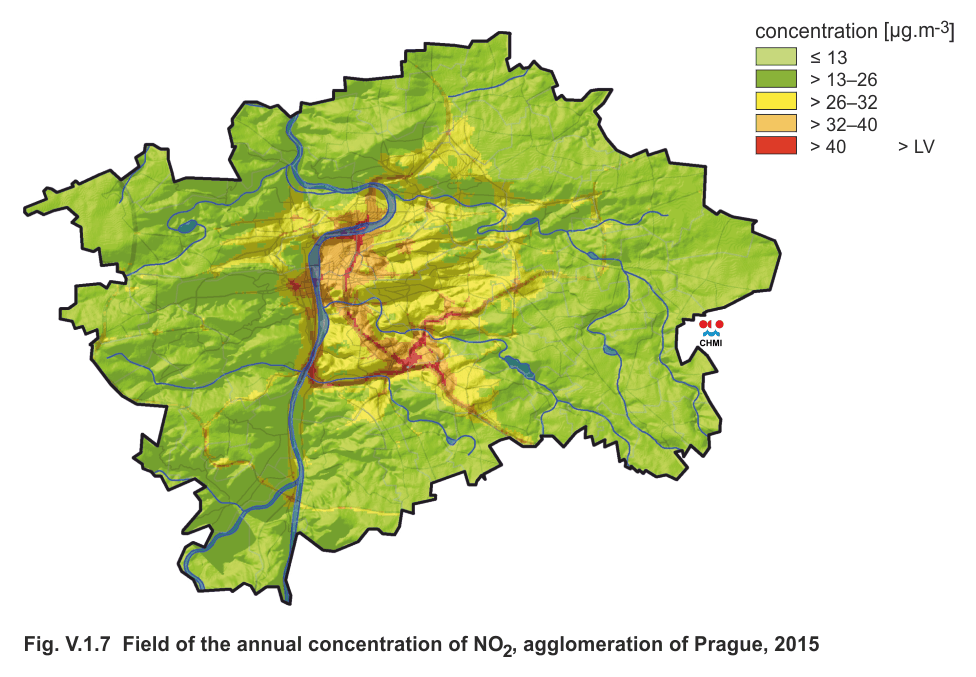
Fig. V.1.7 Field of the annual concentration of NO2,
agglomeration of Prague, 2015
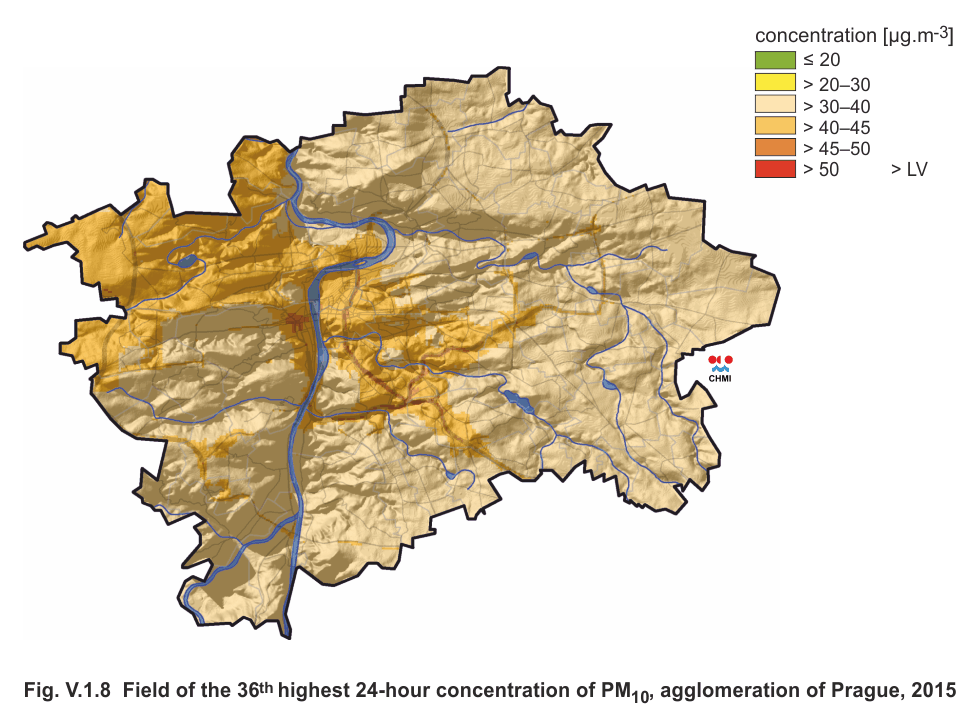
Fig. V.1.8 Field of the 36th highest 24-hour concentration of
PM10, agglomeration of Prague, 2015
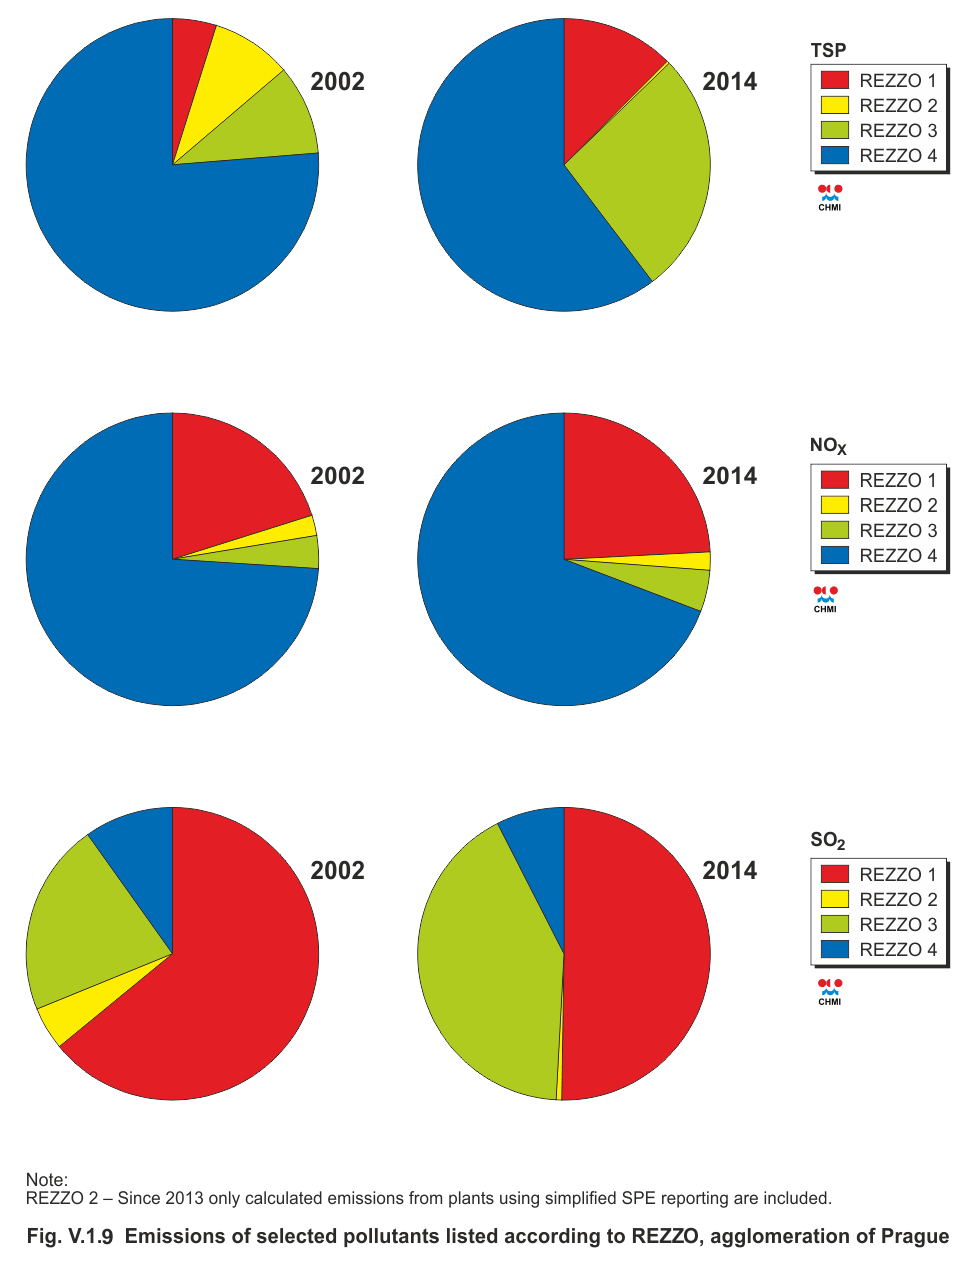
Fig. V.1.9 Emissions of selected pollutants listed according to
REZZO, agglomeration of Prague