SUMMARY
Ambient air pollution by suspended particles of fractions PM10 and PM2.5, benzo[a]pyrene and ground-level ozone is a major problem for air quality in the Czech Republic (Fig. 1). The level of air pollution in a given year depends on the amount of emissions and the prevailing meteorological and dispersion conditions. Most ambient air characteristics are showing a decreasing trend since the year 2000. This trend, however, is not as marked as that in the 1990s. Nevertheless, concentrations of the above-mentioned pollutants, all of which have serious impacts on human health, exceed their respective ambient limits every year at a number of localities.
From the local to regional perspective, the most serious situation is still in the agglomeration of Ostrava/Karviná/Frýdek-Místek. Limit values are nevertheless exceeded in all zones and agglomerations. In the agglomeration of Ostrava/Karviná/ Frýdek-Místek, high concentrations of pollutants are caused not only by sources located in the Czech Republic, but also by the transfer of emissions from Poland. On both sides of the border there is a high concentration of industrial production and a high density of built-up areas with local household heating using solid fuels and a developed transport infrastructure (Chapter V.3). In Prague and in Brno, limit-exceeding concentrations of air pollutants produced mainly by traffic, to which a considerable part of the population is exposed, remain a problem that needs to be addressed (Chapters V.1, V.2).
Deteriorated ambient air quality is not a problem only in agglomerations and larger cities, but also in small settlements, where air pollution by suspended particles and benzo[a]pyrene comes from local heating. Increased and even limit-exceeding concentrations of these pollutants presumably occur also in places where they are not measured.
A considerable part of the territory of the Czech Republic is also exposed every year to above-limit concentrations of ground-level ozone. However, with regard to the chemistry of ozone, these are not so densely populated areas as in the case of suspended PM10 and PM2.5 particles and benzo[a]pyrene. Consequently, the resulting share of inhabitants affected by the limit-exceeding concentrations of ozone is lower compared to the share of inhabitants affected by the above-limit concentrations of PM10, PM2.5 and benzo[a]pyrene.
AIR QUALITY IN THE CZECH REPUBLIC IN THE YEAR 2015 WITH
REGARD TO THE LIMIT VALUES FOR THE PROTECTION OF HUMAN HEALTH
In 2015, areas with deteriorated air quality (ozone excluded) covered approximately 20.4 % of the territory of the Czech Republic, inhabited by approximately 51.5 % of the population. The overwhelming majority of these areas was delimited based on exceedances the limit values for suspended PM10 and PM2.5 particles and benzo[a]pyrene. In 2015 the assignment of areas to these regions was to a lesser extent determined by exceedances of the ambient limit for cadmium. Areas with deteriorated air quality (ozone included) covered approximately 42.1 % of the area of the Czech Republic, inhabited by approximately 55.0 % of the population (Chapter VII).
The daily limit value for PM10 suspended particles was exceeded in 2.5 % of the territory of the Czech Republic, inhabited by approximately 10.4 % of the population, and the permissible average annual concentration was exceeded in 0.02 % of the territory, which is inhabited by 0.01 % of the population. The year 2015 as against the year 2014 saw an decrease of the share of localities with exceedances of the daily limit value for PM10, and the total area with exceedances of the daily limit for PM10 decreased too (Chapter. IV.1).
The annual limit value for suspended PM2.5 particles was exceeded in 0.9 % of the territory of the Czech Republic, inhabited by approximately 5.1 % of the population. The situation concerning the annual average concentration of PM2.5 and PM10 improved considerably as compared with the year 2014 (Chapter IV.1).
The ambient limit for benzo[a]pyrene was exceeded, similarly as in the previous years, in a number of towns and municipalities (20.3 % of the Czech Republic inhabited by approx. 50.8 % of the population). Estimates of the fields of annual average concentrations of benzo[a]pyrene are burdened by the greatest uncertainties of all monitored substances. These uncertainties are caused by an insufficient density of measurements, mainly at rural regional stations and in small settlements in the Czech Republic. As regards air pollution caused by benzo[a]pyrene, small settlements substantial influence ambient air quality due to local household heating (Chapter IV.2).
The annual ambient limit for nitrogen dioxide was exceeded at only two localities in Prague that are exposed to high intensities of traffic. However, the limit is presumably exceeded also in other places exposed to similar traffic loads where no measurements are carried out. The 1-hour limit value for NO2 was not exceeded, similarly as in the previous years (Chapter IV.3).
The ambient limit for ground-level ozone was exceeded in 26.8 % of the territory of the Czech republic, inhabited by approximately 9.5 % of the population (average for the period 2013–2015; Chapter IV.4). In comparison with the previous year (average for the period 2012–2014), the area where limit concentrations were exceeded grew nearly five-fold (Chapter IV.4).
The ambient limit for benzene was not exceeded at any locality. The highest concentrations were reached, as in previous years, at stations in the agglomeration of Ostrava/Karviná/Frýdek-Místek (Chapter IV.5).
The ambient limit for arsenic was not exceeded at any locality in 2014. The ambient limit for cadmium was exceeded at the locality Tanvald-školka (Chapter IV.6).
The limit values for lead, nickel, sulphur dioxide and carbon monoxide were not exceeded, similarly as in the previous years (Chapters IV.6, IV.7, IV.8).
AIR QUALITY IN THE CZECH REPUBLIC IN THE YEAR 2014 WITH REGARD
TO THE LIMIT VALUES FOR THE PROTECTION OF ECOSYSTEMS AND
VEGETATION
In 2015, as opposed to 2014, the ambient limit for ground-level ozone (expressed as the AOT40 exposure index) was exceeded in a larger area. Above-limit concentrations of O3 in 2015 occurred mainly in the territories of the Bílé Karpaty PLA, the Pálava PLA and the Podyjí NP. In 2015, compared to the previous year, values of the AOT40 index increased at 80 % of localities (Chapters IV.4, VII.2).
The ambient limit for sulphur dioxide and nitrogen oxides for the protection of ecosystems and vegetation were not exceeded at any rural locality where concentrations of these pollutants are measured.
Based on modelling results (combined with measurements), the upper assessment threshold (UAT) was exceeded in the case of the annual average concentration of SO2 in small areas of the Ústí nad Labem, Karlovy Vary, Moravia-Silesia and Olomouc regions. In the same regions, except the Olomouc region, the results show exceedances of the UAT for average concentrations in the winter period 2015/2016 (Chapter IV.7). Limit-exceeding concentrations of NOx occur especially along roads. For the most valuable natural parts of the Czech Republic, the results of the model assessment point to exceedances of the ambient limit for NOx in small areas of a few protected landscape areas in the country (Chapter IV.3 and VII.2).
SMOG WARNING AND REGULATORY SYSTEM
In 2015 nine smog situations were issued due to increased PM10 concentrations. At least one smog situation was announced in seven of the total 15 SWRS areas for PM10. The greatest number of smog situations were announced in the territory of the agglomeration of Ostrava/Karviná/Frýdek-Místek. Only one regulatory notice was issued in the Moravia-Silesia zone. Compared to the year 2014, their total number remained constant, but their overall duration decreased by 17 %, and the smog situations were not restricted to central and northern Moravia. For the first time since 1997, a smog alert was issued due to elevated concentrations of SO2, specifically in the Northwest zone. Twenty-four smog situations were announced due to high concentrations of ground-level ozone. At least one smog alert due to ground-level ozone was issued in each of the total 16 SVRS areas. Compared to the year 2014, the number and duration of smog situations due to ozone thus increased substantially (Chapter VI).
EMISSIONS OF AIR POLLUTANTS
Year-to-year comparison of emissions of main pollutants between 2014 and 2015 reveals a more important influence of the colder heating season in 2015 and the ensuing higher presumed consumption of fuels in households. While in the case of REZZO 1 sources, all emissions exhibited decreases as against 2014 (in the case of SO2, this increase was 6.7 %), emissions from household heating calculated based on modelling results show an average increase of 7 %. The decrease of emissions from REZZO 1 sources was to a large part achieved thanks to the implementation of measures for decreasing emissions from industrial and energy-producing sources such as iron and steel production plants in the Moravia-Silesia region. There was also a decrease of emissions from mobile sources (by approximately 2 %).
The sector of local household heating still significantly contributed to ambient air pollution, namely by emissions of PM10 (33.9 %), PM2.5 (51.2 %), carbon monoxide (50.2 %) and benzo[a]pyrene (84.0 %). The critical share of the sector of public electricity and heat production resided in emissions of sulphur dioxide (62.4 %), arsenic (54.0 %), nickel (62.1 %) and cadmium (34.9 %), and in the sector of iron and steel production in emissions of lead 34.6 %. The sector of road freight transport over 3.5 t, passenger car transport, off-road vehicles and other machines used in agriculture and forestry produced 38.9 % of nitrogen oxides emissions. The most significant sources of emissions of volatile organic compounds are found in the sector of organic solvent use and application, contributing 50.7 % of the ambient air pollution caused by these pollutants. The share of the main source of ammonia emissions – breeding of farm animals in total emissions amounted to 70.0 %.
The decrease in emissions from sources listed in Annex 2 of the Air Protection Act is also reflected in the collection of air pollution charges. For emissions of total solid pollutants and SO2, reported tolled emissions and corresponding charges decreased by 7 %, and in the case of NOx by 6 % between. The slight 0.7 % increase in VOC emissions might be related to the overall growth of industrial production in the Czech Republic and surrounding countries.
Considering the fact that the emission data presented since 2013 are in many cases based on significantly innovated methodical procedures (e.g. structure of fuels and appliances used in household heating, lorry fleet, addition of specific groups of sources to the whole time series), the emissions data cannot be compared with data presented in previous yearbooks. Importantly, however, the emission inventory data for the period after the year 2000 are being processed using consistent methods. Although minor changes and specifications will be made in the upcoming period, the data presented since 2000 show an ongoing decreasing trend of air pollution levels in almost all sectors monitored pursuant to the international classification of sources (Chapter II).
ATMOSPHERIC DEPOSITION
The year 2015 was below the long-term normal precipitation-wise. The average precipitation in the territory of the Czech Republic amounted to 532 mm, which is 79 % of the long-term normal for the period 1961–1990. In comparison with the year 2014 (657 mm), the total precipitation was lower.
Wet sulphur deposition was lower compared to 2014. This was actually the lowest value since the beginning of the monitored period in 1995. The greatest values of wet sulphur deposition were reached in mountainous areas (the Moravskoslezské Beskydy Mts., and the Krkonoše Mts.).
Dry sulphur depositions increased in comparison with the year 2014. Total sulphur deposition amounted to 39,658 t in the area of the Czech Republic. This constitutes a decrease, because after the year 2007 its value varied around 50,000 t. The highest values were reached in the Krušné hory Mts. and in the Ostrava region.
Wet deposition of reduced (N/NH4+) and oxidized (N/NO3-) forms of nitrogen in the year 2015 decreased. The total wet deposition of nitrogen over the area of the Czech Republic amounted to 43,455 t.
Dry deposition of oxidized forms of nitrogen decreased slightly.
Total nitrogen deposition amounted to 63,292 t of nitrogen over the area of the Czech Republic.
Wet deposition of hydrogen ions in the year 2015 reached the lowest value since the beginning of the monitored period. This decrease of wet deposition was probably caused by lower annual precipitation totals compared to the year 2014.
Wet deposition of lead in the year 2015 decreased to half the value of the year 2014. The greatest values were reached in the Krušné hory Mts. (Karlovy Vary region). Dry deposition of lead in 2015 decreased compared to 2014.
Both wet and dry deposition of cadmium decreased in 2015. The greatest values were reached, as in previous years, on the territory of the Jablonec nad Nisou district.
Wet deposition of nickel ions in 2015 varied around a similar level as in the year 2014.
Wet deposition of chloride ions decreased (Chapter IX).
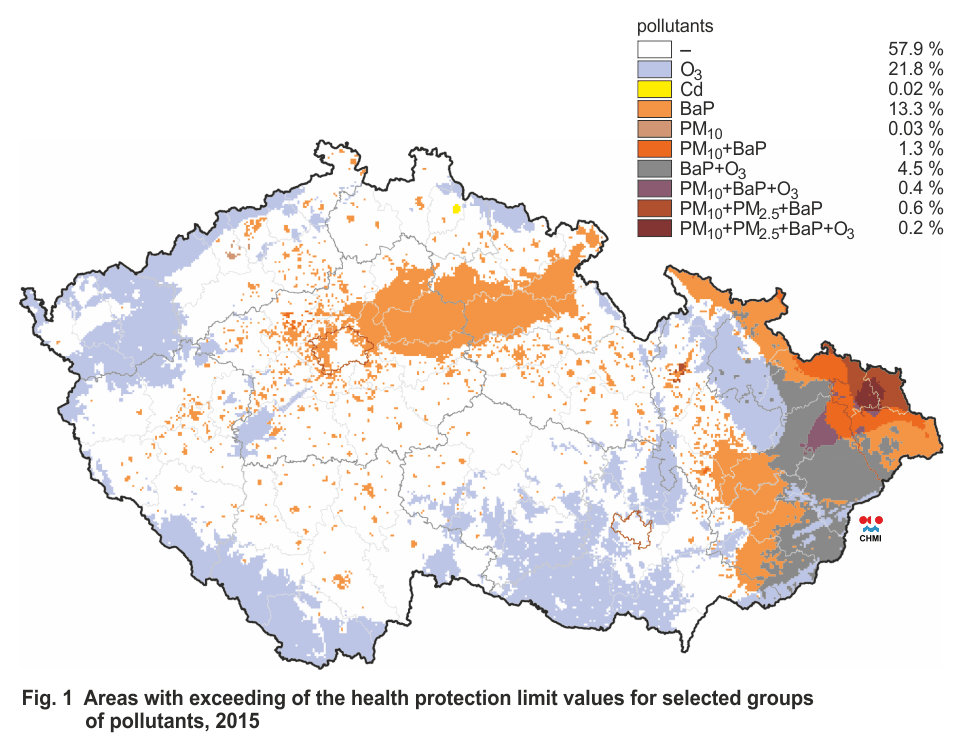
Fig. 1 Areas with exceeding of the health protection limit
values for selected groups of pollutants, 2015