IV.9 POLLUTANTS WITHOUT THE LIMIT VALUE
IV.9.1 Volatile organic compounds
Volatile organic compounds (VOC) play an important role in air chemistry and thus also in determining the oxidative power of the atmosphere, which influences atmospheric conditions and air quality. Together with nitrogen oxides, VOC significantly contribute to the process producing ground-level ozone and other photo-oxidative pollutants. Transformations and degradation of VOC usually begin with a reaction with the hydroxyl radical (Víden 2005). According to the Air Quality Act, any organic compound (except methane) or mixture of organic compounds which at 20 °C has a vapour pressure of 0.01 kPa or more, or is correspondingly volatile under the specific conditions of its use, is regarded as a volatile organic compound. Considering the range and different reactivity of individual VOC and their amount, no limits values have been set for these substances.
Monitoring of VOC has been included in the Co-operative Programme for Monitoring and Evaluation of Long-range Transmission of Air Pollutants in Europe (EMEP) based on a decision made at the EMEP Workshop on Measurements of Hydrocarbons/VOC in Lindau in 1989 (EMEP 1990). The monitoring itself thereafter commenced in 1992 at the Košetice observatory (OBK). Three years later it was supplemented by identical monitoring at the station Praha-Libuš. As part of the EMEP, the monitoring was initially realized at five stations, but the number of stations, as well as the range of hydrocarbons measured, changed several times over the course of the next 20 years. At the OBK, a homogeneous series of measurements up to the present time has been achieved. Since 2011 the OBK participated in the ACTRIS project, conducted under the EU 7th Framework Programme INFRA-2010-1-1.1.16: Research Infrastructures for Atmospheric Research. This project has been superseded by the follow-up project ACTRIS-2 under H2020-INFRAIA-2014–2015, carried out in the period 5/2015–4/2019. The topic of VOC has been addressed by the working group Trace gases networking: Volatile organic carbon and nitrogen oxides, aiming to harmonize and improve the quality of VOC measurements in Europe. Within the framework of the project, standard operational procedures are developed, and the best measuring techniques for ensuring high quality are tested. The CHMI laboratory regularly participates in a round-robin test, whose results pertaining to the analysis of VOC itself confirm that the laboratory complies with the recommended parameters of the GC system and that it meets the required levels of uncertainty for most substances, both when analysing standards and actual samples.
Average annual concentrations of most VOC at the OBK and Praha-Libuš stations over the 20 years of monitoring exhibit a statistically significant decreasing trend that reflects the decrease in VOC emissions in the Czech Republic as well as in the whole of Central Europe (Tab. IV.9.1.1). The trend of ethane concentrations is much more pronounced at the suburban station Praha-Libuš than at the background station OBK. The only exception is isoprene, which is of natural origin, being emitted by deciduous trees. At the OBK, no trend concerning average annual concentrations of isoprene has been recorded. At the Praha-Libuš station, we are even registering a slight increase of concentrations. It can be generally stated that concentrations of main VOC at the suburban level in the 90s of the last century were approximately 150–200 % higher than at the background station. In the last decade, differences between these two stations have been strongly diminishing.
Results obtained in 2015 in no way deviate from long-term trends (Tab. IV.9.1.1). The annual progression of most VOC emissions reflects emission levels, i.e. maximum values in winter and minimum values in summer; only in the case of isoprene, the situation is the opposite (Fig. IV.9.1.1).
The current report on measurements of VOC within the EMEP (NILU 2015) indicates that VOC concentrations at regional scale are continuously decreasing and thus reflect the decreasing trend in emissions. The level of concentrations measured at the Košetice background laboratory is comparable to those measured at German, Swiss and French stations. In the case of ethane, data from the Czech station are in the long term characterized by lower annual averages. For most VOC, values measured in winter are usually very similar to German stations whereas values measured at the Košetice background laboratory in summer are moderately lower.
The Geneva Protocol on the reduction of VOC emissions and their cross-border transport was adopted in November 1991 and came into effect in September 1997 (UN-ECE 1991). The Protocol contained three possible ways of reducing VOC:
- A 30% reduction of emissions of VOC before the year 1999, the years 1984 and 1990 being used as a basis;
- The same reduction as in point (1) and to ensure that total national emissions of 1999 do not exceed the level of 1988;
- Where emissions from 1988 do not exceed set limits, states can adopt the level of 1999 as the emission ceiling.
The Gothenburg Protocol to Abate Acidification, Eutrophication and Ground-level Ozone, agreed on in 1999, came into effect in on 17 May 2005 (UN-ECE 1999). The Protocol sets emission ceilings for the year 2010 for four pollutants including VOC. According to the Protocol, European emissions of VOC should have been reduced by at least 40 % compared to the year 1990. The Czech Republic, like most Central-European countries (except Poland), did not exceed this limit; emissions of VOC in the Czech Republic decreased by 51 % in the years 1990–2010 (EEA 2013d).
Emissions of VOC
Chemical products containing VOC are used in a whole range of applications both in households and in industry as cleaning agents, thinners and degreasers. VOC may be contained in paints, varnishes, glues and pharmaceutical products. They get released during the storage or use of petroleum products. VOC are also created during imperfect combustion of fossil fuels. The most important sources of VOC emissions in the Czech Republic belong to the sector comprising the use and application of organic solvents (NFR 2D3), which in 2014 emitted 50.7 % of the emissions of these pollutants (Fig. IV.9.1.2). This sector includes the following activities: 2D3d-Coating applications (21.9 %), 2D3e-Degreasing (5.4 %), 2D3g-Chemical products (7.7 %), 2D3h-Printing (2.8 %), 2D3a-Domestic solvent use including fungicides (7.5 %) and 2D3i-Other solvent use (5.4 %). Part of these emissions are released into the atmosphere in a controlled way, but most of them escape into the air in the form of fugitive emissions, which are difficult to regulate. The largest amount of VOC emissions from combustion processes originates in sectors 1A4bi-Residential stationary combustion (17.0 %), 1A3bi-Road transport: Passenger cars (3.5 %), 1A3biii-Road Transport: Heavy duty vehicles and buses (4.8 %), and in sector 1A1a-Public electricity and heat production (3.4 %). In connection with traffic, emissions of VOC are released into the atmosphere also in the form of fumes from the fuel systems of cars and lorries, which are comprised in sector 1A3bv-oad Transport: Gasoline evaporations (6.2 %). Significant amounts of VOC are released into the atmosphere during coal mining - sector 1B1a-Coal Mining and Handling (5.6 %).
Total emissions of VOC in the period of 2007–2014 exhibited a downward trend (Fig. IV.9.1.3), which was caused by the use of products with a lower content of volatile organic substances, e.g. water-miscible paints or powder plastics. In the case of paint products packaged for retail, the legislation limits the maximum amount of solvents in products supplied to the market. Emissions of VOC from transport are continuously decreasing also thanks to the constant renewal of the car fleet.
Tab. IV.9.1.1 Stations with average annual concentrations of
VOC in the ambient air
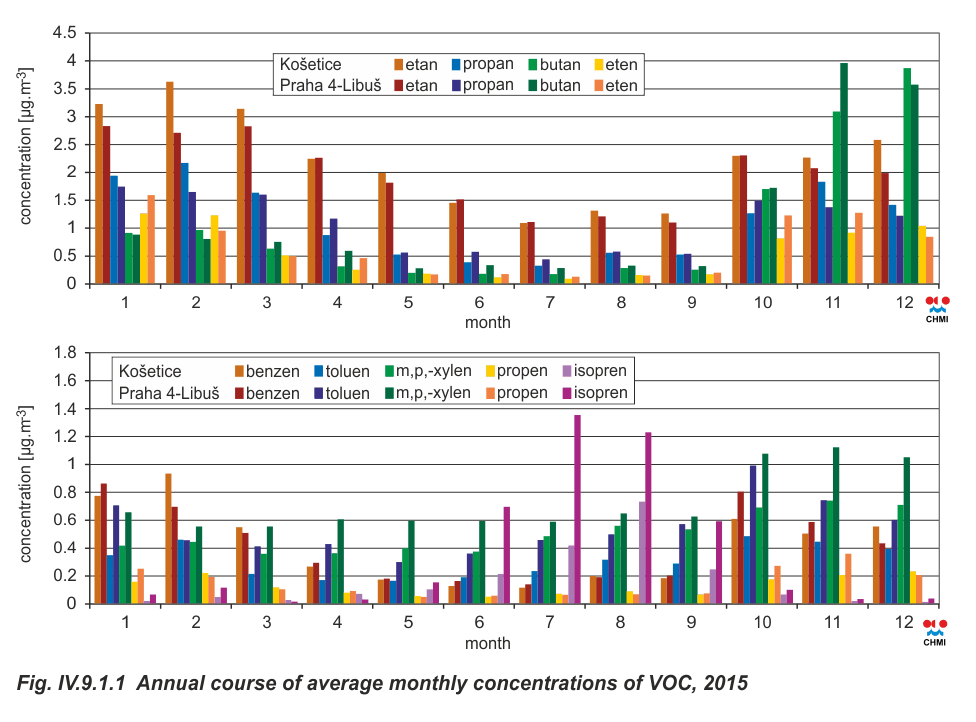
Fig. IV.9.1.1 Annual course of average monthly concentrations
of VOC, 2015
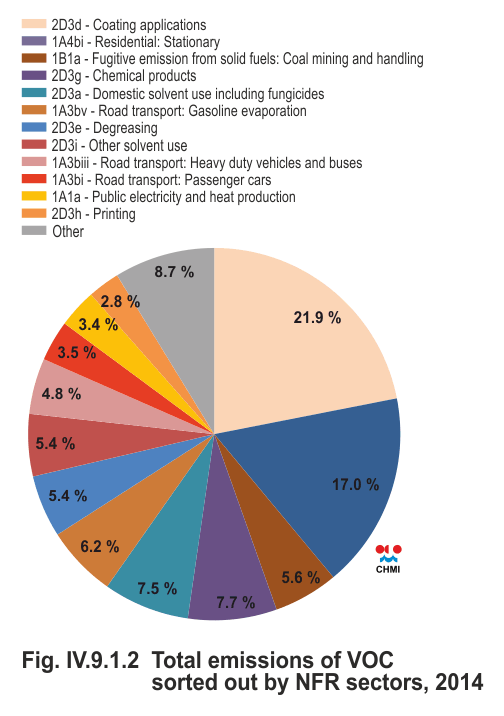
Fig. IV.9.1.2 Total emissions of VOC sorted out by NFR sectors,
2014
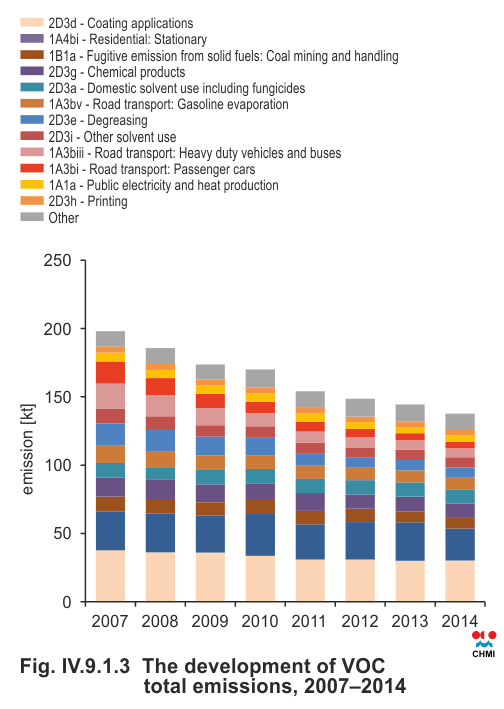
Fig. IV.9.1.3 The development of VOC total emissions, 2007–2014
IV.9.2 Ammonia
Concentrations of ammonia in the year 2015
NH3 does not currently have a set ambient limit value, so the obligation to monitor its concentrations is not imposed by law. The legislature mainly focuses on curbing emissions of NH3 (i.e. adherence to appropriate agricultural practices and prevention of serious accidents). For this reason, the monitoring of ammonia at both localities (Pardubice-Dukla and Most) was terminated in the first half of 2015.
Based on measurements carried out in previous years, we know that average annual concentrations of NH3 recorded in the Czech Republic (4.2 μg.m-3 at the Pardubice-Dukla station in 2013, 2.1 μg.m-3 in Most in 2013 and 2.3 μg.m-3 in 2014) are comparable to concentrations recorded abroad. In the Canadian province of Ontario, for example, average annual concentrations of NH3 range from 0.1 to 3.0 μg.m-3 (Zbieranowski, Aherne 2012); in intensively farmed areas of Ontario, this concentration is 3.6 μg.m-3 (Zbieranowski, Aherne 2013). In the south of Scotland, average annual concentrations of NH3 are in the range of 0.40–22.9 μg.m-3, depending on the sampling site (Vogt et al. 2013). The highest values have been reached at a locality situated 70 metres downwind from a poultry farm.
Concentrations of NH3 exhibit marked spatial and temporal variability with regard to the main source of pollution. Its spatial variability is influenced by distance from an emission source. Temporal variability in agricultural areas is caused by seasonal application of fertilizers during the course of the year, so higher concentrations are reached in such areas mainly in spring and autumn (Zbieranowski, Aherne 2013).
Concentrations of NH3 are strongly influenced by higher temperatures, which cause increased emissions of NH3 due to its higher volatility.
Emissions of ammonia
Ammonia emissions are produced by decomposition of urea from animal biological waste or during certain chemical technological processes.
Animal farming is the main source of NH3; its share in total emissions of this pollutant in 2014 amounted to 70.0 % (Fig. IV.9.2.1). Within this sector, the largest sources of NH3 emissions were categories 3B1-Dairy cattle (41.8 %), 3B3-Swine (14.6 %), 3B4gii-Broilers (4.4 %), 3B4gi-Laying hens (3.2 %) and 3B4h-Other animals (4.5 %). Further significant sources of NH3 were sector 3Da1-Inorganic N-fertilizers (includes urea application) emitting 26.6 % of total emissions of NH3. The remaining 3.4 % of NH3 emissions are produced by mobile sources equipped with catalytic converters, in which ammonia is formed by the reduction of nitrogen oxides, and technological sources. Ammonia also enters the air during the chemical production of fertilizers, the production of mineral fibres using organic binders and the production of nitric acid, etc.
The downward trend in the progression of total emissions of NH3 is connected with the decrease of the number of farm animals as a consequence of agricultural policy and the market economy (Fig. IV.9.2.2). Another reason behind the reduction of emissions was legislature concerned with the issuance of integrated permits. Within the scope of these permits, so-called good agricultural practice plans for the largest livestocks were approved and subsequently implemented. Countering this downward trend of emissions from animal farming is a slight increase of NH3 emissions from sector 3Da1, which is a consequence of a growing consumption of mineral nitrogen fertilizers.
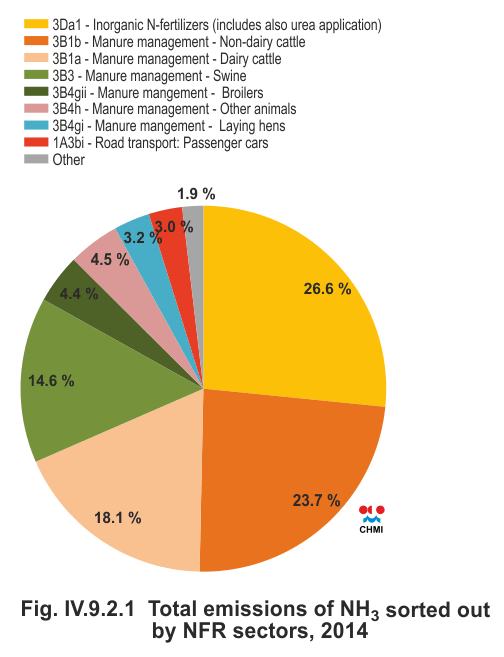
Fig. IV.9.2.1 Total emissions of NH3 sorted out by NFR
sectors, 2014
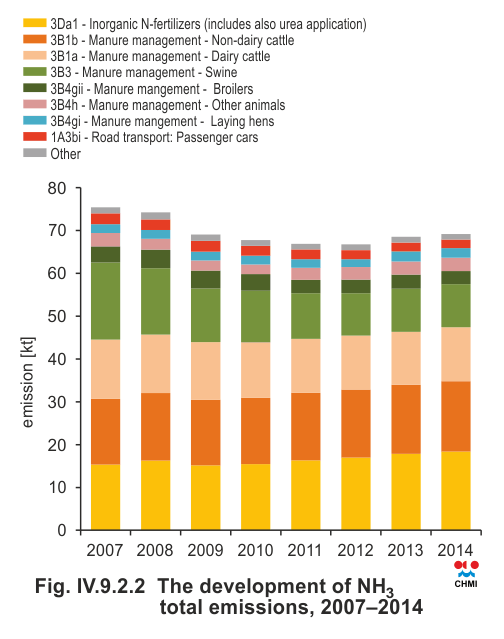
Fig. IV.9.2.2 The development of NH3 total emissions, 2007–2014
IV.9.3. Mercury
Mercury (Hg) is a persistent toxic pollutant that enters the atmosphere both from natural as well as from anthropogenic sources. The atmosphere is crucially important in the cycle of mercury. Total gaseous mercury has a relatively long residence time in the atmosphere (6 to 12 months), and its background concentrations are relatively constant even on the hemispheric scale. In the Northern Hemisphere, they are markedly higher than in the southern hemisphere, which reflects both historical and current emission trends (UN-ECE 2010).
Current results of monitoring and research into the behaviour of mercury in the atmosphere show that relatively high concentrations are measured also in the free troposphere. Mercury has exceptionally high potential for long-range and even hemispheric-scale transport, as evidenced, among other results, by measurements made in polar regions (UN-ECE 2010).
Pathological properties of mercury and its compounds are registered in the long term. Its ethyl and methyl compounds, which, moreover, have a strong tendency for bioaccumulation, are regarded as the most toxic. Exposure studies have shown that high concentrations of gaseous mercury can affect the functioning of the nervous system and the kidneys. Much more serious, however, is the fact that the potential increase of mercury concentrations in the atmosphere leads to increased atmospheric deposition in water bodies. This process results in increased concentrations of methylmercury in fish and its subsequent accumulation in food chains (Tuček 2006).
The only long-term periodic measurements of total gaseous mercury in the Czech Republic are carried out at the Košetice observatory (OBK). Manual measurements commenced in 2006 with weekly sampling according to the EMEP methodological guidelines (NILU 1995). The results of these measurements are regularly reported to the EMEP database; the frequency of measurements, however, precluded the attainment of sufficient data for the calculation of annual averages according to national legislature.
In 2013 the monitoring and research of atmospheric mercury at
the regional level in the Czech Republic was substantially
expanded within the framework of the CzechGlobe project
undertaken by the Centre for Global Climate Change Impacts
Studies of the Czech Academy of Sciences. Continuous
measurements are carried out by an automatic two-channel
analyser (Tekran Model 2537B, Tekran Inc., Toronto, Canada),
which is almost exclusively used for long-term on-line
monitoring of atmospheric mercury in international networks.
Available are hourly concentrations. In the first half of 2013,
manual and automatic measurements were made simultaneously, and
a good correlation has been found between both types of
measurements. Besides the EMEP, measurements of mercury are
since 2013 part of the GMOS global network. The aim is to
establish and operate a worldwide monitoring network focused on
monitoring atmospheric mercury. Besides terrestrial measurements,
the GMOS network also gathers experimental on-ship (oceans) and
in-flight (free troposphere) measurements.
The average annual concentration of gaseous mercury in the atmosphere, calculated from available results for the period 2006–2015 at the Košetice observatory (1.57 ng.m-3), is in agreement with the general scientific consensus regarding current background concentrations in the Northern Hemisphere (between 1.5 and 1.7 ng.m-3). No trend or annual variation was detected in the monitored period, and interannual variation does not exhibit any seasonal differences. Table IV.9.3.2 presents annual averages obtained by the automatic analyser in the period 2013–2015. Unfortunately, a number of measurement outages that occurred during this period made it possible to calculate monthly averages for only seven months; for the same reason, the annual average value is merely indicative.
Long-term monitoring is done globally within the international programmes EMEP, GAW and GMOS, and also within certain national monitoring networks (e.g. the Canadian national network). Analyses of longer data series indicate that background concentrations of mercury in the Northern Hemisphere have been slightly but continuously decreasing in the past twenty years (Weigelt et al. 2015, Cole et al. 2013, Sprovieri et al. 2010). Regional differences are insignificant in the European context.
Emissions of mercury
The main source of emissions of mercury is the
combustion of fossil fuels containing this heavy
metal. For this reason, one of the sectors with the
contributing the most to total emissions of mercury
in the year 2014 was sector 1A1a-Public electricity
and heat production (62.0 %; Fig. IV.9.3.1).
A significant amount of mercury was emitted into
the air by the production of iron and steel, which
is comprised under sectors 2C1-Iron and steel production
(7.5 %) and 1A2a-Stationary combustion
in manufacturing industries and construction: Iron
and steel (5.3 %). Mercury is also emitted into the
air by activities belonging to sector 1A2f-Stationary
combustion in manufacturing industries and construction:
Non-metallic minerals (4.7 %) and originated
mainly from the process of baking cement
clinker. Emissions of mercury produced during
the production of chlorine, 1,2-dichloroethane and
vinyl chloride are included in sector 2B10a-Other.
The contribution of this sector to total emissions
of mercury was 2.4 %. The downward trend of
emissions of mercury in the period of 2007–2014 is
related to the progression of emissions of suspended
particles (Chapter IV.1.3), to which mercury binds,
and also depends on the varying content of mercury
in coal (Fig. IV. 9.3.2).
Tab. IV.9.3.1 Stations measuring mercury in the ambient air with the values of concentrations, 2015
Tab. IV.9.3.2 Annual course of average monthly concentrations of mercury at station Košetice
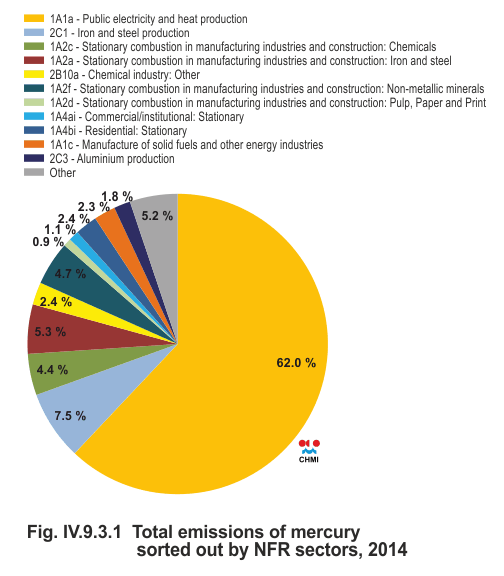
Fig. IV.9.3.1 Total emissions of mercury sorted out by NFR
sectors, 2014
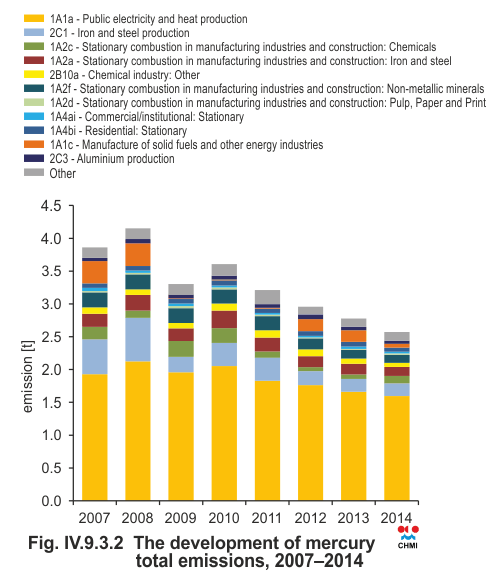
Fig. IV.9.3.2 The development of mercury total emissions,
2007–2014