IV.8 CARBON MONOXIDE
IV.8.1 Air pollution caused by carbon monoxide in the year 2015
In 2015, as in previous years, the 8-hour ambient limit for carbon monoxide (CO) was not exceeded in the Czech Republic at any of the 21 localities from which sufficient amounts of data allowing the assessment of air quality were available. Measurements were taken at a total of 27 localities (Table XIII.23). The highest 8-hour daily average concentration of CO was measured at the locality Ostrava-Radvanice ZÚ (4,427 μg.m-3), the ambient limit being 10,000 μg.m-3. This city quarter is exposed to heavy loads from industry, traffic and local sources. The second highest 8-hour concentration of CO (4,226 μg.m-3) was recorded at the Otrokovice- město station, which is classified as a traffic station, meaning that the concentrations measured there are influenced by traffic. The third highest 8-hour concentration of this pollutant was measured at the rural locality Tobolka-Čertovy schody (2,715 μg.m-3), where an influence of the nearby Vápenka Čertovy schody limeworks can be assumed. CO is generated during the production of lime.
Increased concentrations of CO occur especially at urban localities affected by road traffic. Monitoring of this pollutant has therefore been retained at stations classified as traffic stations. At urban and rural background localities, concentrations of CO vary deep under the ambient limit.
IV.8.2 Development of carbon monoxide concentrations
Fig. IV.8.1 shows the apparent decreasing trend of maximum 8-hour concentrations of CO at most localities in the Czech Republic. In 2015, CO concentrations were comparable with the previous year. At most stations, there was an apparent decrease, e.g. at the localities Ostrava-Českobratrská, Ostrava-Přívoz, Beroun and Plzeň-střed. Other stations, conversely, recorded increases in CO concentrations, e.g. Otrokovice-město and Brno-Zvonařka.
IV.8.3 Emissions of carbon monoxide
Emissions of CO are produced during the combustion of carbon-containing fuels at low temperatures and under a shortage of combustion air. The greatest amount of CO emissions is produced in sector 1A4bi-Local household heating; the contribution of this sector to total countrywide CO emissions in 2014 amounted to 50.2 % (Fig. IV.8.2). Further significant sources included sectors 1A2a-Stationary combustion in manufacturing industries and construction: Iron and steel production (20.4 %), 1A3bi-Passenger car transport (9.6 %) and 1A3biii-Road freight transport over 3.5 t (4.4 %). The downward trend of CO emissions in the years 2007–2014 was caused primarily by renewal of the car fleet and a decrease of iron and steel production after the year 2007. Because of the prevailing influence of sector 1A4bi, this trend is strongly influenced by the course of temperatures during heating seasons (Fig. IV.8.3).
In individual parts of the Czech Republic, the contributions
of different types of sources to the total
emissions varies depending on the particular energy
mix in each given region. Due to the prevailing share of
the local household heating sector, CO emissions are
distributed across populated areas in the Czech Republic.
The influence of transport has its prevailing
impact along motorways, roads with heavy traffic
volumes and in large cities. A large amount of CO
emissions in the O/K/F-M agglomeration come from
the production of iron and steel
(Fig. IV.8.4).
Tab. XIII.23 Stations with the highest values of maximum 8-hour running average concentrations of CO
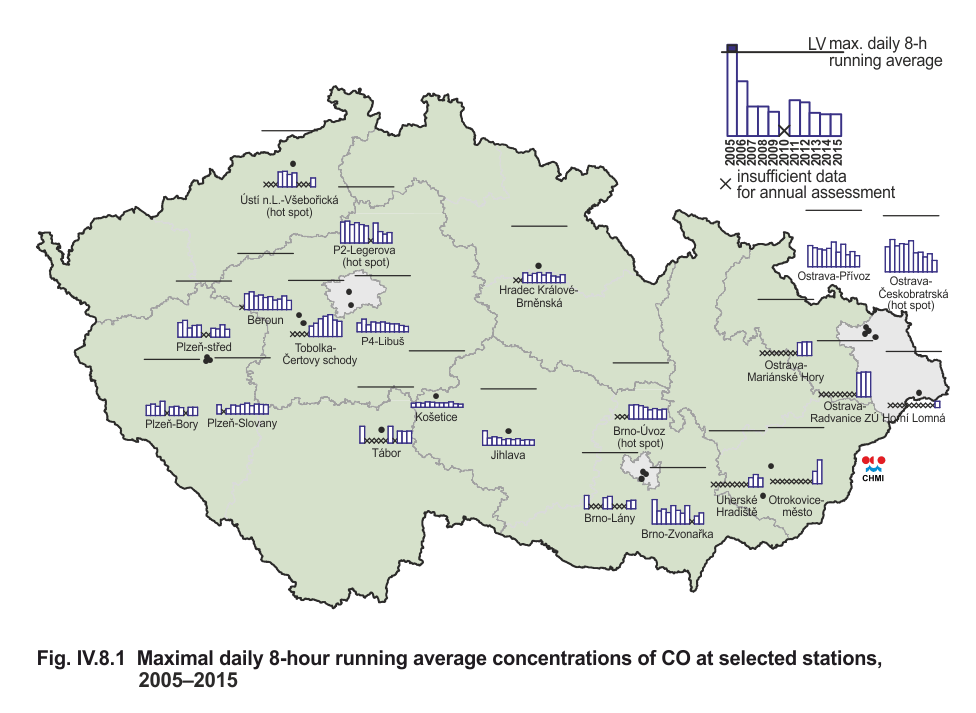
Fig. IV.8.1 Maximum daily 8-hour running average
concentrations of CO at selected stations, 2005–2015
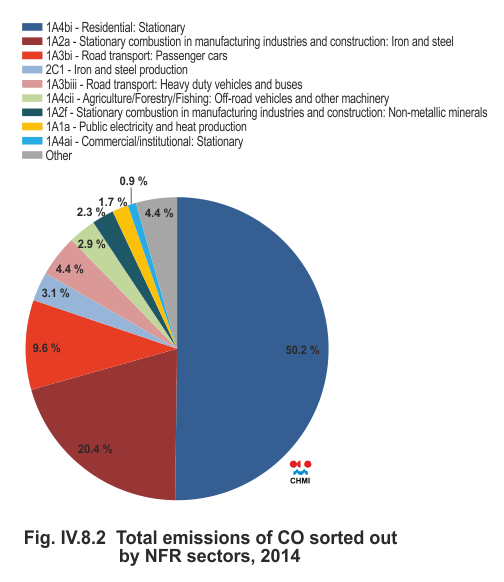
Fig. IV.8.2 Total emissions of CO sorted out by NFR sectors,
2014
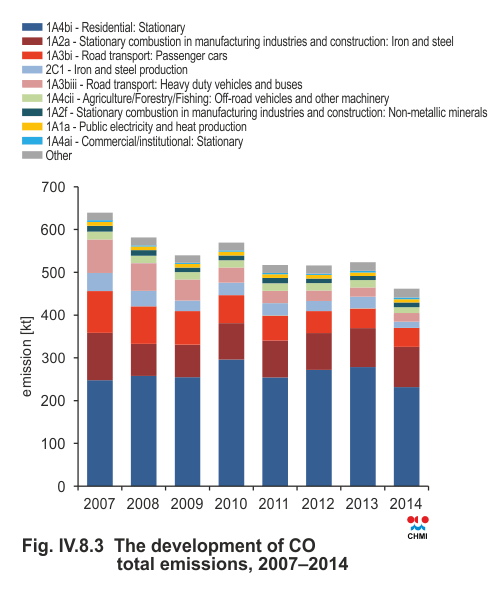
Fig. IV.8.3 The development of CO total emissions, 2007–2014
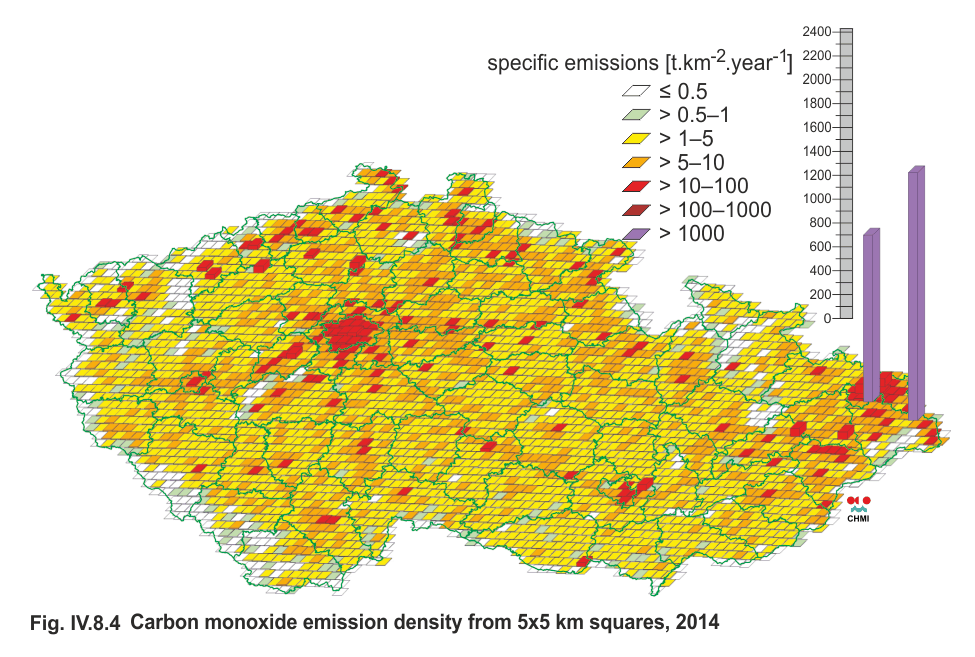
Fig. IV.8.4 Carbon monoxide emission density from 5x5 km squares,
2014