IV.7 SULPHUR DIOXIDE
IV.7.1 Air pollution caused by sulphur dioxide in the year
2015
Air pollution caused by sulphur dioxide in the year 2015 with regard to the limit values for the protection of human health
In 2015 neither the limit value for the hourly sulphur dioxide (SO2) concentration nor for the 24-hour SO2 concentration was exceeded in the Czech Republic at any monitoring station (Tables XIII.18 and XIII.19). Four stations detected 1-hour concentrations of SO2 exceeding the limit value of 350 μg.m-3; however, the permissible number of exceedances of 24 was not overstepped (Měděnec, Nová Víska u Domašína and Lom in the Ústí nad Labem region, and Dolní Rychnov in the Karlovy Vary region). It can be assumed that measurements at these stations are influenced by important energy and industrial sources located in the Podkrušnohorská basin and the Sokolov basin.
The highest 1-hour concentrations of SO2 were detected at the Měděnec station, where four exceedances of the limit value occurred over the course of the year in night or morning values of 2 November 2015. Concentrations of SO2 reached values of 360 to 666 μg.m-3. Three exceedances of the ambient limit occurred at the locality Nová Víska u Domašína (471 μg.m-3, 452 μg.m-3 and 376 μg.m-3). These episodes in which limit values for SO2 were exceeded were at both localities probably caused by the impact of a smoke plume from the Prunéřov power plant. This is supported by the fact that only a weak easterly wind blew during the mentioned episodes. Hourly limit-exceeding concentrations of SO2 were also detected at the stations Lom (395 μg.m-3) and Dolní Rychnov (357 μg.m-3). The increase in hourly concentrations of SO2 at the station Lom on 6 November 2015 led to the announcement of a smog situation (for details, see Chapter VI.).
The 25th highest SO2 concentration reached its maximum values at the stations Lom (133 μg.m-3), Ostrava-Radvanice ZÚ (135 μg.m-3), Krupka (120 μg.m-3) and Dolní Rychnov (130 μg.m-3). The maximum 24-hour concentrations of SO2 did not exceed the limit value of 125 μg.m-3 (e.g. Ostrava- Radvanice ZÚ 108 μg.m-3, Krupka 105 μg.m-3, Měděnec 98 μg.m-3). The 4th highest 24-hour SO2 concentration reached its maximum values at the stations Ostrava-Radvanice ZÚ 82 μg.m-3, Krupka (61 μg.m-3) and Petrovice u Karviné (59 μg.m-3). In 99.9 % of the Czech Republic territory, 24-hour concentrations of SO2 were below the lower assessment threshold (LAT). Only in 0.1 % of the Czech Republic territory concentrations exceeded the LAT, mainly in the Ústí nad Labem region, in part of the Podkrušnohorská basin in the Most district and the Teplice district (Fig. IV.7.1).
Considering the decrease in concentrations between 2014 and 2015, most of the area of the Czech Republic (63.5 %) is not exposed to SO2 concentrations exceeding the WHO guideline limit for the pro- tection of human health. In other words, the 24-hour average concentration of 20 μg.m-3 was not exceeded on 63.5 % of the country’s territory in 2015.
Air pollution in 2015 by sulphur dioxide with regard
to limit values for the protection of ecosystems
and vegetation
In 2015 neither the limit value for the annual average concentration nor the limit value for the winter average concentration was exceeded at rural locali- ties (Tables XIII.21 and XIII.22). The highest winter average concentration in 2015 was recorded at the localities Krupka (13.2 µg.m-3), Sněžník (10.4 µg.m-3), Lom (9.9 µg.m-3) and Věřňovice (9.3 µg.m-3). The annual average concentration reached its maxi- mum at the localities Horní Lomná (15.5 µg.m-3), Krupka (10.3 µg.m-3) and Lom (9.1 µg.m-3). However, the station Horní Lomná was placed next to a secondary residence, which might have interfered with the measurements.
In 2015 the upper assessment threshold (UAT) for annual average concentrations of SO2 was exceeded only in small parts of the Ústí nad Labem region, the Karlovy Vary region, the Moravia-Silesia region and the Olomouc region (Fig. IV.7.5). Also exceeded in the same areas (except from the Olomouc region) was the UAT for average concentrations for the winter period 2015/2016 (Fig. IV.7.6).
Both maps (Fig. IV.7.5 and Fig. Fig. IV.7.6) were constructed using data from all background stations measuring SO2, with regard to their classification. Point marks on the maps indicate only rural stations because winter and annual average concentrations of SO2 are assessed at these localities only, also due to the ambient limit for the protection of ecosystems and vegetation.
IV.7.2 Development of sulphur dioxide concentrations
There was a marked decrease of ambient SO2 concentrations after the year 1998 in connection with the coming into force of Act No. 309/1991 Coll. and the meeting of required emission limit values. Since then, the annual average concentrations of this pollutant have not exceeded the set limit value of 20 μg.m-3 at rural stations. In 2008 there was a further decrease of air pollution caused by SO2 in the whole territory of the Czech Republic. In 2009 and 2010, on the contrary, a slight increase of air pollution caused by SO2 was recorded. From 2011 to 2015, a further decreasing trend is apparent (Fig. IV.7.3).
In 2000–2015 there was an overall decrease of SO2 concentrations (by approx. 30–50 % depending on the respective air pollution characteristic; Fig. IV.7.4).
The trend of SO2 concentrations is caused by a decrease of emissions, desulphurisation of coal-fired power plants and a change in the fuels used (see the trends in the development of emissions in Chapter II). Year-to-year fluctuations of concentrations are also influenced by differing meteorological conditions in particular years.
Development of sulphur dioxide concentrations with regard to the limit
values for the protection of human health
Since 2005 there is an apparent decreasing trend in the development of the 4th highest 24-hour and 25th highest 1-hour concentrations of SO2 at selected localities (Fig. IV.7.2). In 2015, compared to the year 2014, these values decreased at most localities. A decrease of SO2 concentrations in comparison with the previous year was recorded, for example, at the stations Studénka, Sokolov and Teplice. Conversely, a rise in concentrations of SO2 occurred at the stations Krupka, Výslunní and Zlín-Svit.
Development of sulphur dioxide concentrations with regard to the limit
values for the protection of ecosystems and vegetation
Both the annual and the winter average of SO2 concentrations at rural stations show an apparent gradual downward trend (IV.7.7 and IV.7.8). In 2015, as against the previous year, annual as well as winter concentrations of SO2 decreased at most rural localities. A particularly apparent decrease was recorded at the stations Lom, Měděnec and Studénka. Conversely, an increase of SO2 concentrations is observable at the stations Krupka and Churáňov.
IV.7.3 Emissions of sulphur dioxide
Emissions of SO2 are created mainly during the combustion of sulphur-containing solid fossil fuels. In 2014, 63.6 % of SO2 emissions on the countrywide scale came from sector 1A1a-Public electricity and heat production, and 10.7 % were contributed by sector 1A4bi-Residential stationary combustion contributed (Fig. IV.7.9). The decrease of SO2 emissions between the years 2007 and 2008 in sector 1A1a-Public electricity and heat production resulted from the implementation of the obligation to comply with emission ceilings for LCP sources (Fig. IV.7.10). Since 2008 the emissions of SO2 have remained approximately at the same level, with a more pronounced decrease between the years 2012 and 2013. Due to the prevailing influence of the public electricity and heat production sector, SO2 emissions are concentrated in the Ústí nad Labem region, the Moravia-Silesia region and the Central Bohemia region, where the largest producers of energy are located (Fig. IV.7.11).
Tab. XIII.18 Stations with the highest values of the 25th and maximum hourly concentrations of SO2
Tab. XIII.19 Stations with the highest numbers of exceedances of the 24-hour limit value of SO2
Tab. XIII.20 Stations with the highest values of annual average concentrations of SO2
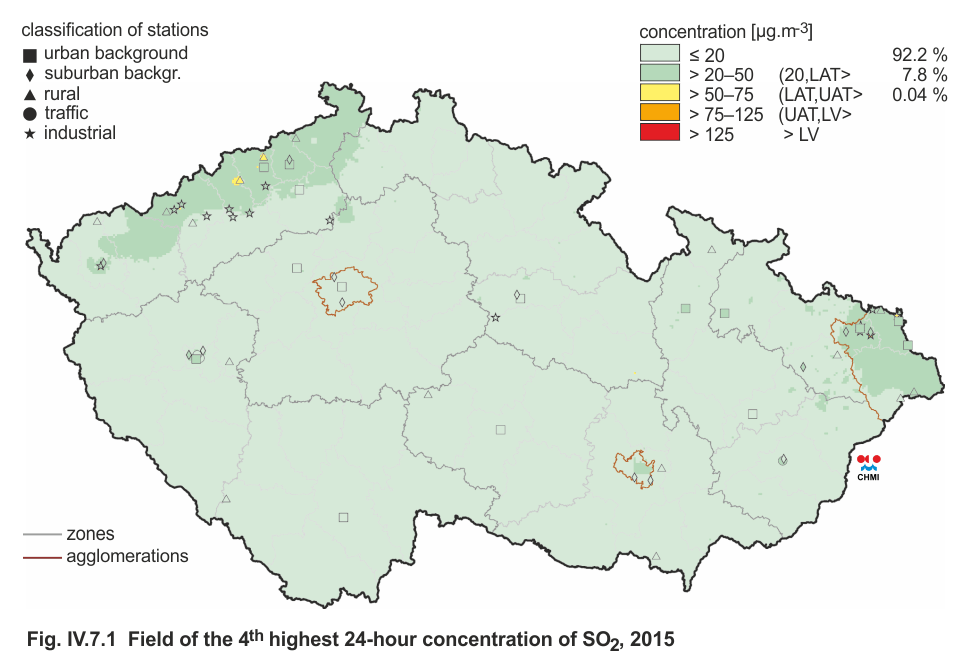
Fig. IV.7.1 Field of the 4th highest 24-hour concentration
of SO2, 2015
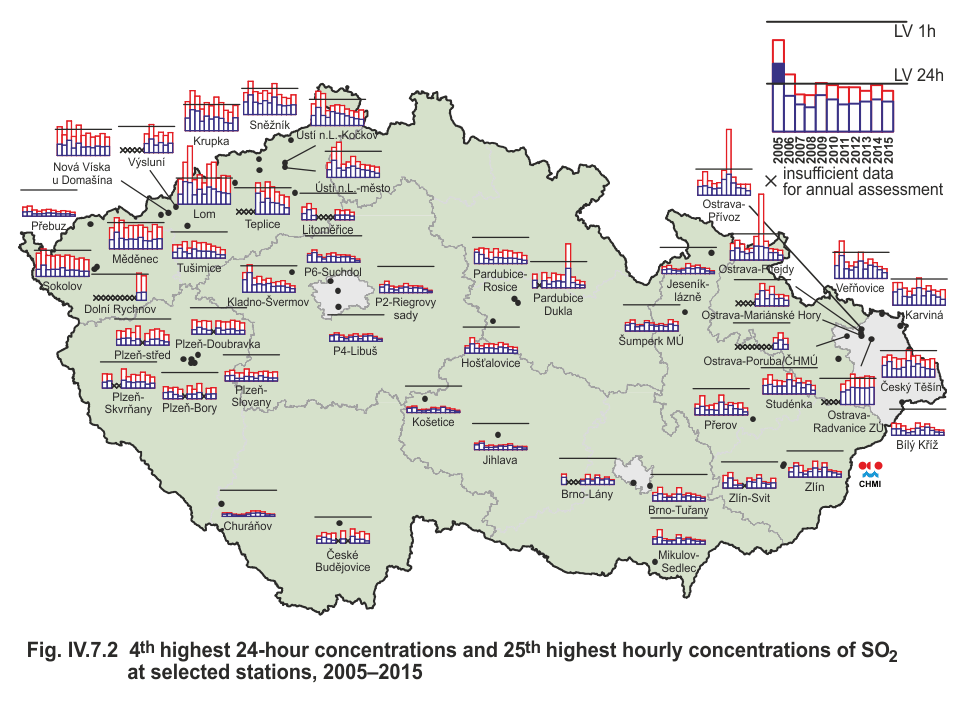
Fig. IV.7.2 4th highest 24-hour concentrations and 25th highest
hourly concentrations of SO2 at selected stations, 2005–2015
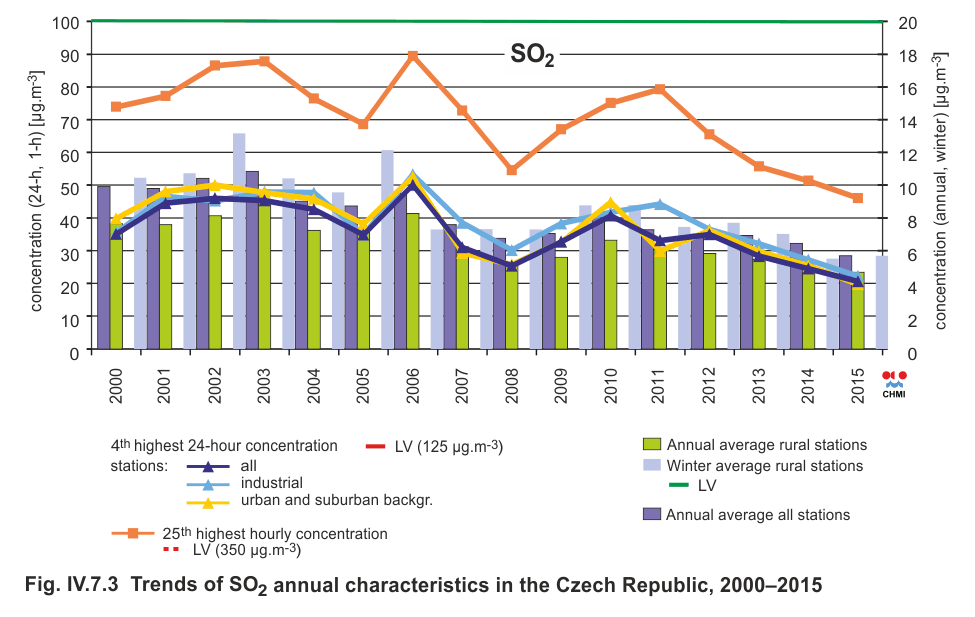
Fig. IV.7.3 Trends of SO2 annual characteristics in the Czech
Republic, 2000–2015
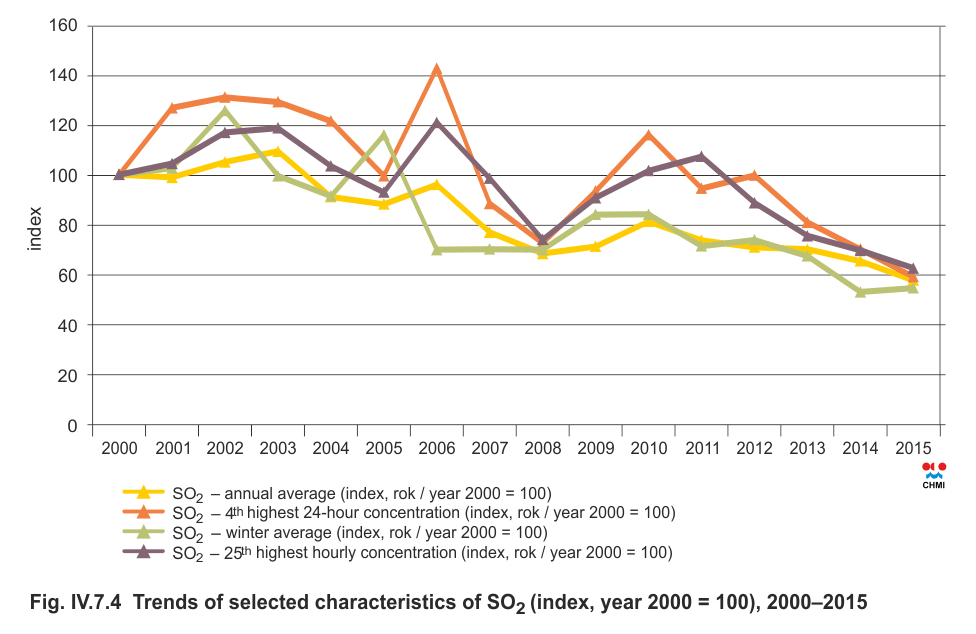
Fig. IV.7.4 Trends of selected characteristics of SO2 (index,
year 2000 = 100), 2000–2015
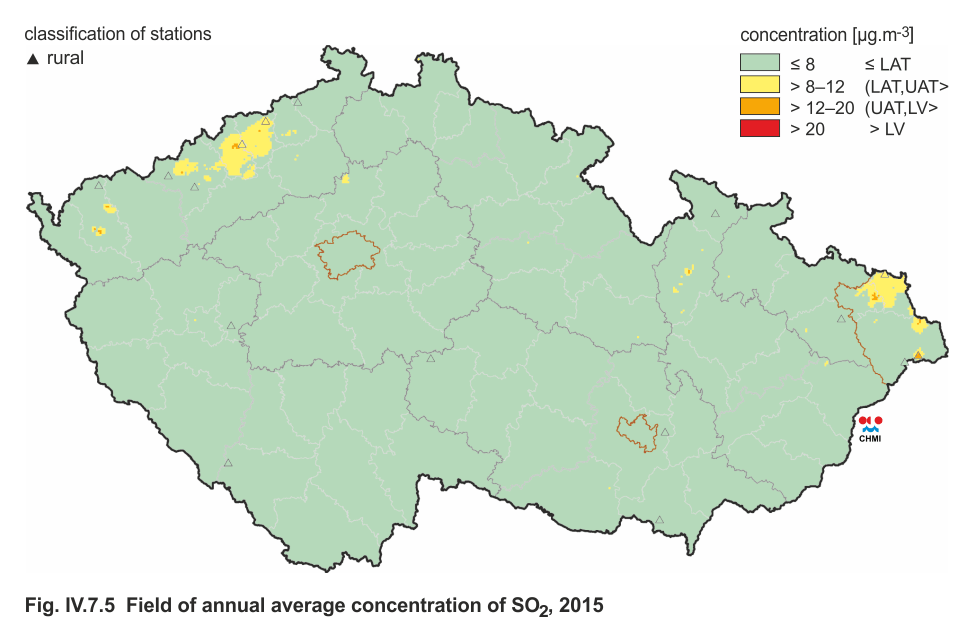
Fig. IV.7.5 Field of annual average concentration of SO2, 2015
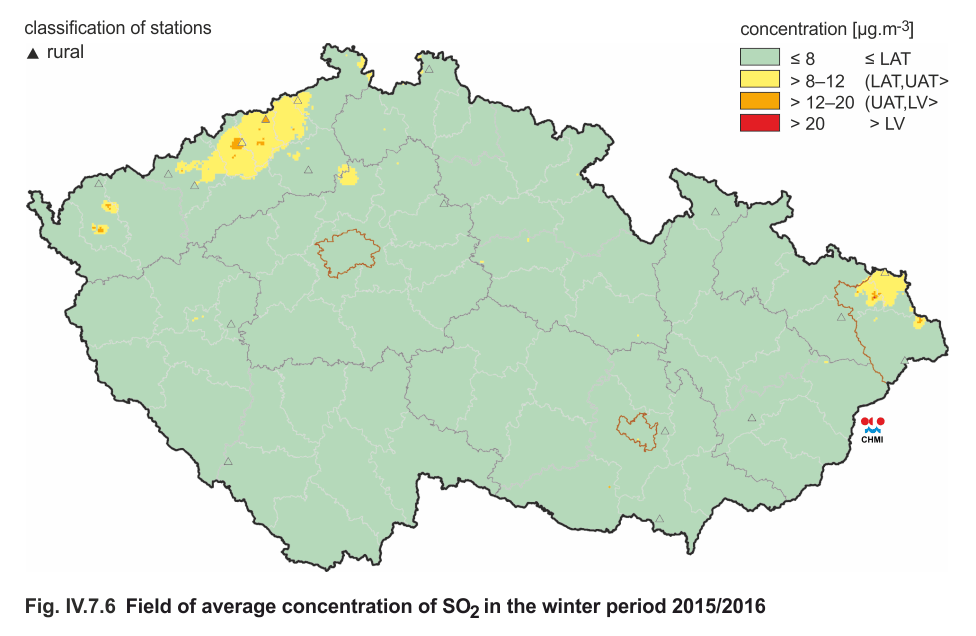
Fig. IV.7.6 Field of average concentration of SO2 in the winter
period 2015/2016
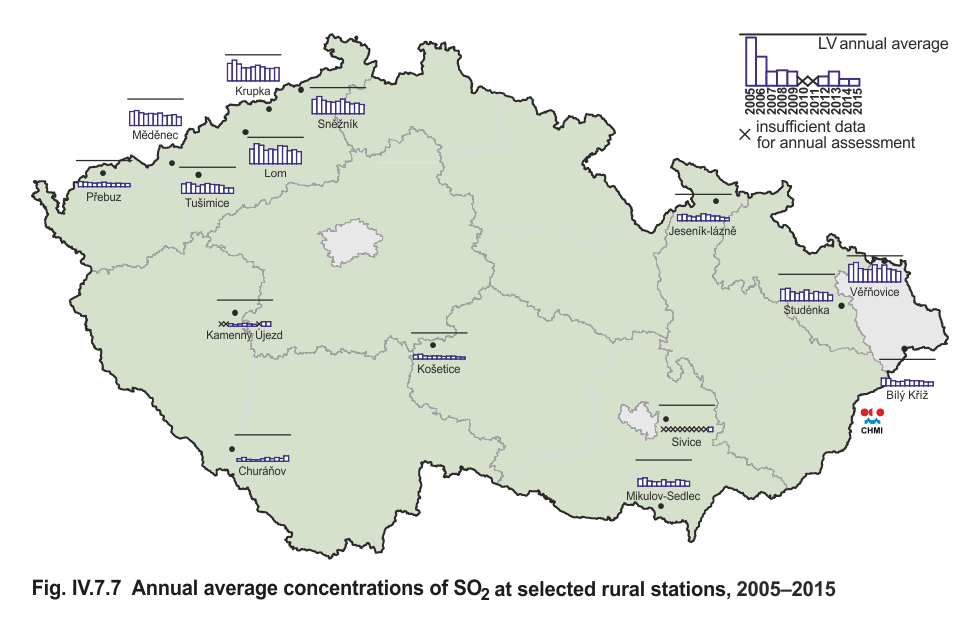
Fig. IV.7.7 Annual average concentrations of SO2 at selected
rural stations, 2005–2015
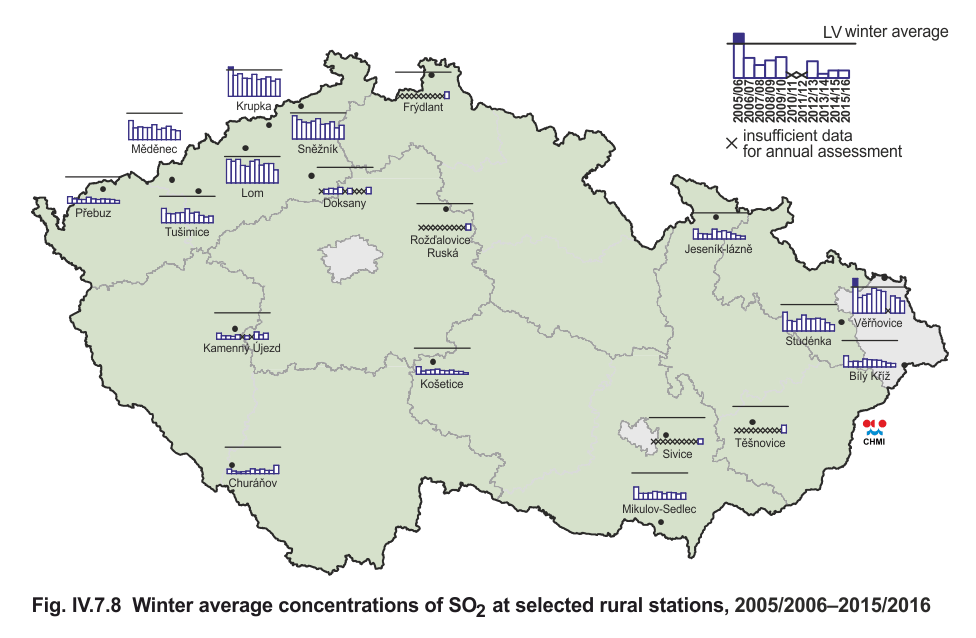
Fig. IV.7.8 Winter average concentrations of SO2 at selected
rural stations, 2005/2006–2015/2016
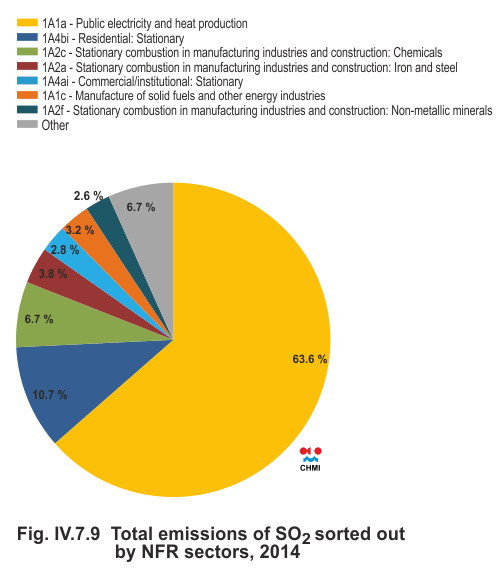
Fig. IV.7.9 Total emissions of SO2 sorted out by NFR sectors,
2014
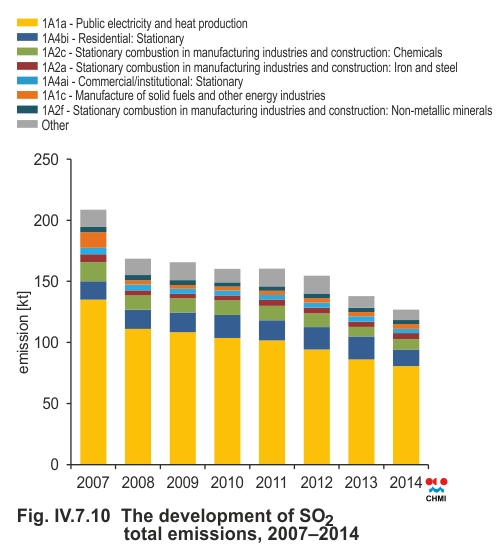
Fig. IV.7.10 The development of SO2 total emissions, 2007–2014
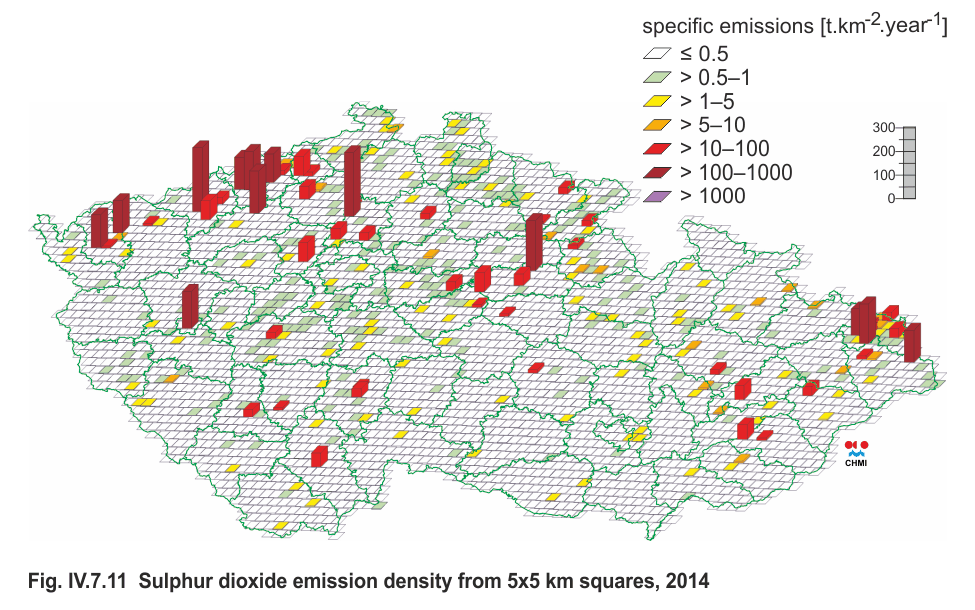
Fig. IV.7.11 Sulphur dioxide emission density from 5x5 km
squares, 2014