IV.4 GROUND-LEVEL OZONE
IV.4.1 Air pollution caused by ground-level ozone in the year
2015
Air pollution caused by ground-level ozone in the year 2014 with regard to the limit values for the protection of human health
In the three-year period 2013–20151, the ambient limit for ground-level ozone was exceeded at 22 % of localities, i.e. at 16 localities out of the 72 where concentrations of O3 were measured (Table XIII.10 and Fig. IV.4.5). In comparison with the previous threeyear period 2012–2014, the number of exceedances of the ambient limit increased at 81 % of localities (56 localities), 9 % (6 localities) recorded decreases, and 10 % (7 localities) did not record any change.
Comparison of the two three-year periods under assessment shows emission precursors and meteorological conditions, i.e. the intensity of solar radiation, temperature and precipitation or relative humidity, play important roles (Blanchard et al. 2010; Ooka et al. 2011). However, the relationship between the amount of emitted precursors and ground-level ozone concentrations is not linear. This non-linearity is caused by long-range transport of O3 and its precursors, besides other factors including climate change, emissions of non-metallic volatile compounds NMVOC from vegetation and forest fires (EEA 2013a). Considering the rather complicated atmospheric chemical processes involved in ozone formation and disintegration, its dependence on the absolute amounts and the relative shares of its precursors in the atmosphere, which are also associated with long-range transport and meteorological conditions (Chap. IV.4.3), it is difficult to comment on year-to-year changes in more detail.
The lowest concentrations of O3 are measured at traffic stations, where ozone is degraded by a chemical reaction with NO (see Chapter IV.4.3). It can be assumed that ozone concentrations are below the limit value also in other areas with heavy traffic loads, where, however, due to the absence of measurements, the probable decrease cannot be documented by the use of current methods of map construction. Conversely, the highest concentrations are measured at rural background localities (Table XIII.10). The limit value for O3 was exceeded in the three-year period 2013–2015 in 26.8 % of the territory of the Czech Republic, inhabited by approx. 9.5 % of the population (Fig. IV.4.1).
In comparison with the previous period 2012–2014, the area of the affected territory increased by 21.2 % (from 5.6 %). The reason behind the increase in O3 concentrations and the expansion of the affected area was the hot summer of 2015 with favourable meteorological conditions for the accumulation and maintenance of high concentrations of O3. In 2015 the guideline value recommended by the WHO for the maximum daily 8-hour running average of O3 concentrations (100 µg.m-3) was exceeded throughout the territory of the Czech Republic.
In 2015 the informative threshold value for O3 (i.e. the hourly average concentration of 180 µg.m-3) was exceeded more frequently than in previous years due to more frequent hot summer days (Table XIII.12; Chapter VI.).
The annual progression of average monthly concentrations of O3 (max. 8-hour running average for the given month) is characterized by an increase of concentrations in spring and summer months (Fig. IV.4.3), caused by conditions favourable for ozone formation such as high-intensity solar radiation, high temperatures and low air humidity. As in other cases, the highest maximum 8-hour running averages are recorded at rural localities, where the most frequent exceedances of the limit value occur (Fig. IV.4.5).
Air pollution caused by ground-level ozone in the year 2015 with regard to the
limit values for the protection of ecosystems and vegetation
The ambient limit concentration of O3 for the protection of vegetation of 18,000 μg.m-3.h was exceeded at five localities out of the total number 35 of rural and suburban stations, for which the calculation of the AOT40 exposure index (average over the years 2011–2015)2 was relevant according to the legislature. This applied to the stations Štítná nad Vláří, Kuchařovice, Mikulov-Sedlec, Tobolka-Čertovy schody and Červená hora (Table XIII.11). As compared with the previous evaluated five-year period 2010–2014, the number of localities with exceedances increased from 9 % (3 localities) to 15 % (5 localities) of the total number 35 localities evaluated in both periods. Increases of the value of the AOT40 exposure index for the year 2015 as compared with the year 2014 were recorded at 80 % of localities (28 localities), while decreases were recorded at 20 % of localities (7 localities).
IV.4.2 Development of ground-level ozone concentrations
Since 2000, there has been a downward trend in the 26th highest daily maximum 8-hour running average of O3 concentrations; three years, however, escaped this trend, namely 2003 (i.e. average for the three-year period 2001–2003), 2006 (i.e. average for the period 2004–2006) and 2015 (average for the period 2013–2015). In 2003 the 26th highest value of the maximum 8-hour running average reached the highest level for the whole monitored period (Fig. IV.4.6). The year 2003 was characterized by markedly above-average concentrations of ground-level ozone throughout Europe (Sicard et al. 2011; Cristofanelli et al. 2007; Pires et al. 2012) with above-average temperatures in the summer period (EEA 2014). The years 2003 and 2006 were characterized by favourable conditions for the formation of ground-level ozone. Up until 2008, there were several years with exceedances of the ambient limit. In the following years, the 26th highest values of the maximum 8-hour average stayed below the limit value, but in 2015 the ambient limit was again exceeded. This evaluation apparently shows that higher values are usually reached at rural localities as against urban and suburban background localities (Fig. IV.4.6).
A downward trend of ground-level ozone concentrations was recorded not only in Europe (Sicard et al. 2013; EEA 2013a), but also in USA (Butler et al. 2011). In the years 1990–2010, stations in Europe and USA also recorded decreases of the differences between concentrations measured at rural localities and at urban localities (Paoletti et al. 2014). Simultaneously, these stations recorded decreases of the maximum values measured. This decrease of O3 concentrations is attributed i.a. to the reduction of emission of its precursors, mainly NOx, in developed countries (Sicard et al. 2013).
In 2015, the AOT40 exposure index (five-year average for the years 2011–2015) exhibited an increase for the second time in a row (Fig. IV.4.8 and Fig. IV.4.8).
IV.4.3 Formation of ground-level ozone
Ozone (O3) has no significant source of its own in the atmosphere. Ozone is a so-called secondary substance produced during a number of very complicated non-linear photochemical reactions described in detail e.g. by Seinfeld and Pandis (2006). Ozone precursors include nitrogen oxides (NOx) and non-methanic volatile organic compounds (NMVOC), and at the global scale also methane (CH4) and carbon moNOxide (CO) take their part in the process. Photo-lysis of NO2 by radiation of 280–430 nm in wavelength is the principal reaction, during which NO and atomic oxygen are formed. During the reaction of atomic and molecular oxygen, in the presence of a catalyst, O3 molecules are formed. Simultaneous titration of O3 by NO results in the formation of NO2 and O2. If in this reaction O3 is replaced with radicals, its concentrations in the atmosphere grow. A significant role in these reactions is played mainly by the OH-radical.
NOx are formed during all combustion processes. NMVOC are emitted from a whole number of anthropogenic sources (transport, manipulation with crude oil and its derivatives, refineries, paint and solvent use etc.), but also natural sources (e.g. biogenic emissions from vegetation).
During the formation of O3 from its precursors, not only the absolute amount of the precursors is important, but also their mutual proportion (Sillman et al. 1990; Fiala, Závodský 2003). In areas where ozone formation is limited by NOx, characterized by relatively low concentrations of NOx and high concentrations of VOC, O3 concentrations grow with the growing concentrations of NOx, while with growing VOC concentrations they change only a little. On the contrary, in areas where O3 formation is limited by VOC, O3 concentrations decrease with growing NOx concentrations, and they increase with growing VOC concentrations. Areas where the proportion between NOx and VOC is high are typically polluted areas around the centres of large cities. The dependence of the formation of O3 on the initial concentrations of VOC and NOx is often depicted by diagrams of ozone isopleths which show the maximum ozone concentrations reached as the function of initial concentration of NOx and VOC (Moldanová 2009). A significant role in the formation of ozone is played not only by its precursors, but also by meteorological conditions (Colbeck, Mackenzie 1994). Ambient air pollution concentrations of O3 grow with increasing ultraviolet radiation and temperature, while, conversely, they decrease with increasing relative humidity.
High ozone concentrations are usually related to long-lasting
anticyclonic situations. In addition to the photochemical
mechanism described above, O3 concentrations may also occur
episodically when stratospheric ozone reaches the troposphere
and also during storms. Recently increasing is the significance
of long-range transport of O3 from source areas in south-east
Asia to Europe and North America by air currents within the
Northern Hemisphere. Ozone is removed from the atmosphere by a
reaction with NO and by dry deposition.
Tab. XIII.11 Stations with the highest AOT40 values of ozone at rural and suburban stations
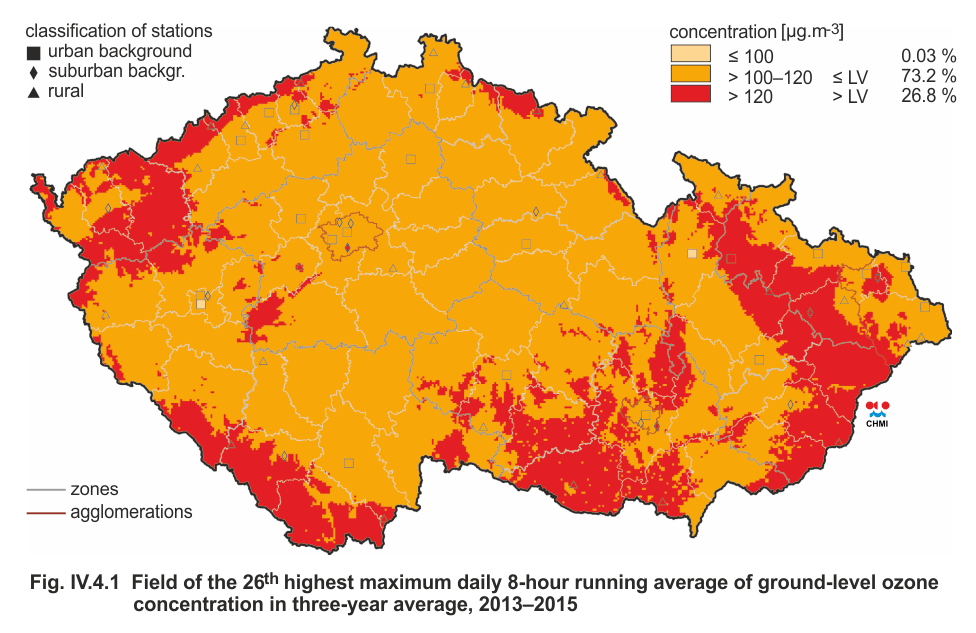
Fig. IV.4.1 Field of the 26th highest maximum daily 8-hour
running average of ground-level ozone concentration in three-year
average, 2013–2015
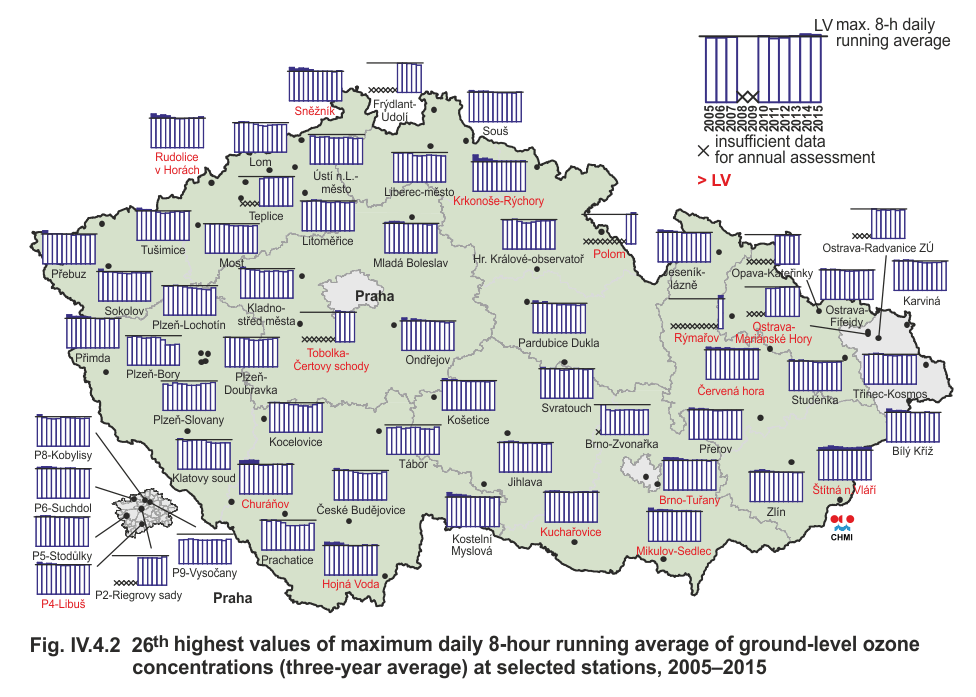
Fig. IV.4.2 26th highest values of maximum daily 8-hour running
average of ground-level ozone concentrations (three-year average)
at selected stations, 2005–2015
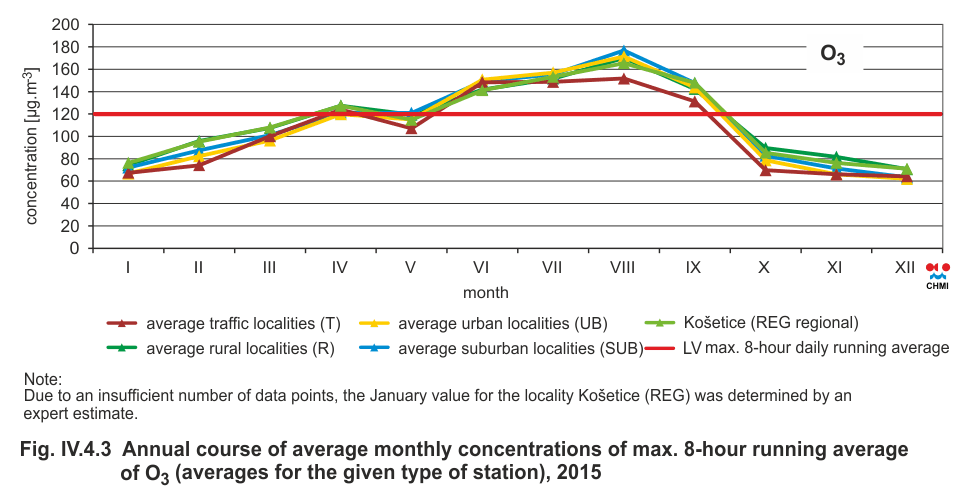
Fig. IV.4.3 Annual course of average monthly concentrations of
max. 8-hour running average of O3 (averages for the given type
of station), 2015
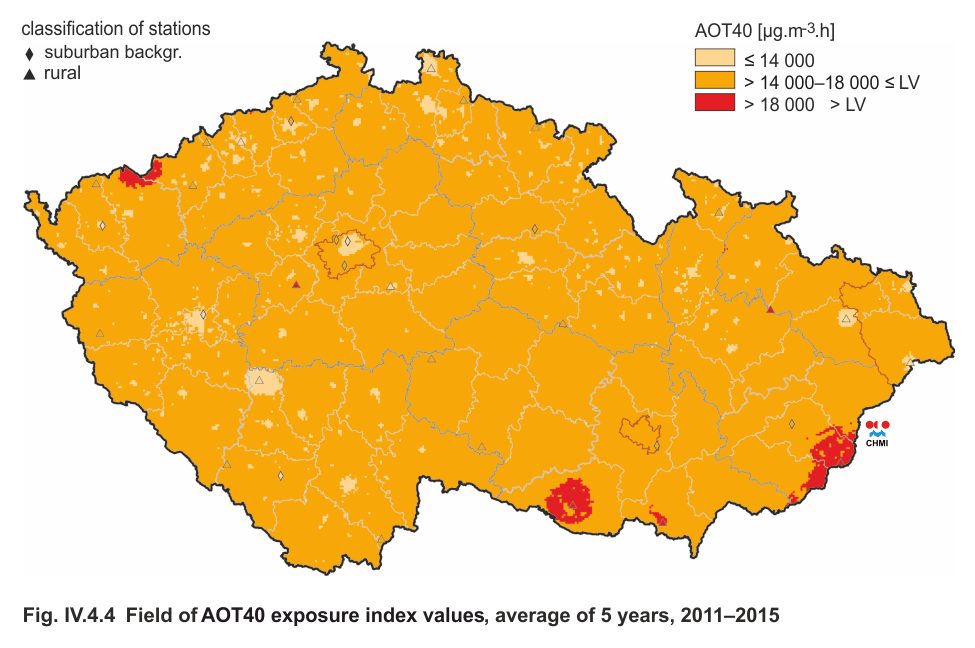
Fig. IV.4.4 Field of AOT40 exposure index values, average of 5
years, 2011–2015
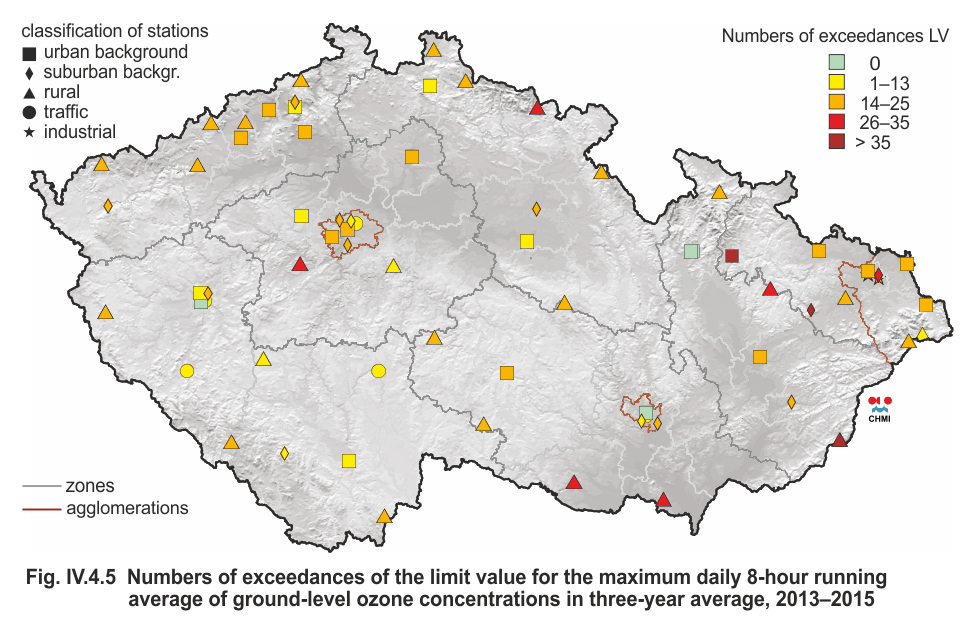
Fig. IV.4.5 Numbers of exceedances of the limit value for the
maximum daily 8-hour running average of ground-level ozone
concentrations in three-year average, 2013–2015
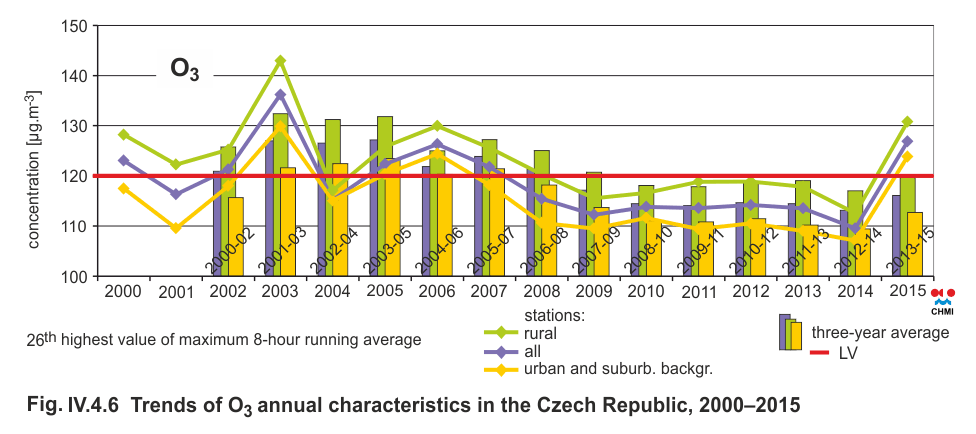
Fig. IV.4.6 Trends of O3 annual characteristics in the Czech
Republic, 2000–2015
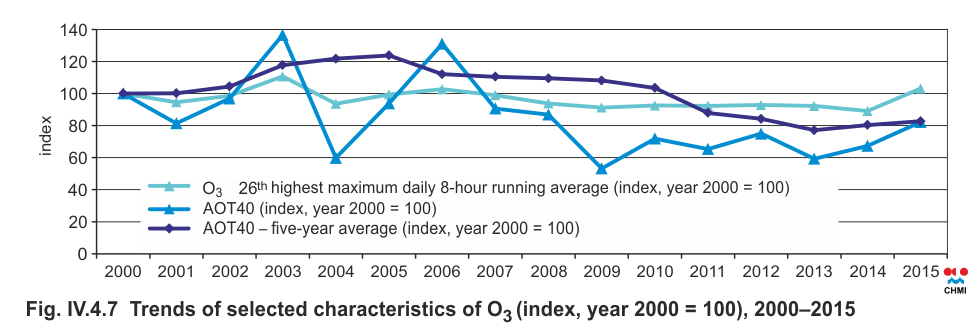
Fig. IV.4.7 Trends of selected characteristics of O3 (index,
year 2000 = 100), 2000–2014
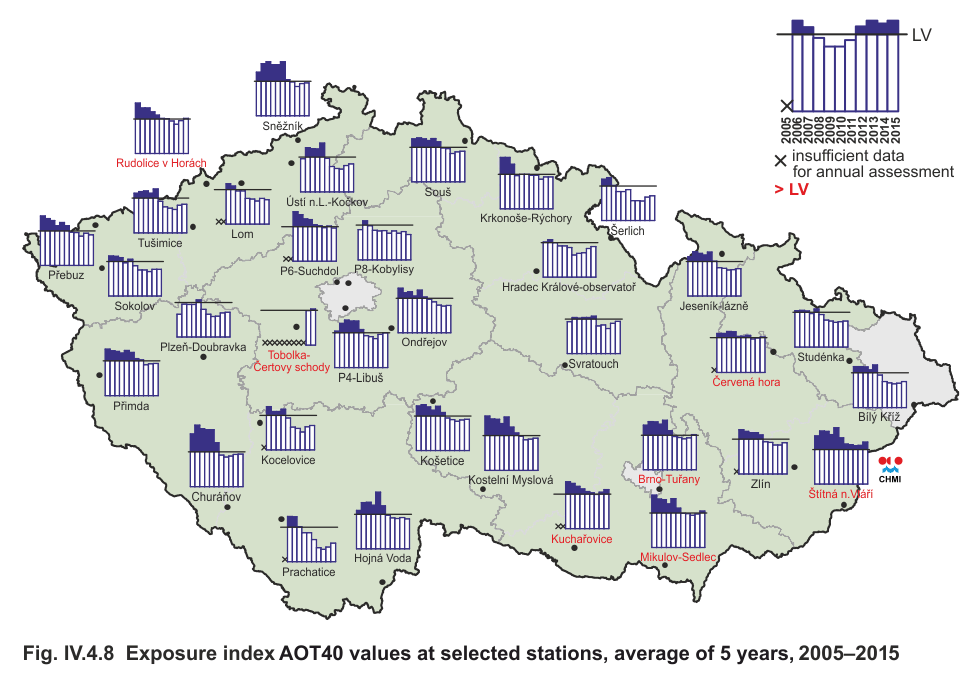
Fig. IV.4.8 Exposure index AOT40 values at selected stations,
average of 5 years 2005–2015
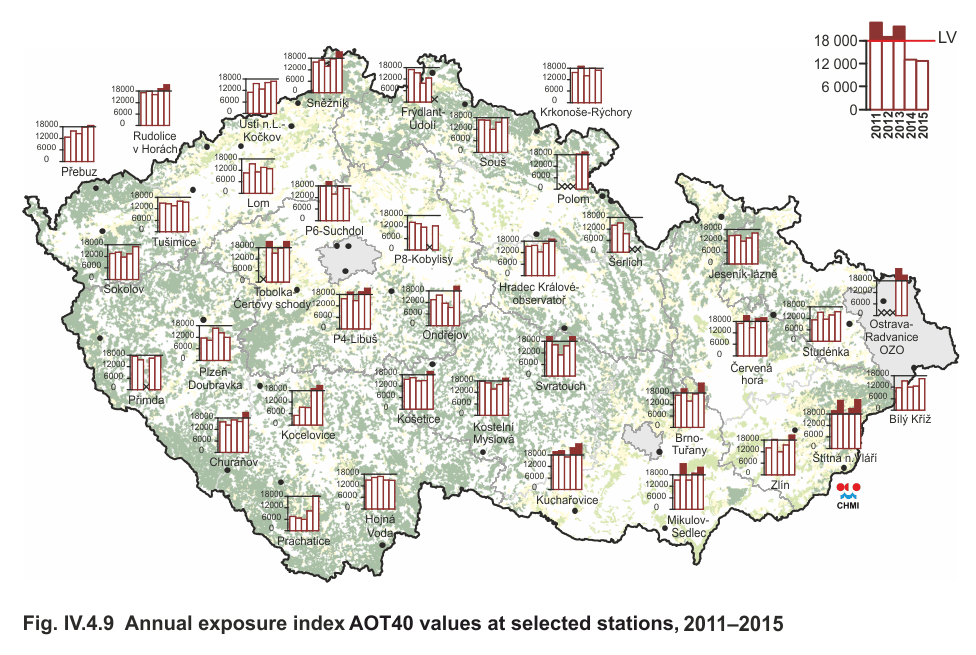
Fig. IV.4.9 Annual exposure index AOT40 values at selected
stations, 2011–2015
1 Annual ambient limit is exceeded if the maximum daily 8-hour running average of O3 is greater than 120 μg.m-3 at least 26 times on average over three years.
2 For assessing the protection of vegetation against excessive concentrations of ozone, the national legislature, in line with the relevant EU regulation, the AOT40 exposure index. The cumulative exposure to ozone AOT40 is calculated as the sum of differences between the hourly concentration of ozone and the threshold level of 80 μg.m-3 (= 40 ppb) for each hour in which this threshold was exceeded. As per the requirements of Government Decree No. 597/2006 Coll., the AOT40 index is calculated for the three-month period from May till July, using values measured daily between 8:00 and 20:00 CET (= 7:00 and 19:00 UTC).