IV.2 BENZO[A]PYRENE
IV.2.1 Air pollution caused by benzo[a]pyrene in the year 2014
Air pollution caused by benzo[a]pyrene is one of the main problems of air quality protection in the Czech Republic. In 2015 the annual average concentrations of benzo[a]pyrene exceeded the limit value (1 ng.m-3) at 62 % of stations (i.e. at 21 of the total number of 34 stations with sufficient numbers of measurements for the evaluation). The year-on-year comparison shows a decrease because in 2014 exceedances occurred at more than 74 % of stations (i.e. at 23 out of 31 stations with sufficient data). However, the average annual concentrations in 2015 compared to 2014 (evaluated on the basis of a group of stations for which data were available for both 2014 and 2015) decreased at 50 % of stations. Similarly, the average annual concentration (averaged for the same group of stations at which measurements were carried out both in 2014 and 2015) was lower in 2015 (1.77 ng.m-3) compared to the year 2014 (1.98 ng.m-3).
A number of towns and smaller settlements were evaluated, similarly as in the previous years, as territories where the limit value was exceeded (Fig. IV.2.1). In 2015 the limit value was exceeded in 20.3 % of the territory of the Czech Republic (in 2014 in 10.7 % of the territory of the Czech Republic), inhabited by 50.8 % of the country’s population (compared to approximately 51.1 % in 2014). Although the area of the Czech Republic with over-limit concentrations increased almost three- fold, the percentage of exposed inhabitants remained practically unchanged. This can be explained by a decrease of concentrations to below the ambient limit, especially in places with large numbers of inhabitants, mainly in Prague and Pilsen.
It is necessary to consider that estimates of fields of annual average benzo[a]pyrene concentrations (Fig. IV.2.1) are burdened with greater uncertainties compared to other mapped pollutants. The uncertainty of the map is influenced also by an insufficient number of measurements at rural regional stations and an absence of measurements from small settlements in the Czech Republic that would represent the fundamental role of local heating as concerns ambient air pollution caused by benzo[a]pyrene. Consequently, the assessment of the year-to-year change of the share of the area and population affected by limit-exceeding concentrations of benzo[a]pyrene is burdened with greater uncertainty. Uncertainties concerning the maps are described in detail in Annex I.
The highest annual average concentration in 2015 was measured, similarly as in previous years, at the industrial locality Ostrava-Radvanice ZÚ (7.8 ng.m-3, an almost eight-fold exceedance of the limit value). Above-limit concentrations were reached also at two of the other three industrial localities and at nearly 61 % of urban and suburban background stations. As concerns traffic stations, benzo[a]pyrene concentrations are measured at four stations, of which the limit value was exceeded at three (Table XIII.6). The exceedance of the limit value for benzo[a]pyrene at most stations is given by a more or less regular distribution of the main source of this pollutant, which is household heating. The highest concentrations are measured, similarly as for most other pollutants, in the O/K/F-M agglomeration due to the highest emission loads within the Czech Republic aggravated by cross-border transport from Poland (see Chapter IV.2.3 for more details).
The highest concentrations of benzo[a]pyrene in the Czech Republic are measured every year at the stations Ostrava-Radvanice ZÚ, Ostrava-Radvanice OZO, Ostrava-Přívoz and Český Těšín. The unfavourable situation in the Ostrava-Karviná area and the year-round influence of emissions are illustrated by the fact that in summer periods, when benzo[a]pyrene concentrations at other stations not infrequently reach levels around the margin of detection (0.04 ng.m-3), daily concentrations exceeding 1 ng.m-3 are recorded at the above stations (e.g. Ostrava-Radvanice ZÚ 14.00 ng.m-3 on 6 June 2015, Ostrava-Radvanice OZO 8.00 ng.m-3 on 6 June 2015, Ostrava-Přívoz 7.08 ng.m-3 on 20 August 2015 and Český Těšín 1.86 ng.m-3 on 11 August 2015).
Limit-exceeding concentrations of benzo[a]pyrene probably also affect municipalities where its levels are not routinely monitored. This fact is repeatedly confirmed by measurements taken at new localities, e.g. Brušperk and Ludgeřovice in 2014, Budišov nad Budišovkou and Mosty u Jablunkova in 2015 or Valašské Meziříčí. The localities Brušperk (4.7 ng.m-3), Ludgeřovice (5.4 ng.m-3), Budišov nad Budišovkou (2.0 ng.m-3) and Mosty u Jablunkova (2.1 ng.m-3), where monitoring in the year 2014 was subsidized from the budget of the Moravia-Silesia Region1, lie near the Moravian-Silesian industrial agglomeration and are therefore exposed to the influence of both the industrial region and local heating and transport. By contrast, the station in Valašské Meziříčí, which is in operation since 2013, is situated on the premises of a school and is not directly influenced by emissions of benzo[a]pyrene. This locality, with its annual average concentration of 2.9 ng.m-3 (2.1 ng.m-3 in 2014), nevertheless still ranks among strongly polluted localities.
Moreover, as part of a measurement campaign, measurements were taken in 2015 at three small settlements in the South Moravia region (Prace, Chudčice, Velké Pavlovice) that to different extents utilize gas for household heating. The measurements were taken at the turn of October and November at a time when a smog alert was issued for a large part of the zones and agglomerations because of high concentrations of PM10. This situation further amplifies one problem that can arise in small settlements. Measured concentrations reached several-fold greater values than at the locality Brno-Líšeň, which lies in the same region but is connected to a central heat source. Measured short-term concentrations were even comparable to those found at the most polluted localities in the long-term, which are located in the in the O/K/F-M agglomeration. Because the number of concentration values obtained during the campaign measurements does not allow the calculation of annual average concentrations in accordance with the current legislature, the assessment mentioned above is thus based on a com- parison of average daily values of concentrations (Fig. IV.2.5).
benzo[a]pyrene concentrations show a marked annual progression (Fig. IV.2.6), with maximum levels in the winter period and minimum levels in the summer period. The increased concentrations in the winter period are related with the increased PAH concentrations from seasonal anthropogenic sources – from local heating (i.e. from the most significant source of benzo[a]pyrene emissions of polycyclic aromatic hydrocarbons, hereafter referred to as PAH – Fig. IV.2.8). PAH emissions have another significant source, which is traffic. Moreover, in the winter period, PAH emissions are increased due to cold starts. Further causes of increased concentrations include deteriorated dispersion conditions in the winter period, simpler gas-particle conversion at low temperatures and lower photochemical decomposition of PAH. In summer periods, by contrast, the concentrations decrease due to better dispersion conditions, increased chemical and photochemical decomposition of PAH under higher intensity of solar radiation and high temperatures and, of course, also due to the reduction of emissions from anthropogenic sources (Li et al. 2009; Ludykar et al. 1999; Teixeira et al. 2012).
IV.2.2 Development of benzo[a]pyrene concentrations
Trends of average annual concentrations of benzo[a]pyrene since the year 2006 are presented. The national average for the levels of this pollutant shows long-term exceedances of the limit value (more than double levels, Fig. IV.2.4). The highest benzo[a]pyrene concentrations were measured in 2006 (more than three-fold exceedance of the limit value) due to deteriorated meteorological and dispersion conditions. Since 2007 concentrations of benzo[a]pyrene fluctuated and did not show any marked trend. Based on the year-on-year comparison between 2014 and 2015, it can be stated that the concentrations decreased at all types of localities. The highest concentrations are reached at industrial localities. The above-limit concentrations, however, occur also at urban and suburban stations (Figs. IV.2.4). As already mentioned, an insufficient number of measurements at rural localities does not allow the estimation of the level of benzo[a]pyrene concentration in small settlements. Nevertheless, on the basis of the structure of emission sources and, for example, the results of a study by Krejčí (2012), it may be stated that the concentrations there also reach the limit-exceeding levels. The relationship between concentrations of benzo[a]pyrene and PM10 particles in summer months of 2011–2015 is presented in Fig. IV.2.7.
IV.2.3 Emissions of benzo[a]pyrene
Emissions of PAH in the ambient air pollution sphere represented by benzo[a]pyrene are produced almost exclusively by combustion processes during which organic combustible substances are not sufficiently oxidized. Benzo[a]pyrene is the product of insufficient combustion at temperatures between 300 and 600 °C. Therefore, the most significant sources include the combustion of solid fuels in low-output boilers, primarily in households, and transport.
Sector 1A4bi-Residential stationary combustion contributed to benzo[a]pyrene emissions in 2014 by 84.0 % on the country-wide scale (Fig. IV.2.8). This high share was caused by the combustion of solid fuels, mainly coal, in old types of boilers (under-fire boilers, over-fire boilers). Expert estimates claim that under-fire boilers and over-fire boilers represent up to 85 % of all appliances for burning solid fuels in households in the Czech Republic (Bufka 2011). The influence of sectors 1A3biii-Road transport: Heavy duty vehicles and buses, and 1A3bi-Road transportation: Passenger cars is estimated at 12.4 %. Other significant sources of benzo[a]pyrene emissions are found in sectors 1A2a-Stationary combustion in manufacturing industries and construction: Iron and steel (agglomeration/ sintering belts) and 1B1b-Solid fuel transformation (coke-oven battery leaks).
In individual regions of the Czech Republic, the
contributions of individual types of sources to total
emissions varies depending on the particular mix
of sources in the given area. Due to the dominant
share of the local household heating sector 1A4bi,
benzo[a]pyrene emissions are distributed throughout
the area of the Czech Republic with residential
development, and their amount in the period of
2007–2014 depended especially on the temperature
character of each heating season (Fig. IV.2.9). The
influence of traffic is evident mainly along motorways,
roads with high traffic flows and in large
cities. The greatest burden of benzo[a]pyrene emissions
is recorded in the O/K/F-M agglomeration
due to the presence of iron and steel production
plants and associated coke plants (Fig. IV.2.10).
Tab. XIII.6 Stations with the highest values of annual average
concentrations of
benzo[a]pyrene in the ambient air
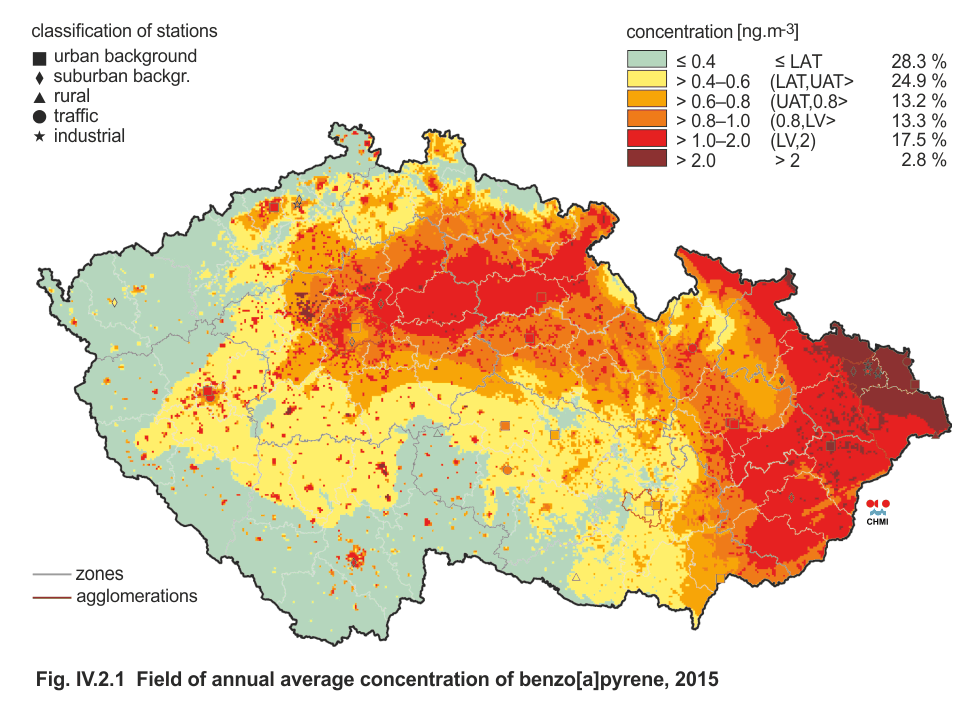
Fig. IV.2.1 Field of annual average concentration of benzo[a]pyrene,
2015
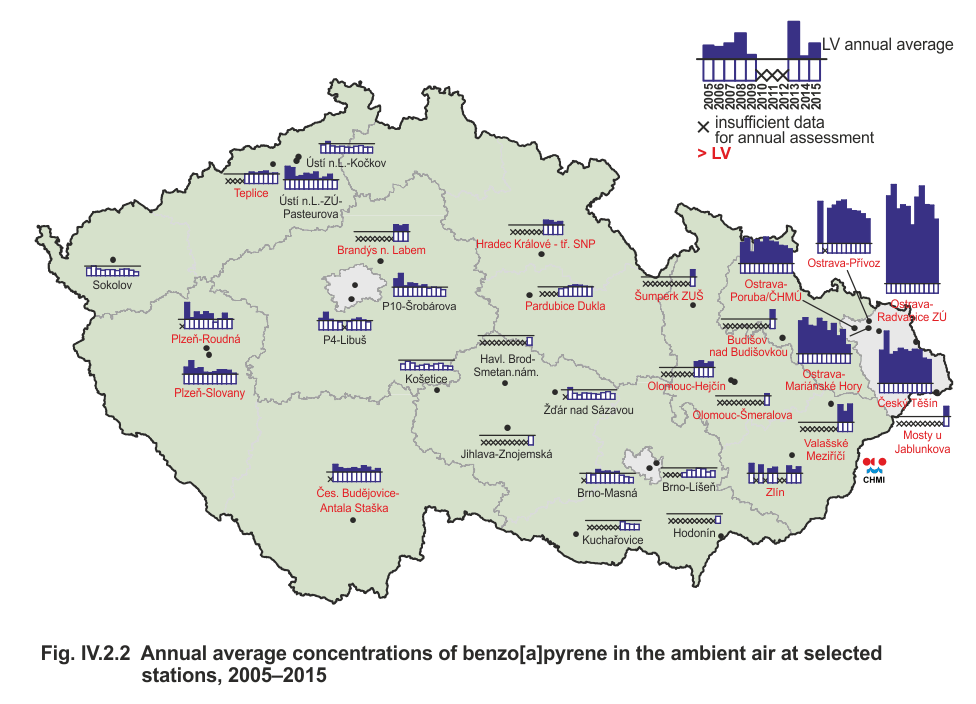
Fig. IV.2.2 Annual average concentrations of benzo[a]pyrene in
the ambient air at selected stations, 2005–2015
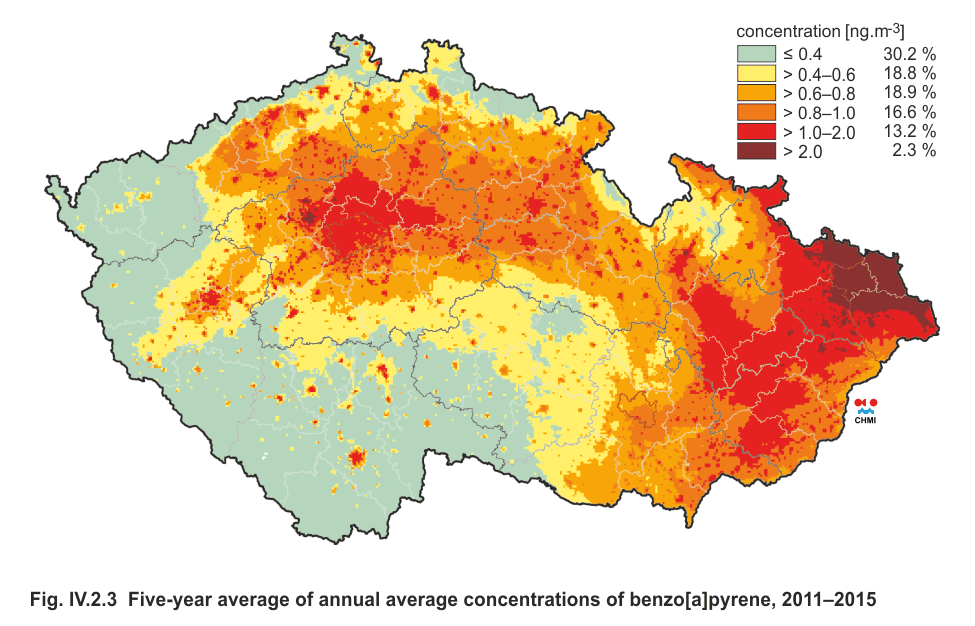
Fig. IV.2.3 Five-year average of annual average concentrations
of benzo[a]pyrene, 2011–2015
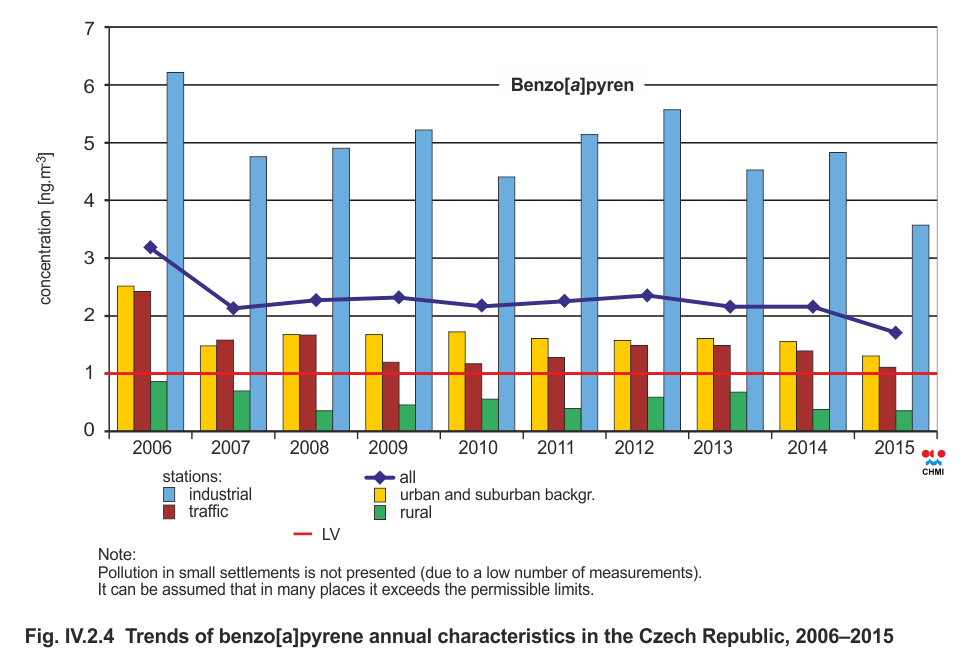
Fig. IV.2.4 Trends of benzo[a]pyrene annual characteristics in
the Czech Republic, 2006–2015
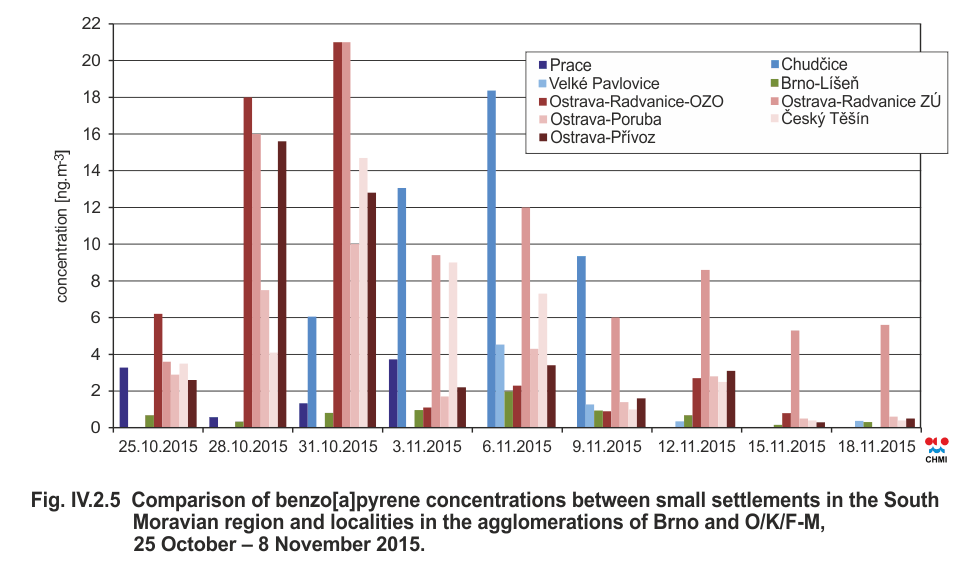
Fig. IV.2.5 Comparison of benzo[a]pyrene concentrations between small settlements in the
South Moravian region and localities in the agglomerations of Brno
and O/K/F-M, October 25 - November 8, 2015
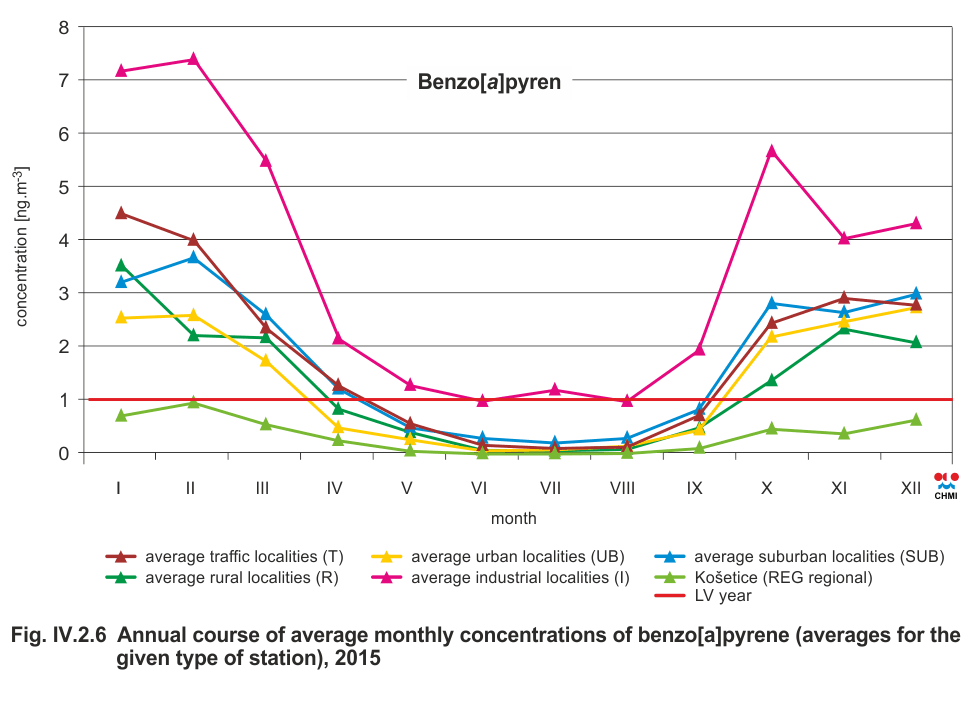
Fig. IV.2.6 Annual course of average monthly concentrations of
benzo[a]pyrene (averages for the given type of station), 2015
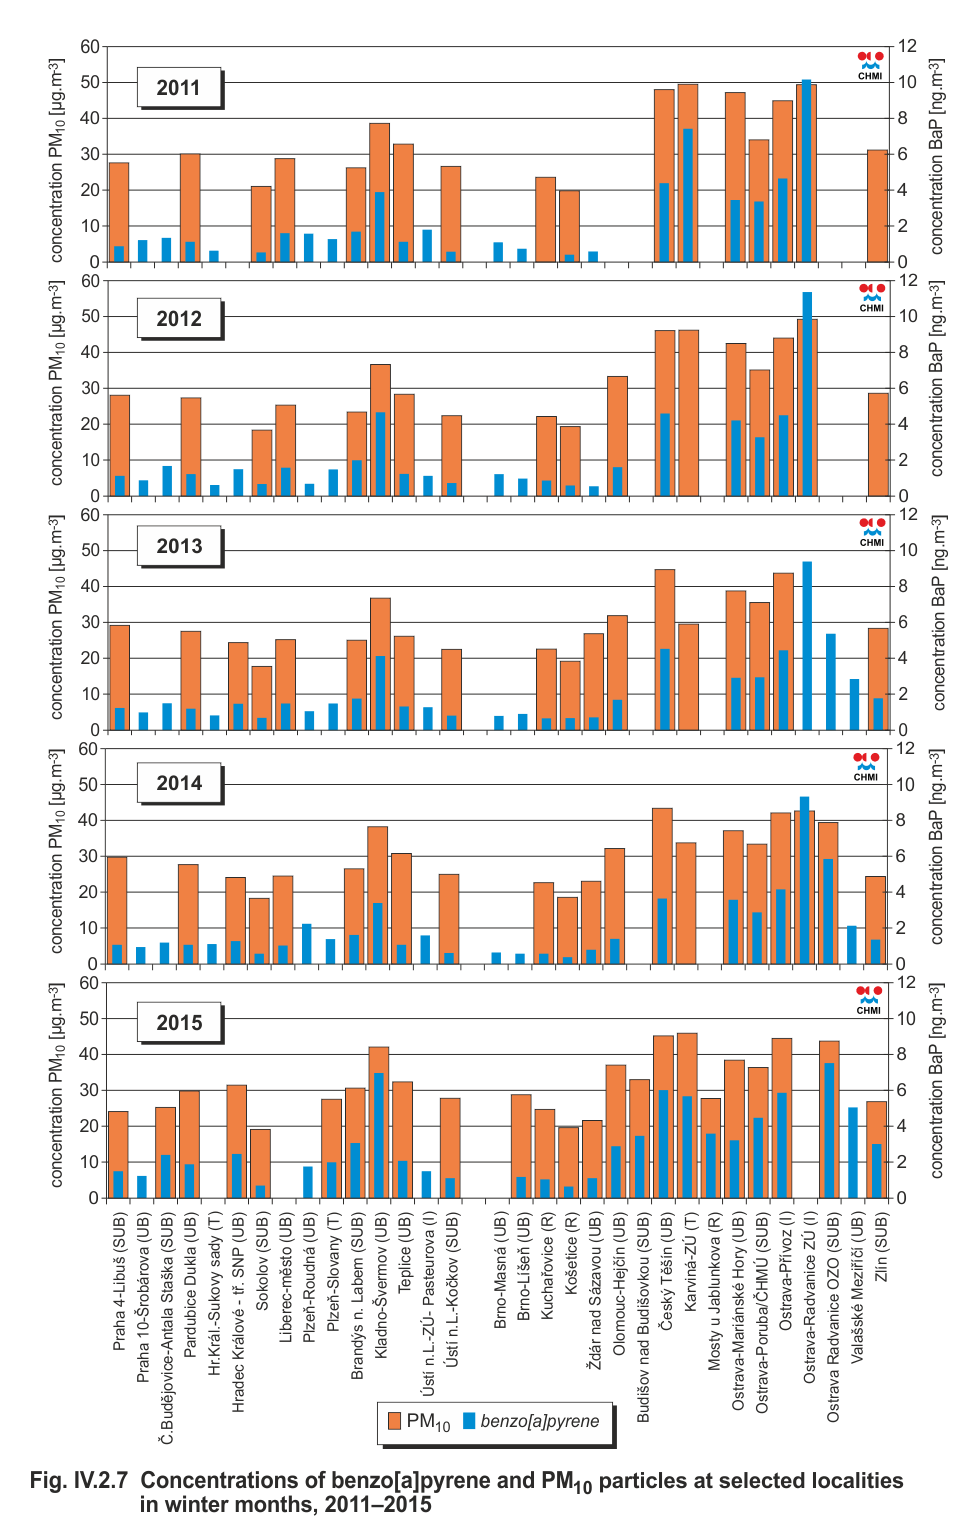
Fig. IV.2.7 Concentrations of benzo[a]pyrene and PM10 particles
at individual localities in winter months, 2011–2015
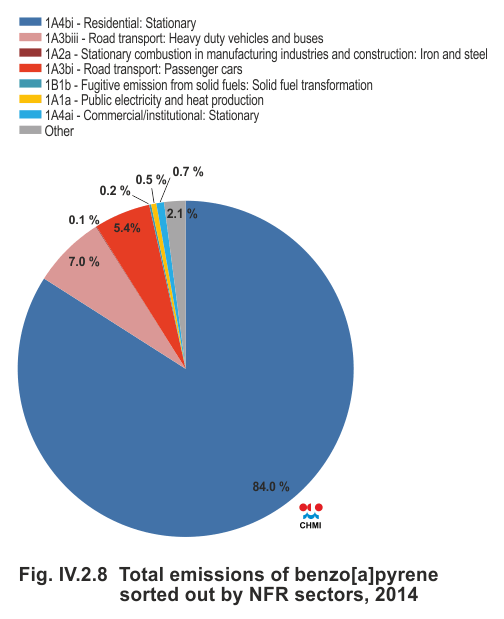
Fig. IV.2.8 Total emissions of benzo[a]pyrene sorted out by NFR
sectors, 2014
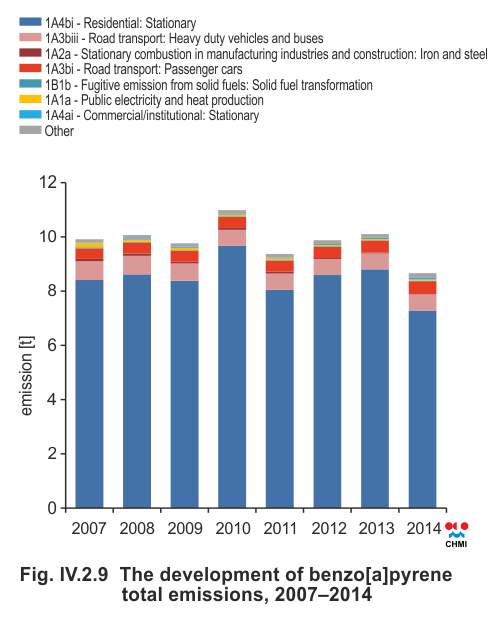
Fig. IV.2.9 The development of benzo[a]pyrene total emissions,
2007–2014
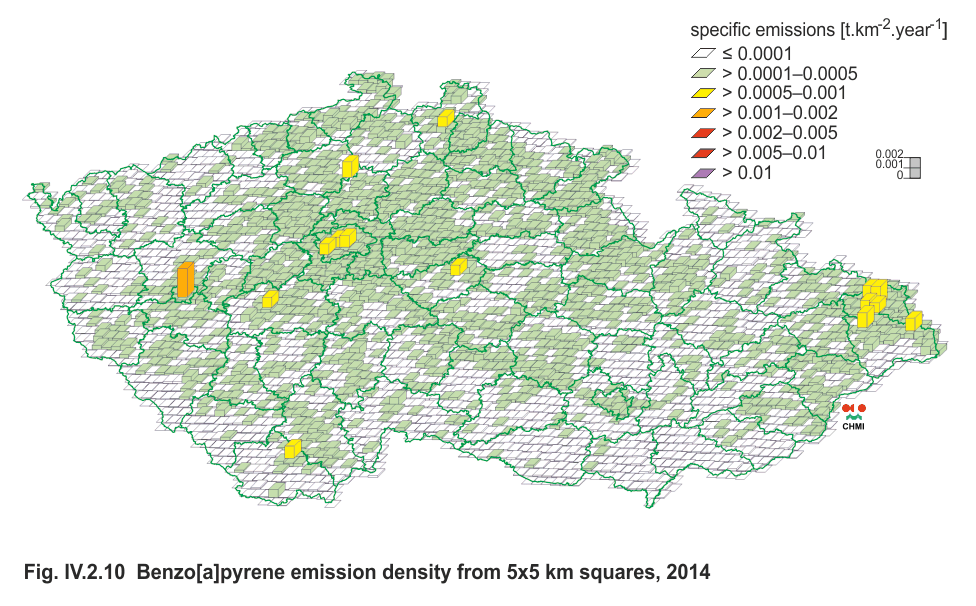
Fig. IV.2.10 Benzo[a]pyrene emission density from 5x5 km squares,
2014
1For
the detailed annual evaluation, see
www.chmi.cz