IV. AIR QUALITY IN THE CZECH REPUBLIC
IV.1 SUSPENDED PARTICLES
Air pollution by the PM10 and PM2.5 fractions of suspended particles remains one of the main problems of air quality assurance in the Czech Republic. Exceedances of limit values for PM10 and PM2.5 are still a significant reason for including municipalities among areas where limit values are exceeded. Since 2008 the monitoring of particles of the fine PM1 fraction gradually commenced at certain localities.
IV.1.1 Air pollution caused by suspended particles in the year 2015
Suspended particles of PM10 fraction
The limit value for 24-hour concentrations of PM10 was exceeded in 2015 in 2.5 % of the territory of the Czech Republic inhabited by approximately 10.4 % of the population, and the limit value for the annual average concentration of PM10 was exceeded in 0.02 % of the territory, inhabited by approximately 0.01 % of the population (Figs. IV.1.1 and IV.1.2).
Exceedances of the 24-hour limit value for PM10 were recorded in 2015 at 23.4 % of stations (i.e. 29 stations out of the total number of 124 with data sufficient for the assessment). This is less than in 2014, when the daily limit value was exceeded at 42.9 % of stations (57 stations out of 133; Fig. IV.1.8). The area where the daily limit value for PM10 was exceeded shrank significantly from 8.1 % of the Czech territory, inhabited by about 24.4 % of the population, to the already mentioned 2.5 % of the territory, inhabited by approximately 10.4 % of the population. This reduction of the area where the 24-hour limit was exceeded especially concerned the Ústí nad Labem region, the Central Bohemia region and the Olomouc region. The guideline 24-hour value of PM10 set by the WHO for the protection of human health (50 μg.m-3) was nevertheless exceeded in almost the entire area of the Czech Republic (92.9 %). The most severely affected continuous area was, similarly as in the previous years (Figs. IV.1.5 and IV.1.6), the agglomeration of O/K/F-M, where the daily limit value for PM10 was exceeded at most stations in 2015. However, the daily ambient limit for PM10 is usually exceeded also in other zones and agglomerations. In 2014 exceedances were recorded in all zones and agglomerations with the exceptions of the Southeast zone (CHMI 2015). In 2015 exceedances were not recorded in the Northeast zone, the Southeast zone and in the Prague agglome- ration (Fig. IV.1.3). In the Brno agglomeration in 2015, there were exceedances of the daily ambient limit only at the traffic locality Brno- Zvonařka (Chapter V.2). In the agglomerations of Prague and Brno, exceedances of the limit value tend to be connected primarily with traffic loads; in the O/K/F-M agglomeration and other zones, however, exceedances also occurred at urban, suburban and rural background stations.
In 2015 the annual limit value for PM10 was exceeded at 2.3 % of stations, i.e. at 3 stations out of the total number of 132 stations in the Czech Republic with sufficient data. All the exceedances were recorded at only two stations in the agglomeration of O/K/F-M and one station in the Central Moravia zone (Tables XIII.2 and XIII.5, Fig. IV.1.12). In 2014 exceedances of the annual limit value were recorded at 7.1 % of stations (10 stations of 141; Fig. IV.1.8). In 2015 the territory where the annual limit value was exceeded decreased to 0.02 % with approx. 0.01 % of inhabitants from 0.45 % of the territory with approx. 2.2 % of inhabitants in 2014. Concentrations of PM10 show a clear annual progression with the highest values in the cold months of the year (Fig. IV.1.11). Higher concentrations of PM10 in the ambient air during the cold part of the year are connected both with higher emissions of particles from seasonal heat sources and deteriorated dispersion conditions, which are more common in winter months. For example, local heating in the Czech Republic contributes to emissions of PM10 and PM2.5 by 34 % and 51 %, respectively (Figs. IV.1.17 and IV.1.19). The annual progression of PM10 concentrations in 2015 differed from those in 2014 in that the greatest average monthly concentrations occurred in February and October because November was extremely above normal temperature-wise whereas January and December were strongly supernormal. During all these months, moreover, unfavourable conditions were less frequent compared to the long-term average. Higher concentrations were measured also in August 2015 (Fig. IV.1.11). The reason were abnormally high temperatures (Chapter III), which led to increased rates of resuspension1.
The decrease of ambient levels of PM10 and PM2.5 particles compared to the previous year was primarily caused by favourable meteorological and dispersion conditions (Chapter III).
Suspended particles of PM2.5 fraction
The decrease in the level of air pollution in 2015 as compared to 2014 was apparent also in the case of PM2.5 particles. The annual ambient limit value for PM2.5 was exceeded in 0.9 % of the Czech territory, inhabited by approximately 5.1 % of the population (Fig. IV.1.4)compared to 1.8 % of the territory, inhabited by 8.6 % of the population in 2014. Exceedances of the limit in 2015 were recorded at five stations in the O/K/F-M agglomeration and at one station in the Central Moravia zone (Table XIII.3, Fig. IV.1.7). Exceedances were recorded at six (12.5 %) of the total number of 48 stations; in 2014 exceedances were recorded at eleven stations (21.2 %) out of 52 (Fig. IV.1.8). The guideline 24-hour WHO guideline limit for PM2.5 set for the protection of human health (25 μg.m-3) was exceeded in almost the entire area of the Czech Republic (99.2 %). Higher levels of air pollution caused by PM2.5 occur mainly during the cold part of the year (Fig. IV.1.12) and, similarly to those of PM10, are caused by emissions from heating and deteriorated dispersion con- ditions. As in the case of PM10 concentrations, the greatest average monthly concentrations of PM2.5 in 2015 were recorded in February and October.
Suspended PM1 particles
In 2015 the fine fraction of PM1 particles was monitored at 11 localities, four of which were located in the city of Plzeň, four in the Brno-město district, two in the Brno-venkov district and one in the Zlín district (Table XIII.4). The greatest annual as well as the maximum daily concentration (23.3 and 128.3 μg.m-3, respectively) were reached at the station Otrokovice-město (Zlín district).
Ratio between the PM2.5 and PM10 fractions
of suspended particles
The ratio between the PM2.5 and PM10 fractions is not constant, but shows a seasonal progression. At the same time, it is dependent on the locality (Fig. IV.1.13). In 2015 the average ratio for 30 localities measuring both PM2.5 and PM10 in the Czech Republic with sufficient data ranged from 0.67 (July and September) to 0.81 (February), with lower values in the summer period. In Prague, where the annual course is influenced by a large share of traffic localities, this ratio ranged from 0.60 (July) to 0.76 (December), in Brno from 0.58 (July) to 0.90 (March), in the O/K/F-M agglomeration from 0.69 (June) to 0.88 (December) and in the Ústí nad Labem region from 0.61 (September) to 0.74 (February). When comparing the ratio with regard to the classification of localities, the ratio at rural localities ranges from 0.69 (September) to 0.89 (February), at urban localities from 0.67 (September) to 0.81 (December), at suburban localities from 0.64 (June) to 0.81 (December) and at traffic localities from 0.59 (July) to 0.80 (February, October and December).
The annual progression of the ration between the PM2.5 and PM10 fractions is connected with the seasonal character of several emission sources. Emissions from combustion sources show higher shares of the PM2.5 fraction than for instance emissions from agriculture and resuspension during dry and windy weather. Consequently, heating in the winter period can cause a higher share of the PM2.5 fraction in comparison with the PM10 fraction. Some authors (Gehrig, Buchmann 2003) explain the decrease during spring and early summer also by the increased amount of larger biogenic particles such as pollen in the air. Higher values of the PM2.5/PM10 ratio due to combustion are also observed at industrial stations.
The PM2.5/PM10 ratio is the lowest at traffic localities (Fig. IV.1.13). During fuel combustion, emitted particles mainly belong to the PM2.5 fraction, and thus the ratio should be high at traffic localities. The fact that this is not the case accents the significance of emissions of larger particles caused by tyre, brake lining and road surface abrasion. The share of the coarse fraction at traffic stations increases also due to the re-suspension of particles following road gritting in winter. The growth of PM10 concentrations can also be caused by increased abrasion of the road surface due to gritting and the subsequent resuspension of the abraded material (EC 2011).
IV.1.2 Development of PM10 and PM2.5 concentrations
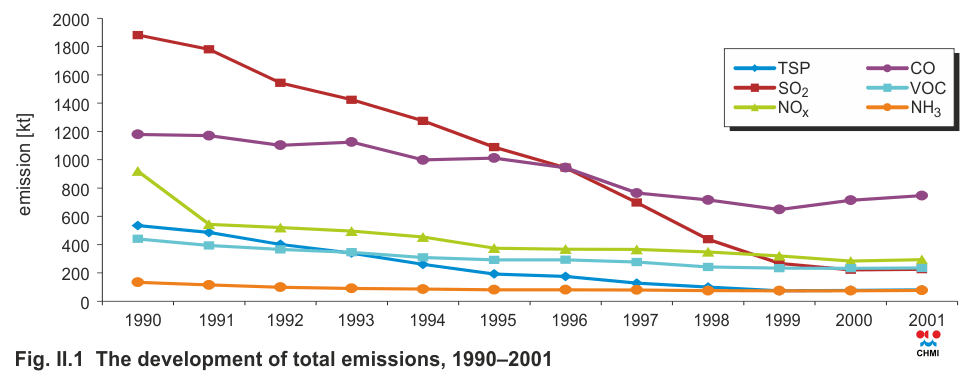
Concentrations of PM10 suspended particles, similarly as in other pollutants, decreased significantly
in the 90s of the last century. This was caused by
a marked decrease of emissions of TSP and precursors of suspended particles (SO2, NOx, NH3
and VOC) in the period 1990–2001 due to legislative changes, restructuring of the economy and
modernization or closure of emissions sources
(see Chapter II),
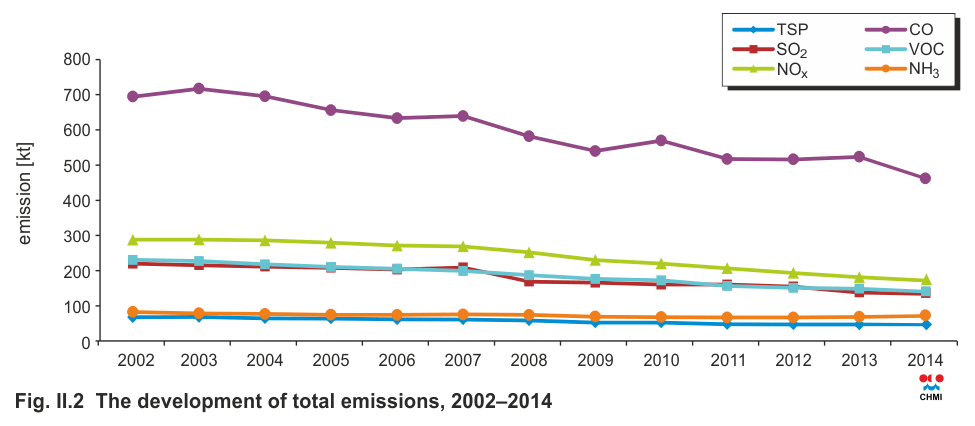
Fig. II.1). After the year 2001, the
decrease in emissions continued at a slower rate
(Fig. II.2),
so concentrations of pollutants mainly
depend on the meteorological and dispersion conditions that prevail in each given year. At almost all
localities in the Czech Republic air pollution caused
by PM10 was increasing between the years 2001
and 2013. The highest PM10 concentrations detected
after 2000 were measured in 2003. The high PM10
concentrations in 2003 were caused by both unfavourable dispersion conditions in February and
below-normal precipitation amounts. After a temporary decrease in 2004, high concentrations of
suspended particles were recorded again in the
years 2005 and 2006, mainly due to long episodes
with unfavourable dispersion conditions in the winter
period. In 2007–2009, by contrast, there were more
favourable dispersion conditions, and the concentrations
of particles decreased significantly in comparison with the years 2003, 2005 and 2006. In 2008
the lower concentrations were probably also caused
by more pronounced decreases of emissions of some
precursors of solid particles during the economic
crisis and ensuing temporary declines in certain
sectors (see Chapter II).
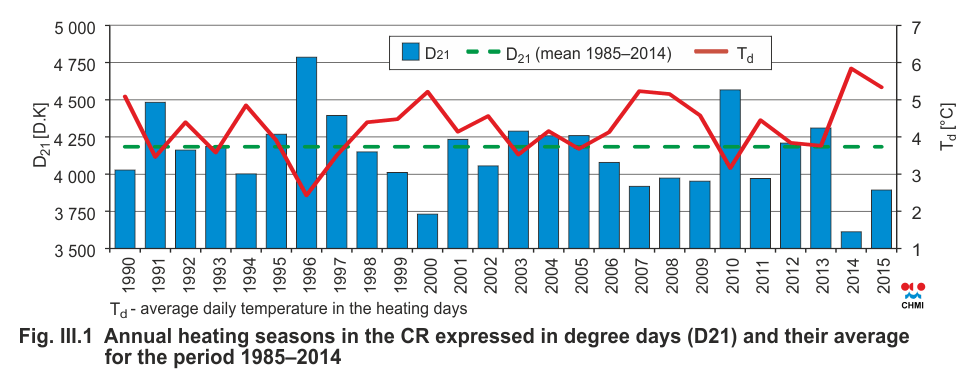
The subsequent increase
of concentrations of suspended particles in 2010
was caused mainly by the repeated occurrence of
unfavourable meteorological and dispersion conditions
in the winter period at the beginning and at the
end of the year, and by the coldest heating season
since 1996 (Fig.
III.1). In the last five years, the
average concentration of suspended particles was
decreasing (Figs.
IV.1.14,
IV.1.15 and
IV.1.16).
A decrease of the
PM10 fraction was apparent at localities belonging
to all categories (Fig. IV.I.14).
The annual average
concentration of PM10 has in the long term remained
below the limit value, but the annual average concentration of PM2.5 and the 36th highest daily
concentration of PM10 have been fluctuating around
their limit values (in all cases, averages for all types
of localities and the whole of the Czech Republic
are presented; Figs.
IV.1.14,
IV.1.15 and
IV.1.16).
In the long term, limit-exceeding annual concentrations of PM10 and PM2.5 affect 0.5 % and 2 % of
the Czech Republic, respectively (Figs.
IV.1.9 and
IV.1.10, respectively).
This is mainly true for
the area of the O/K/F-M agglomeration and parts
of the Moravia-Silesia zone. There is an apparent
decreasing over the last four years. This is based on
a comparison of the spatial distribution of the five-year average and the annual average for 2015, which
shows a decrease of the area affected by over-limit
annual concentrations. Limit-exceeding annual concentrations of PM10 occurred almost exclusively in
the O/K/F-M agglomeration. Limit-exceeding annual
concentrations of PM2.5 occurred only in isolated cases (Figs.
IV.1.2 and
IV.1.9, Figs.
IV.1.4 and
IV.1.10).
IV.1.3 Emissions of PM10 and PM2.5
The combustion of fuels and other industrial activities result in the production of aerosols, which can be solid, liquid or mixed. The Czech legislation defines these aerosols as ‘solid pollutants’ (Czech abbreviation TZL), while the foreign literature refers to Total Suspended Particulates (TSP). Emissions of TSP differ in size and chemical composition, depending on the nature of the source and the mode of formation. They may contain heavy metals and also carry VOC and PAH. For the purposes of emissions inventories, the PM10 and PM2.5 size fractions are usually distinguished in connection with air pollution limits.
Emissions inventories of PM10 and PM2.5 carried out using valid methods only include emissions produced by primary sources. In comparison with emissions of other pollutants, PM emissions are emitted into the air from a large array of groups of sources. Apart from sources from which these substances are discharged in a controlled manner through chimneys or vents (industrial sources, local heating sources, transport), significant amounts of PM emissions have their origin in fugitive sources (quarries, landfills of dusty materials, operations with dusty materials, etc.). Also included are emissions from tyre and brake wear, and road abrasion calculated from transport volumes. The ambient air quality is influenced also by resuspension of particles (resuspension), which is not included in emission inventories. The main source of PM emissions in 2014 is represented by sector 1A4bi-Residential stationary combustion; its share in air pollution on the country-wide scale caused by PM10 and PM2.5 amounted to 33.9 % and 51.2 %, respectively (Figs. IV.1.17 and IV.1.19). Other significant sources of PM10 emissions include 3Dc-Farm-level agricultural operations including storage, handling and transport of agricultural products, where these emissions are produced during tillage, harvest and cleaning of agricultural crops in fields. This sector contributed 12.8 % of the PM10 emissions. With regard to the effects on human health, a large risk are emissions of PM caused by traffic, mainly from fuel combustion in compression ignition engines producing particles that are units to hundreds of nm in size (Vojtíšek 2010). The sectors 1A3biii-Road transport: Heavy duty vehicles and buses and 1A3bi-Road transport: Passenger cars, contributed to PM10 emissions by 5.9 % and to PM2.5 emissions by 9.1 %.
The share of households using solid fuels for heating did not significantly change in the period 2007–2014, so the trend of PM10 and PM2.5 emissions is influenced especially by the character of the heating seasons (Figs. IV.1.18 and IV.1.20). The decrease of emissions is influenced especially by natural renewal of the car fleet, a decrease in agricultural production and the implementation of emission ceilings for TSP from LCP sources since 2008.
In individual regions of the Czech Republic, the contributions of various types of sources to total emissions depend on the particular mix of sources in the given region. With regard to the fact that the main source of PM10 and PM2.5 emissions is represented by the sector of residential stationary combustion, the production of emissions of these pollutants is distributed throughout the whole inhabited territory of the country (Figs. IV.1.21 and IV.1.22). In the territory of the Czech Republic divided into 5 x 5 km squares, the most outstanding are localities with major energy producers burning solid fossil fuels followed by large industrial complexes (primarily the Moravia-Silesia region and the Ústí nad Labem region). The influence of traffic is apparent mainly in big cities.
IV.1.4 Measurements of numerical size distribution of
aerosol particles
Atmospheric aerosols (AA), defined as solid and liquid particles suspended in the atmosphere, are its natural component. AA cause optical phenomena in the atmospheric such as colourful sunsets, rainbows and halo phenomena). AA reflect and absorb solar radiation, and also play an important role in the formation of clouds and precipitation (as cloud condensation nuclei; Hinds 1999, Pöschl 2005, Seinfeld, Pandis 2006). The range of AA particle sizes spans five orders of magnitude (from units of nm to thousands of μm). They therefore comprise a wide spectrum of particles of different shapes, properties and chemical composition.
The negative impact of suspended particles (PM10 and PM2.5) on human health has been proven by many studies (Schladitz et al. 2015, WHO 2013, Tuch et al. 1997). The most serious hazard, however, is posed by ultrafine particles smaller than 100 nm, which easily enter through the respiratory system into the blood stream and can get transported to sensitive organs or the central nervous system. Their presence in the blood can affect its function and properties (Borsós et al. 2012, Pöschl 2005). The weight of ultrafine particles is negligible in the size spectrum of PM10 and PM2.5, which is measured by default. For the purpose of assessing health effects, it is therefore more appropriate to measure numbers of particles and their size distribution (Tuch et al. 1997), which is also an important parameter for assessing the range of direct and indirect effects on the climate (Stanier et al. 2004).
As part of the co-operation between the CHMI and the Institute of Chemical Processes of the Czech Academy of Sciences (ICHP), the Košetice background observatory has been measuring the size distribution of aerosol particles since May 20082. The realization of these measurements is also supported by the participation of the station in the international projects EUSAAR (European Supersites for Atmospheric Aerosol Research), ACTRIS, ACTRIS-2 and ACTRIS-CZ (Aerosols, Clouds, and Trace gases Research InfraStructure Network).
For the background station at Košetice, which is not influenced by any direct source of pollution, there is a typical increase in the daily progression of the number of particles in nucleation mode (smaller than 20 nm) that lasts from morning until afternoon hours. The progression of the number of particles in the remaining parts of the spectrum reaches maximum values in afternoon and evening hours (Fig. IV.1.23). Particles in nucleation mode are either emitted directly into the atmosphere or are created due to the presence of gaseous precursors. The increase in the number of particles in nucleation mode is probably caused by events during which new particles are formed.
One example of the influence of human activity are hourly spectra of the number of particles on the last day of April, when traditional evening bonfires are lit to mark Walpurgis Night (Fig. IV.1.24). Over the course of the day, there is an almost identical progression as in the case of the whole-year spectrum (Fig. IV.1.23). During evening hours, however, there is a marked increase in the number of particles of the Aitken mode (between 20 and 100 nm), which, among other sources, come from local combustion.
A more pronounced daily progression of the number of particles is observed at the station Ústí nad Labem-město, where monitoring of the size distribution of particles has been taking place since mid-2011 (project Ultraschwarz). The growing number of particles in all parts of the spectrum from morning hours onwards reflects not only the traffic peak, but also the growing frequency of industrial combustion products. Industrial sources are connected with increased production of both particles and their gaseous precursors, from which secondary particles can form via photochemical processes. The drop in concentrations is followed by an increase in evening and night hours. While at night, the number of particles in nucleation mode decreases, particles of the size category 100 to 200 nm become dominant (Fig. IV.1.25).
Monitoring of the number of particles (size fractions in the range of 250 to 3,200 nm) is being carried out in Ostrava since 2008 at the urban background locality Ostrava-Fifejdy. In 2012, as part of the project Air Silesia3, the same extent of monitoring also commenced at the background suburban locality Ostrava-Poruba. In 2015 the average number of particles was 982 per cm3 at the station Ostrava-Fifejdy and 1,001 per cm3 at the station Ostrava-Poruba. In the cold part of the year, the number of particles smaller than 1 μm (mostly secondary aerosol) was markedly greater than in the warm season, which corresponds with higher concentrations of gaseous precursors SO2 and NOx in the Ostrava region during this part of the year. The proportion of the number of particles of fractions larger than 2 μm between the cold and warm halves of the year is balanced. The number of larger particles, especially those exceeding 10 μm is markedly higher in the warm half of the year. The median daily progression of the number of particles at both stations is more pronounced in the case of finer fractions smaller or equal to 0.5 μm in size, mainly in the warm half of the year. In the case of fractions larger than 0.5 μm, the daily progression is more balanced. The lowest values during the course of the day are reached in afternoon hours whereas the highest values are reached in the evening, at night and in early morning (Fig. IV.1.26 and Fig. IV.1.27). In the weekly progression of the number of particles approximately under 1 μm in size, there are no pronounced differences in the number of particles between working and weekend days. The number of larger particles increases on working days. The station in Ostrava-Poruba, compared to that in Ostrava-Fifejdy, reports greater numbers of particles, mainly of fractions smaller than 0.5 μm.
IV.1.5 Monitoring concentrations of elemental and organic
carbon
Carbonaceous aerosol particles in the atmosphere are mainly composed of elemental carbon and organic compounds (Seinfeld, Pandis 2006). Both elemental (EC) and organic carbon (OC) are products of imperfect combustion of organic materials (e.g. coal, oil, petrol, wood and biomass). Sources of OC also include the resuspension of dust, which is connected with transport, and biogenic particles (e.g. viruses, bacteria, pollen, fungal spores and fragments of vegetation of all types; Schwarz et al. 2008). While EC is emitted into the atmosphere only directly (primary particles), OC can form by reactions of gaseous organic precursors. Besides the terms EC and OC, designating carbonaceous aerosol particles, the term black carbon (BC) is commonly used. The terms black and elemental carbon basically refer to the same component of the atmosphere. Whereas EC particles only contain carbon, BC particles may besides EC also contain organic impurities (Chow et al. 2009, Husain 2007, Petzold et al. 2013). The correct terminology for describing elemental and black carbon differs depending on the concept of the nature of these substances. The term EC refers to properties related to volatility whereas the designation black carbon (BC) alludes to absorption properties across the spectrum of visible wavelengths (Seinfeld, Pandis 2006).
A large number of toxicological studies referred to in the WHO document from 2012 deal with the negative effects of these particles on human health. The studies cited by the document all agree on the fact that BC can serve as a carrier for a wide range of chemicals that are toxic to the human organism (WHO 2012). EC (and BC) compared to OC more easily passes into the human body and aggravates heart and lung diseases (Na, Cocker 2005). Organic particles (including organic carbon), which among other things may contain polycyclic aromatic hydrocarbon (PAH) fractions, are being studied for their carcinogenicity and mutagenic effects (Seinfeld, Pandis 2006, Satsangi et al. 2012).
The first periodic measurements of EC/OC in the Czech Republic (of the PM2.5 fraction) commenced in February 2009 at the Košetice background station. For technical reasons, their sampling was suspended in March 2015 and resumed only on 1 January 2016. The following assessment is therefore based on data up to the year 2014. The average concentration of total carbon (TC) in 2009–2014 in the sampled PM2.5 fraction is 3.9 μg.m-3, of which EC amounts to 0.5 μg.m-3 and OC to 3.4 μg.m-3. TC on average contributed to the total concentrations of PM2.5 by 28.9 % (the contribution of EC was 3.4 %, and the contribution of OC was 25.5 %). The highest share of TC in the total concentration of PM2.5 is usually reached in cold periods, when these values can exceed 40 % (Fig. IV.1.28). Over the course of the monitoring period, no inter-annual variability in average annual concentrations has been found (Tab. IV.1.1).
At the Ústí nad Labem station, concentrations of BC are being measured within the framework of the Ultraschwarz Project since mid-2012 (Ultraschwarz 2014). Since 2012 the monitoring of concentrations of BC is also carried out at the station Křešín u Pacova, operated by the Global Change Research Institute of the Czech Academy of Sciences. This station is situated in the immediate vicinity of the Košetice observatory and is part of the joint station Košetice-Křešín u Pacova.
In 2015 the average concentration of BC at the station in Ústí nad Labem was 1.95 μg.m-3. The greatest average monthly values were measured in February, November and December (varying between 2.5 μg.m-3 and 3.6 μg.m-3). The lowest average monthly con- centration of 0.82 μg.m-3 was recorded in July. Concentrations of BC detected at the station Křešín u Pacova reached average values of 0.59 μg.m-3. The greatest monthly average was recorded in February (0.90 μg.m-3) and the lowest in July (0.33 μg.m-3).
The annual variability of concentrations of BC and its dependence on combustion processes is well characterized by average daily concentrations in different months of the year (Fig. IV.1.29). The station in Ústí nad Labem is characterized by two maxima, one in morning and one in evening hours. During the heating season, elevated evening concentrations usually dominate, whereas in the warmer part of the year, the morning maximum is more pronounced. The progressions of daily concentrations of BC measured at the background station Křešín u Pacova reflect more substantial changes that are related to heating. Outside of the heating season, the morning maximum caused by traffic is more pronounced. In the cold part of the year, by contrast, elevated evening concentrations that are related to local heating dominate.
According to the results of the 2014 emissions inventory, up to 66.6 % of emissions in the Czech Republic originated from the transport sector, mainly from the burning of fuels in compression-ignition engines. Of this percentage, the following sectors contributed the most to the total emissions of BC: Agriculture/Forestry/Fishing: Off-road vehicles and other machinery (1A4cii) 3.7 %, Road transport: Heavy duty vehicles (1A3biii) 20.1 %, and Road transport: Passenger cars (1A3bi) 14.2 %. Stationary sources produced the most emissions of BC within the sector Residential stationary combustion (1A4bi), with a contribution to total emissions of 25.5 % (IV.1.30).
Tab. XIII.1 Stations with the highest numbers of exceedances of the 24-hour limit value of PM10
Tab. XIII.2 Stations with the highest values of annual average concentrations of PM10
Tab. XIII.3 Stations with the highest values of annual average concentrations of PM2.5
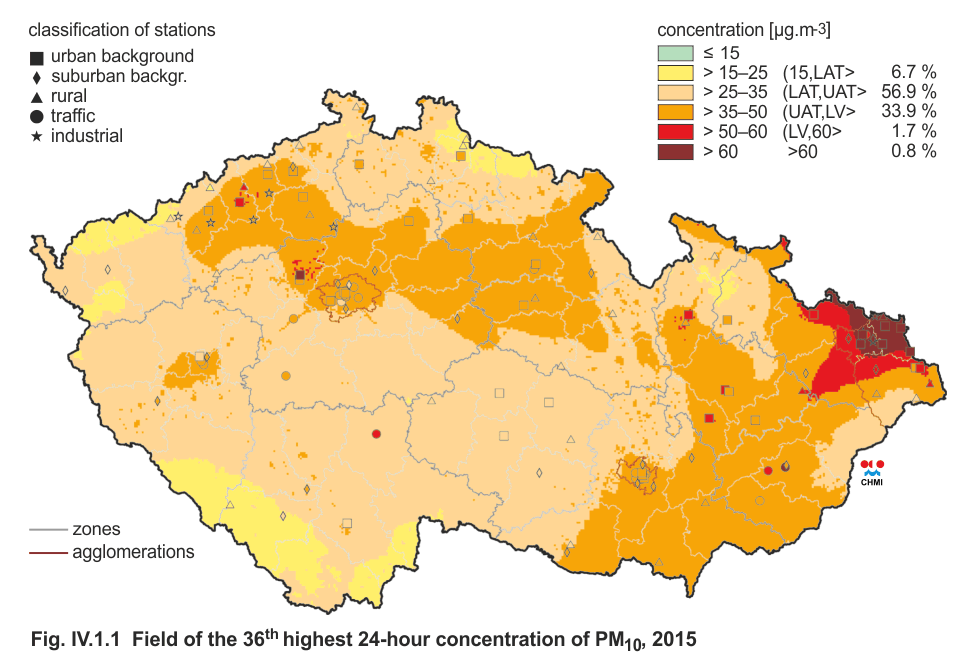
Fig. IV.1.1 Field of the 36th highest 24-hour concentration
of PM10, 2015
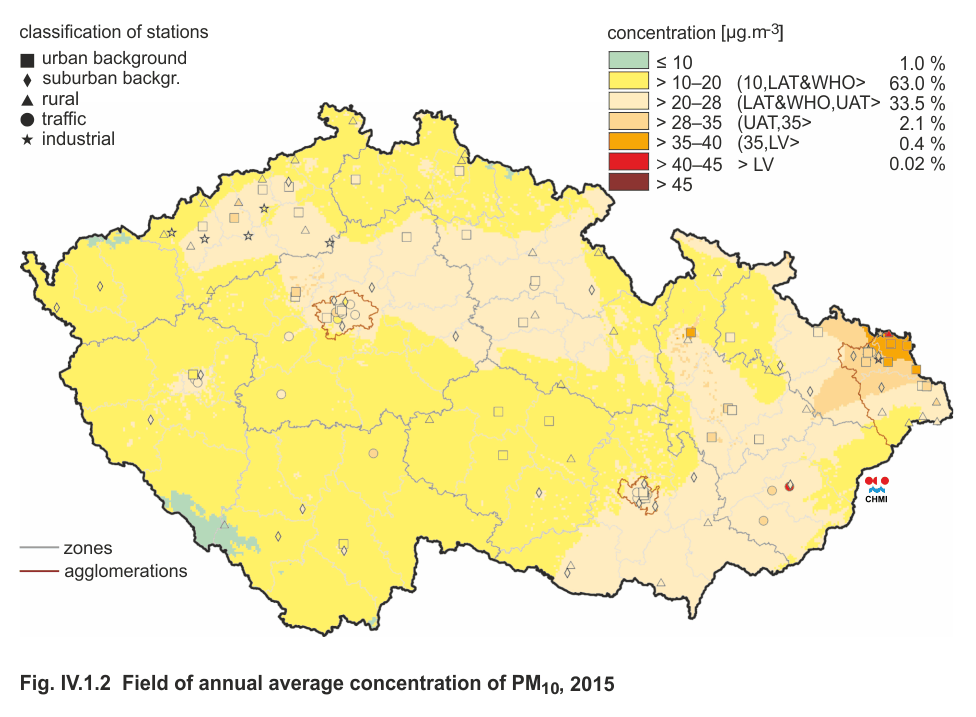
Fig. IV.1.2 Field of annual average concentration of PM10, 2015
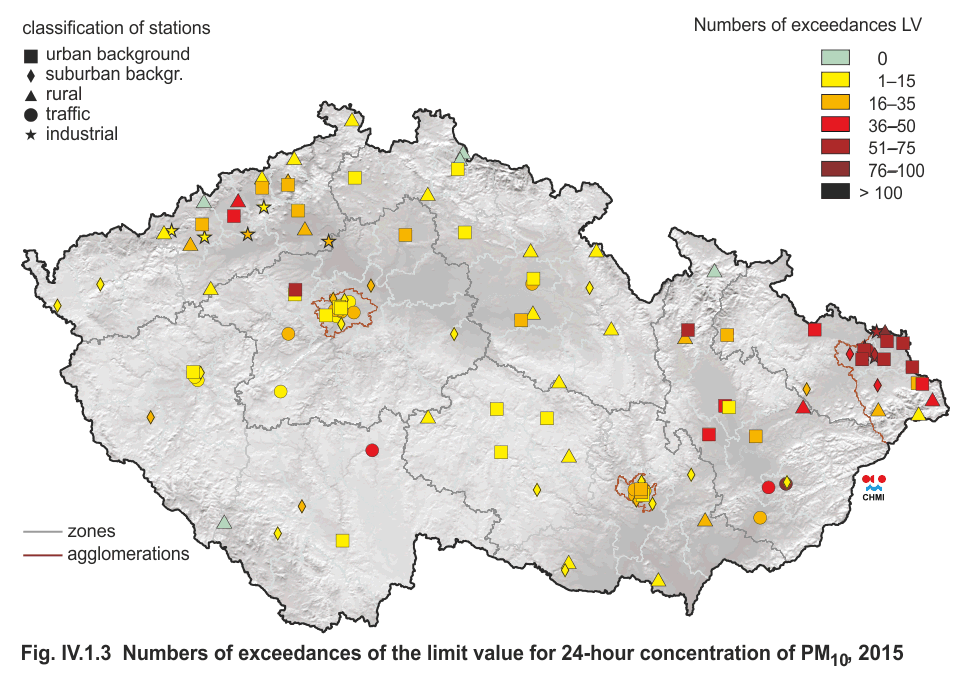
Fig. IV.1.3 Numbers of exceedances of the limit value for 24-hour
concentration of PM10, 2015
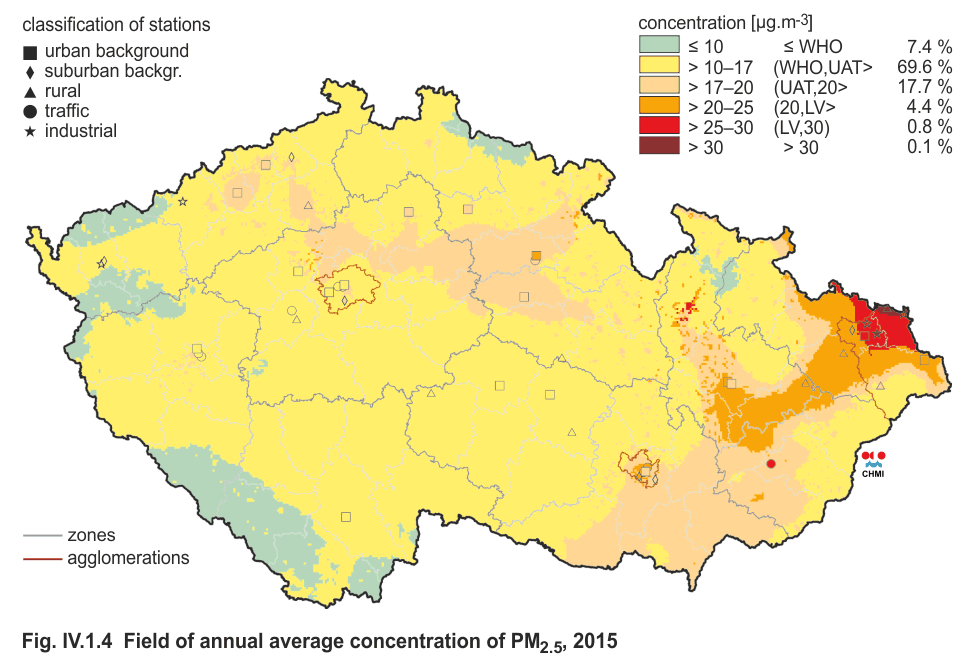
Fig. IV.1.4 Field of annual average concentration of PM2.5, 2015
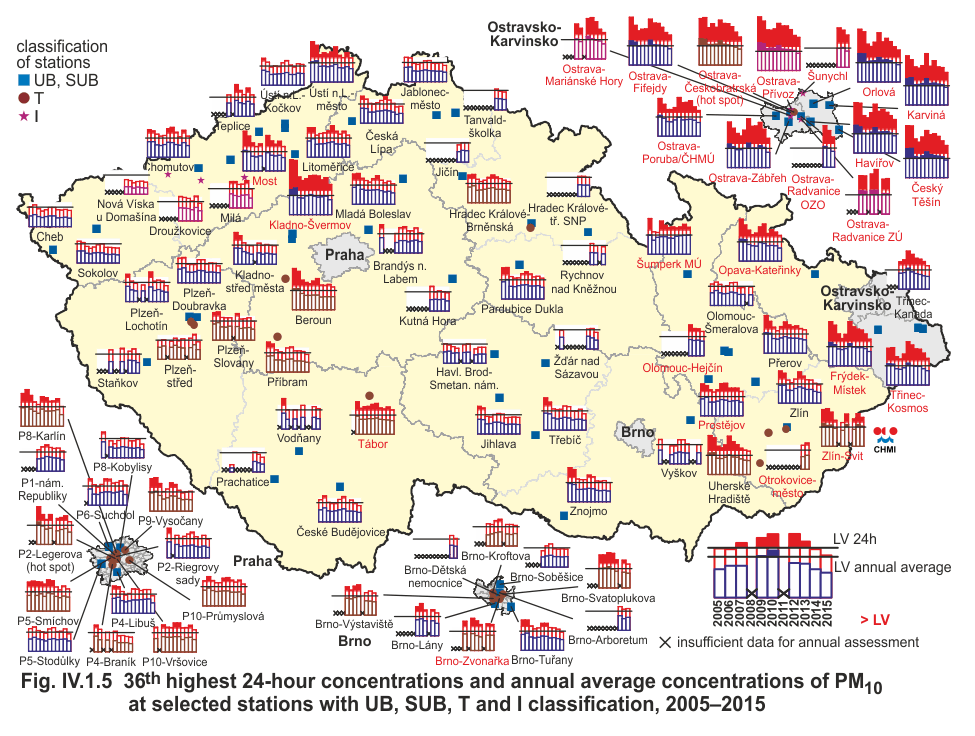
Fig. IV.1.5 36th highest 24-hour concentrations and annual
average concentrations of PM10 at selected stations with UB,
SUB, T and I classification, 2005–2015
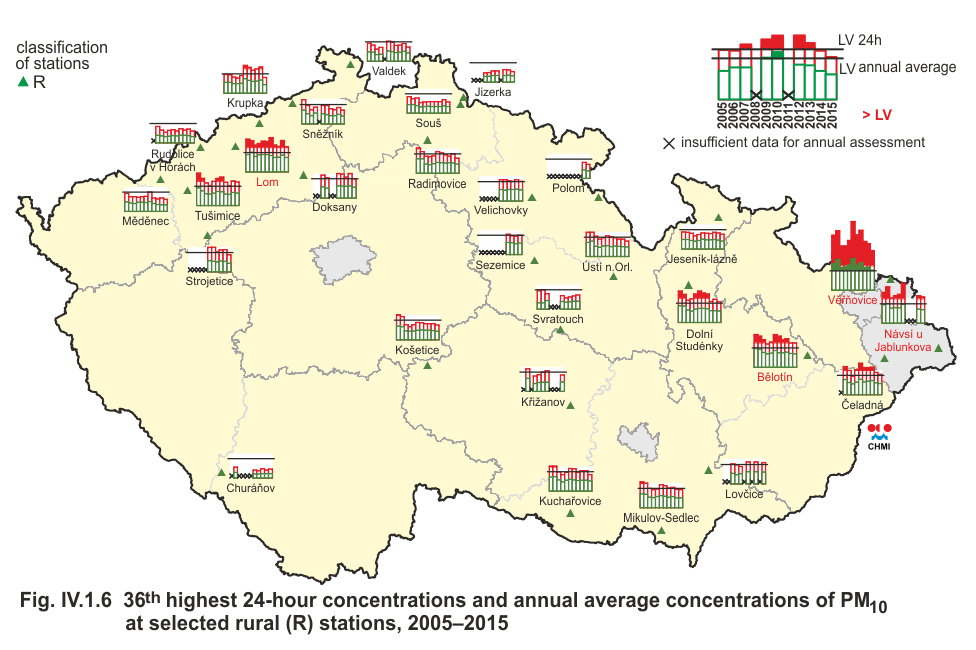
Fig. IV.1.6 36th highest 24-hour concentrations and annual
average concentrations of PM10 at selected rural (R) stations,
2005–2015
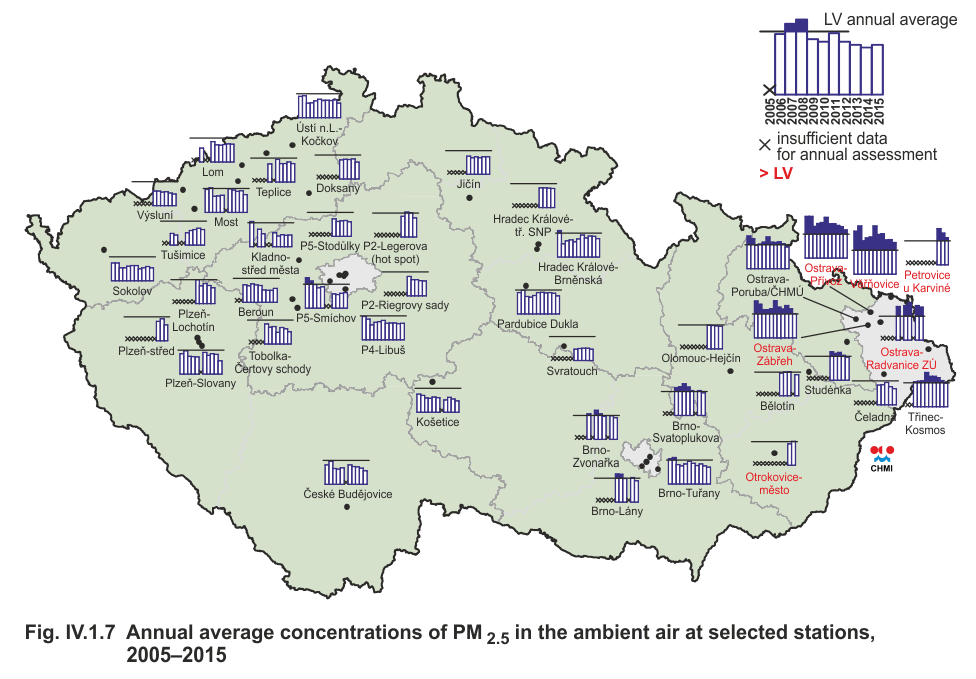
Fig. IV.1.7 Annual average concentrations of PM2.5 in the
ambient air at selected stations, 2005–2015
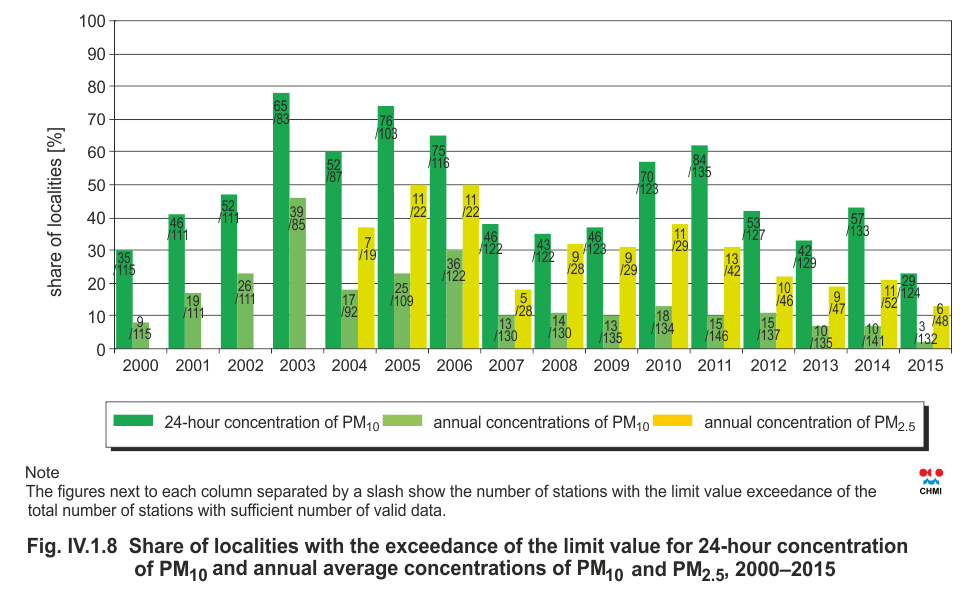
Fig. IV.1.8 Share of localities with the exceedance of the limit
value for 24-hour concentration of PM10 and annual average
concentrations of PM10 and PM2.5, 2000–2015
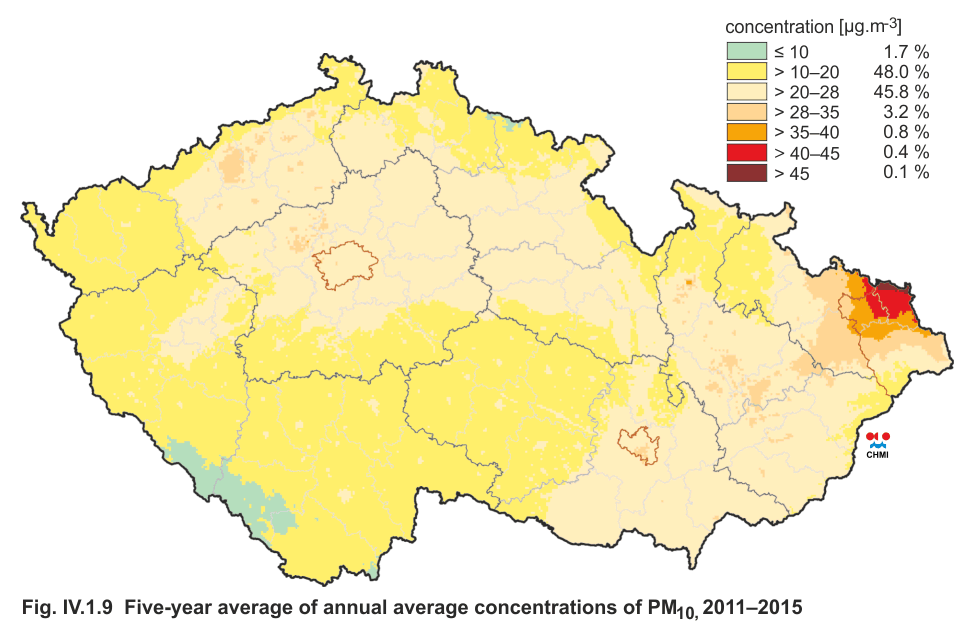
Fig. IV.1.9 Five-year average of annual average concentrations
of PM10, 2011–2015
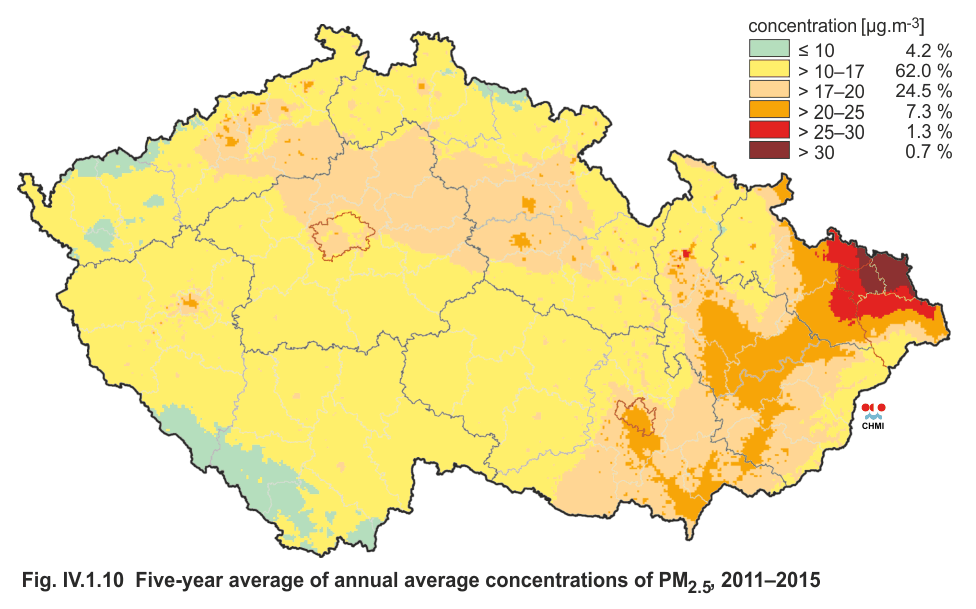
Fig. IV.1.10 Five-year average of annual average concentrations
of PM2.5, 2011–2015
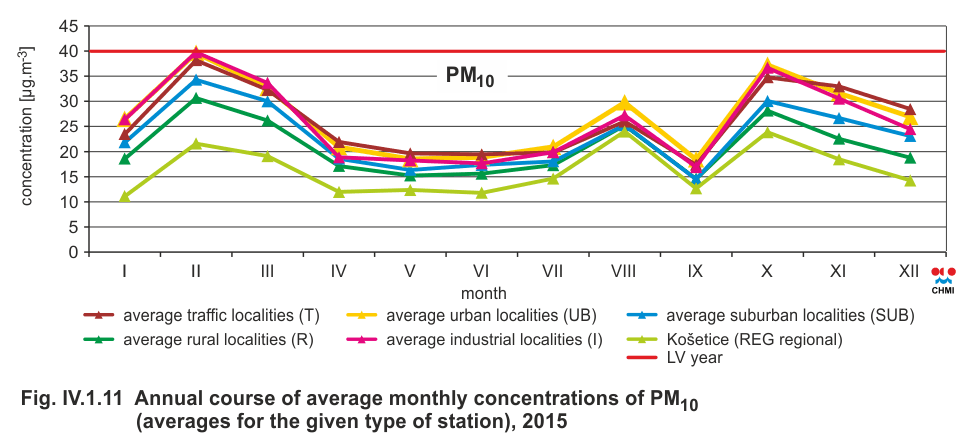
Fig. IV.1.11 Annual course of average monthly concentrations of
PM10 (averages for the given type of station), 2015
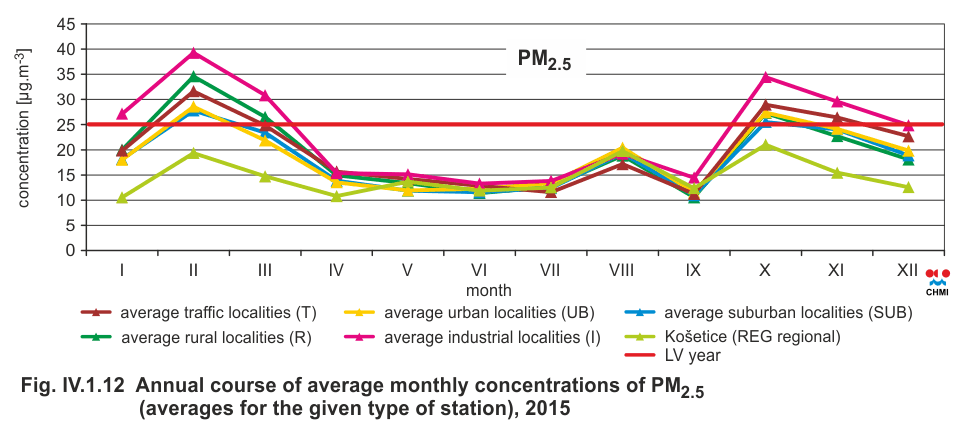
Fig. IV.1.12 Annual course of average monthly concentrations of
PM2.5 (averages for the given type of station), 2015
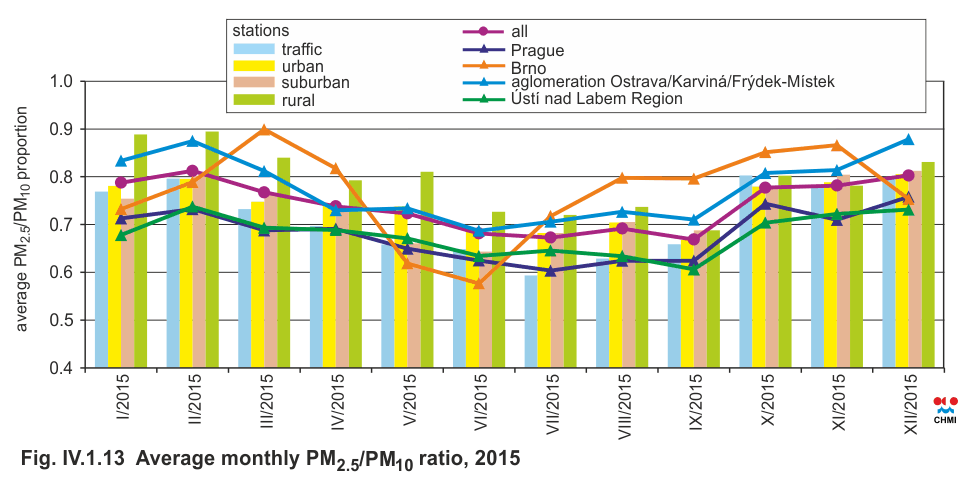
Fig. IV.1.13 Average monthly PM2.5/PM10 ratio, 2015
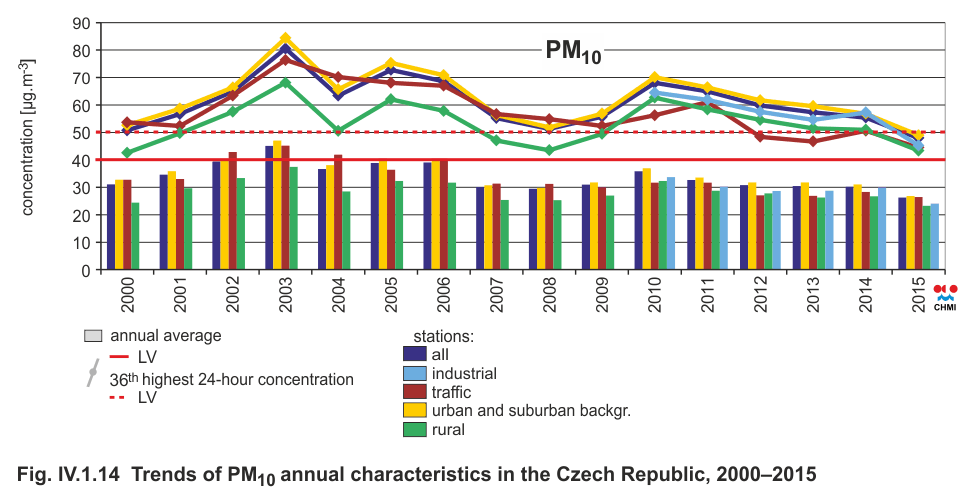
Fig. IV.1.14 Trends of PM10 annual characteristics in the Czech
Republic, 2000–2015
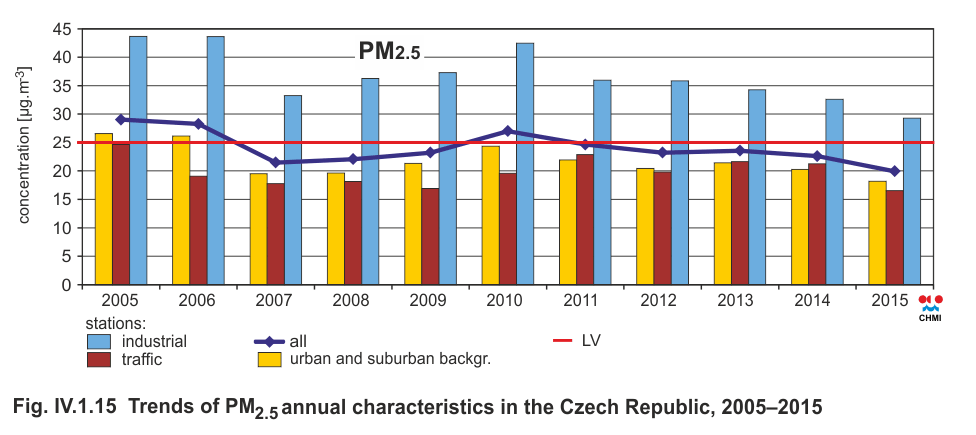
Fig. IV.1.15 Trends of PM2.5 annual characteristics in the Czech
Republic, 2005–2015
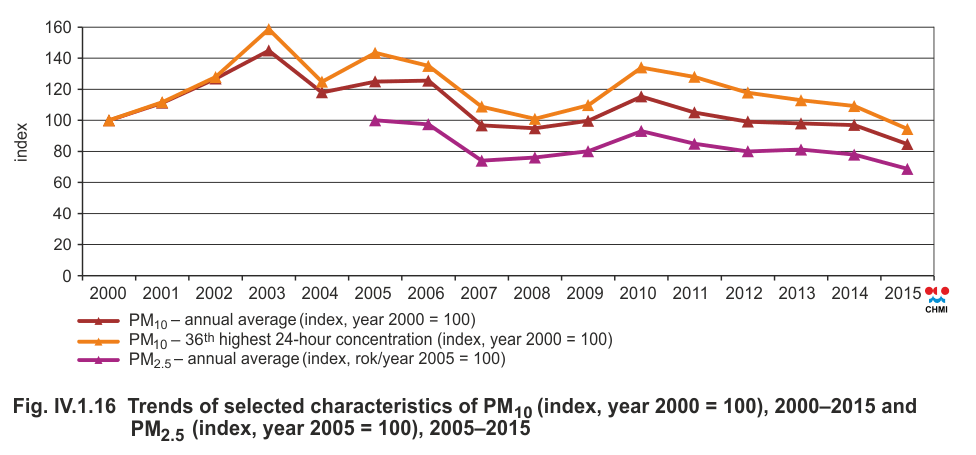
Fig. IV.1.16 Trends of selected characteristics of PM10 (index,
year 2000 = 100), 2000–2015 and PM2.5 (index, year 2005 = 100),
2005–2015
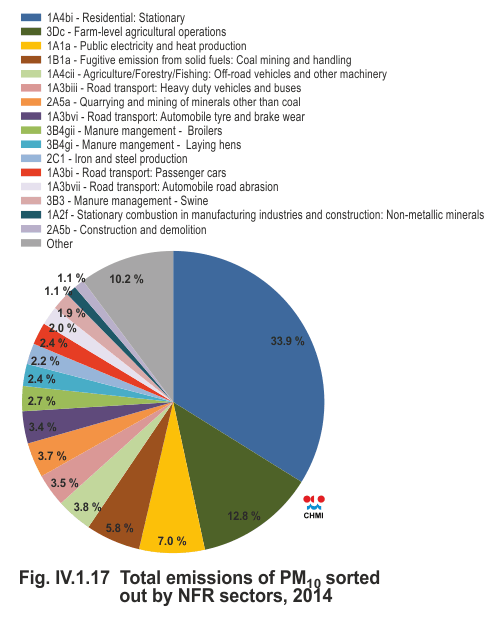
Fig. IV.1.17 Total emissions of PM10 sorted out by NFR sectors,
2014
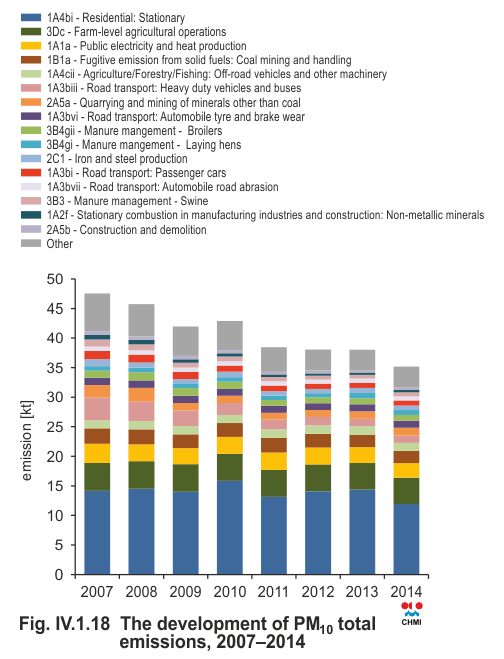
Fig. IV.1.18 The development of PM10 total emissions, 2007–2014
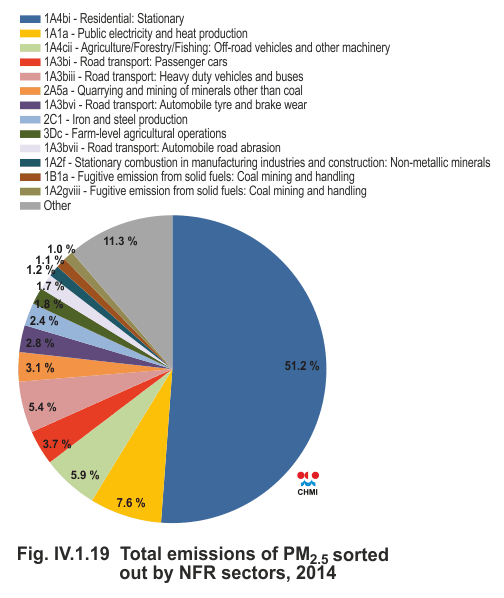
Fig. IV.1.19 Total emissions of PM2.5 sorted out by NFR sectors,
2014
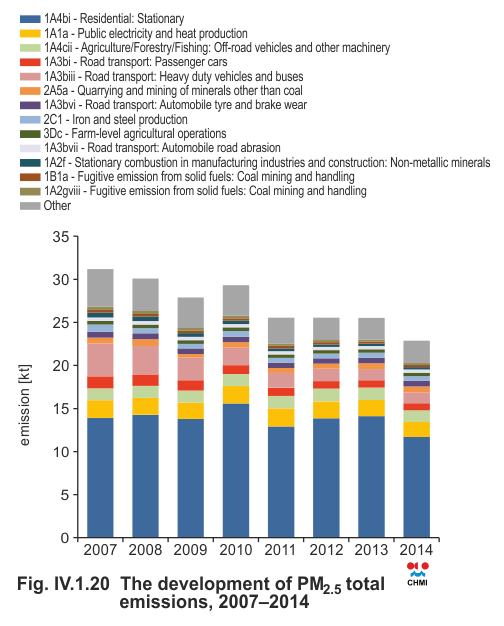
Fig. IV.1.20 The development of PM2.5 total emissions, 2007–2014
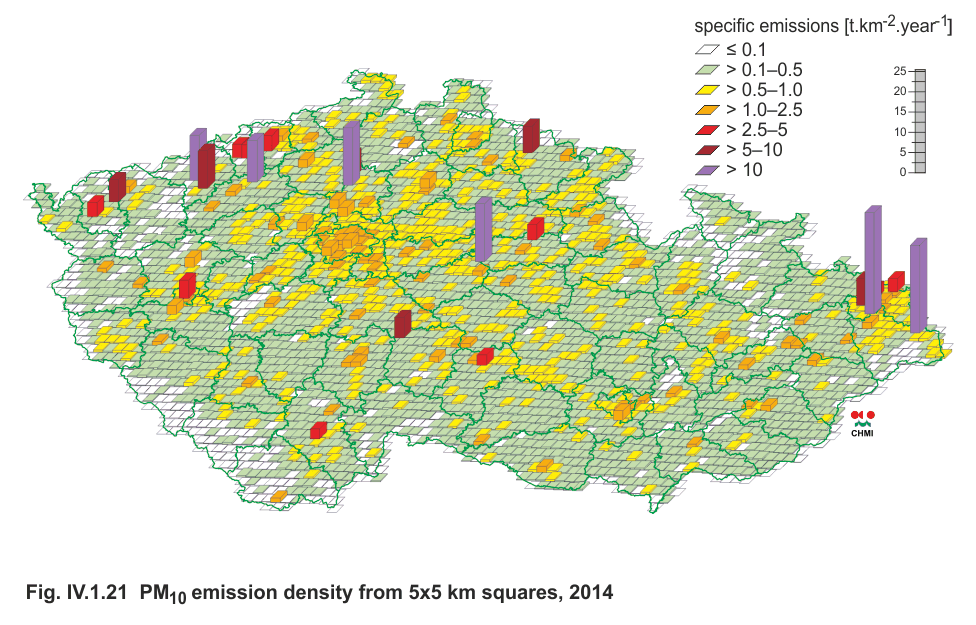
Fig. IV.1.21 PM10 emission density from 5x5 km squares, 2014
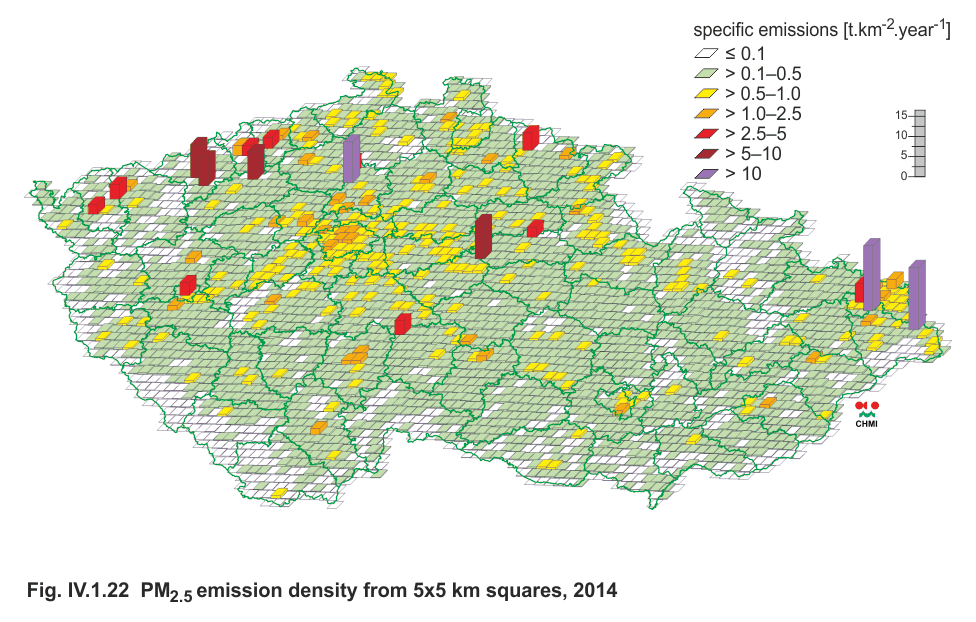
Fig. IV.1.22 PM2.5 emission density from 5x5 km squares, 2014
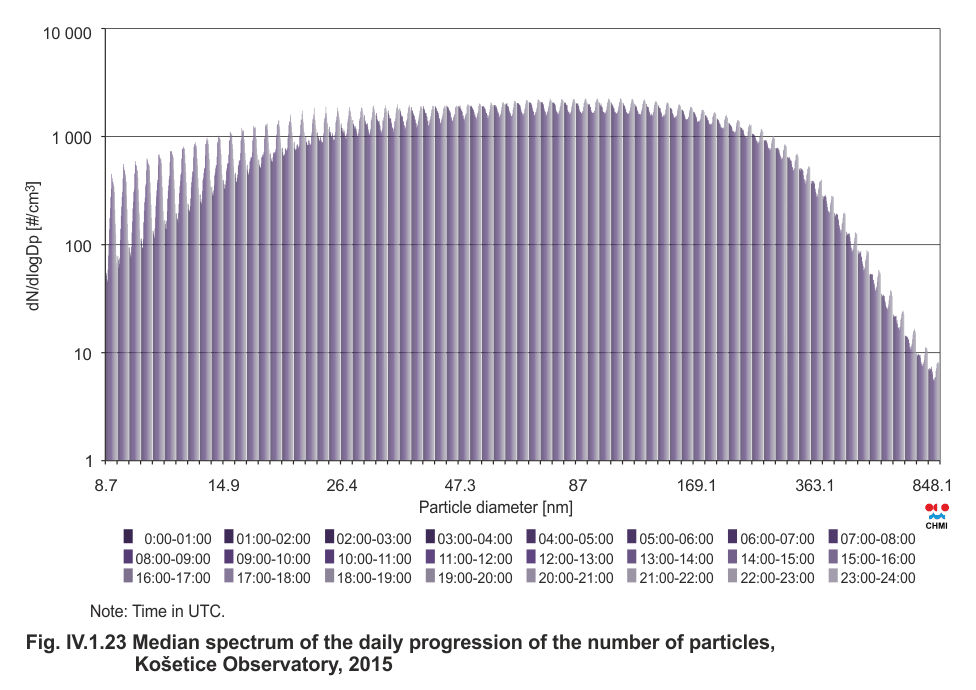
Fig. IV.1.23 Median spectrum of the daily progression of the number of particles, Košetice Observatory, 2015
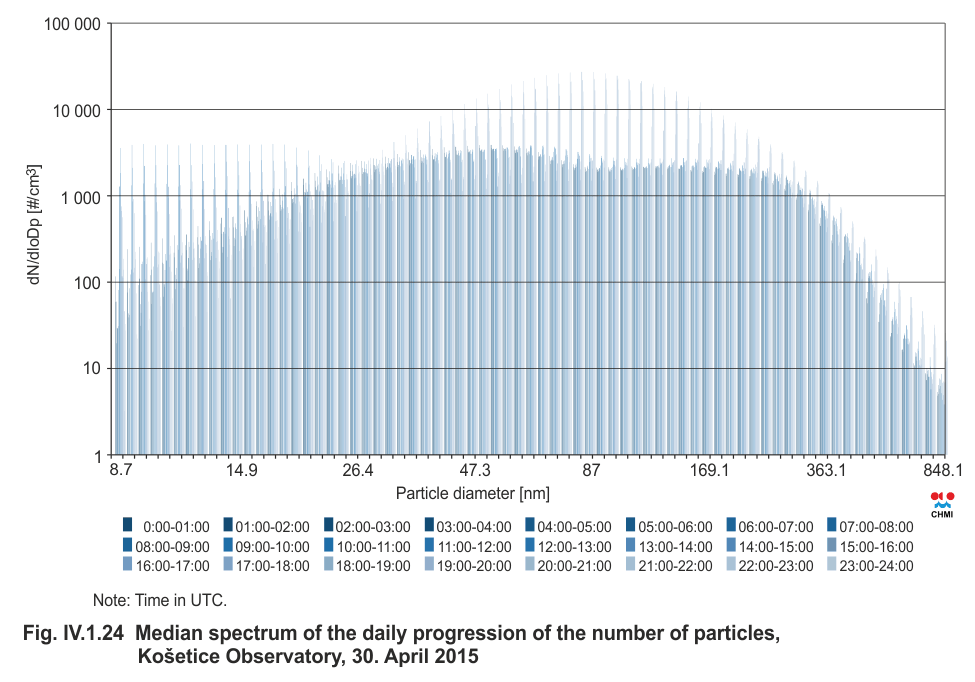
Fig. IV.1.24 Median spectrum of the daily progression of the number of particles, Košetice Observatory, April 30, 2015
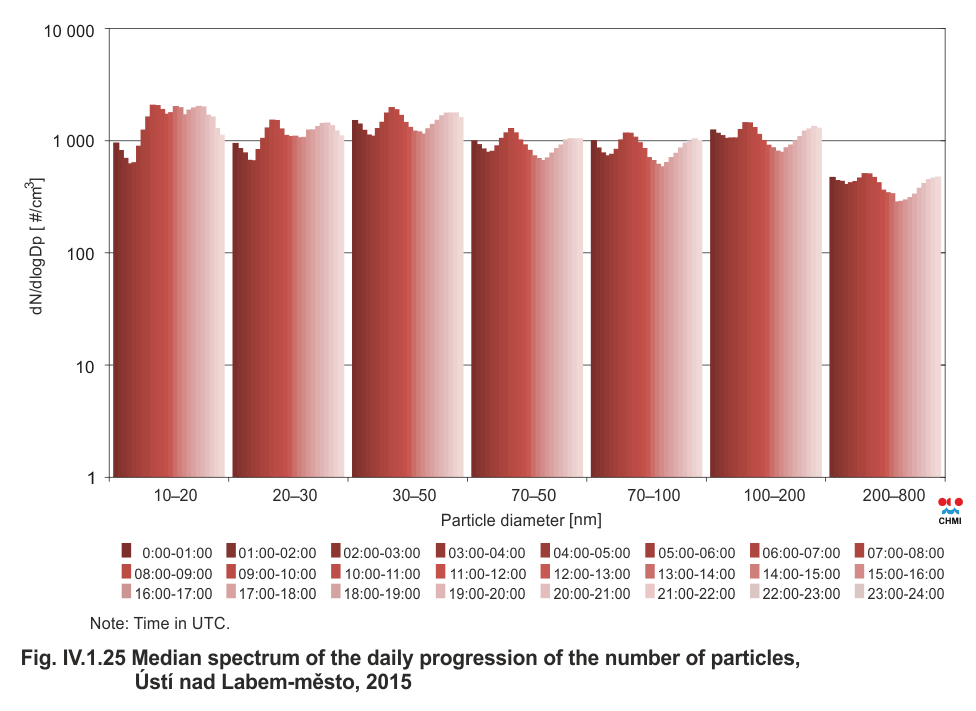
Fig. IV.1.25 Median spectrum of the daily progression of the number of particles, Ústí nad Labem-město, 2015
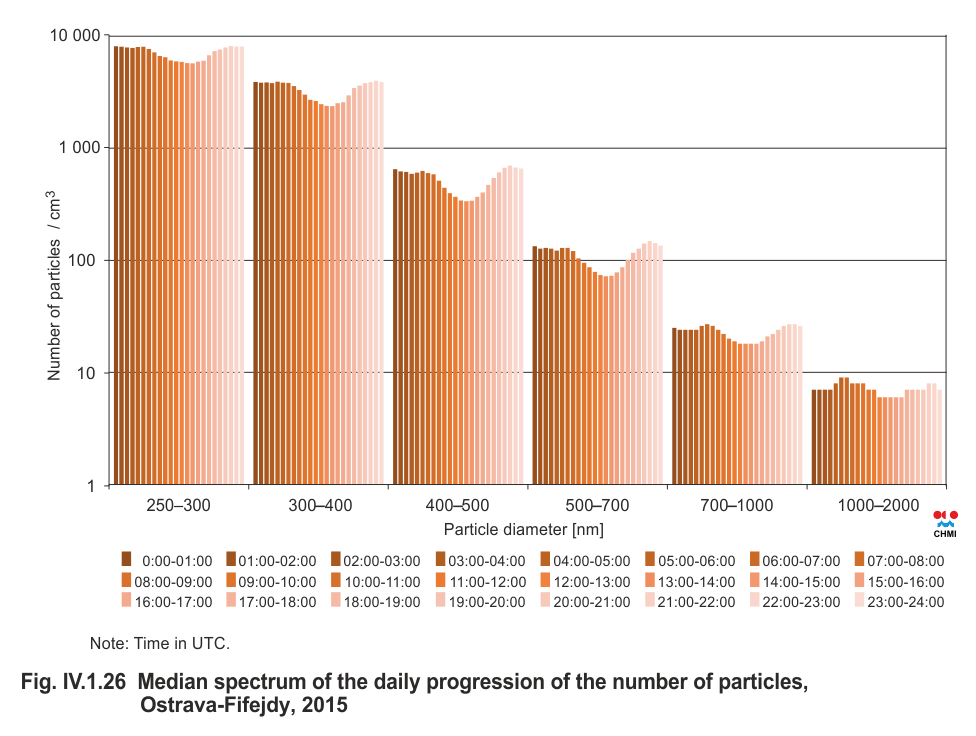
Fig. IV.1.26 Median spectrum of the daily progression of the number of particles, Ostrava-Fifejdy, 2015
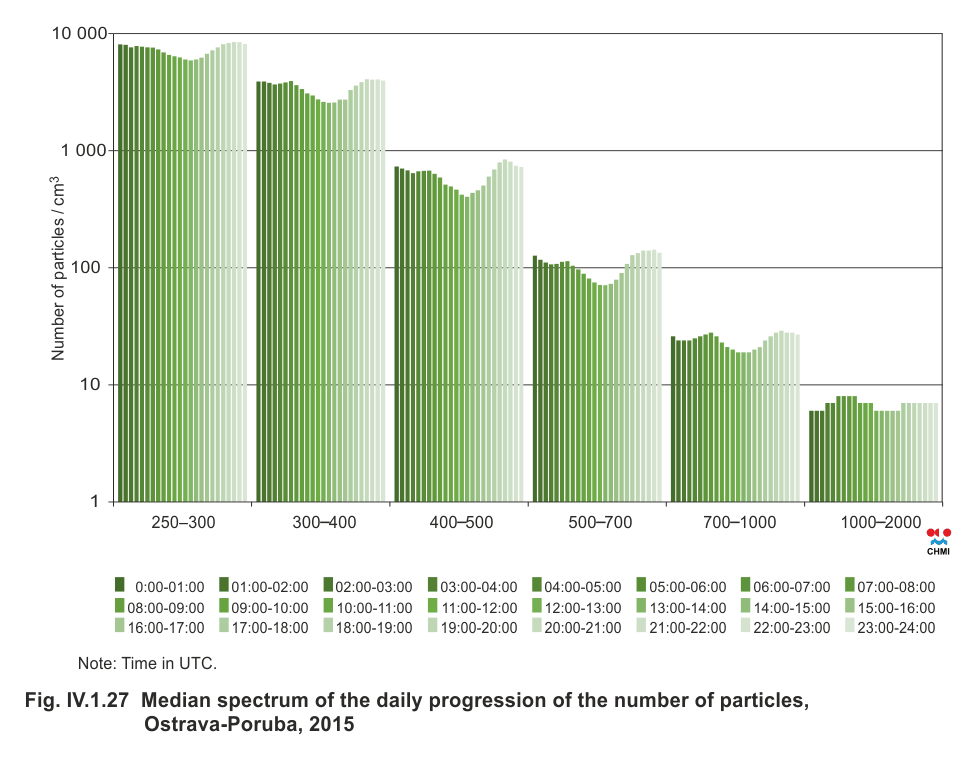
Fig. IV.1.27 Median spectrum of the daily progression of the number of particles, Ostrava-Poruba, 2015
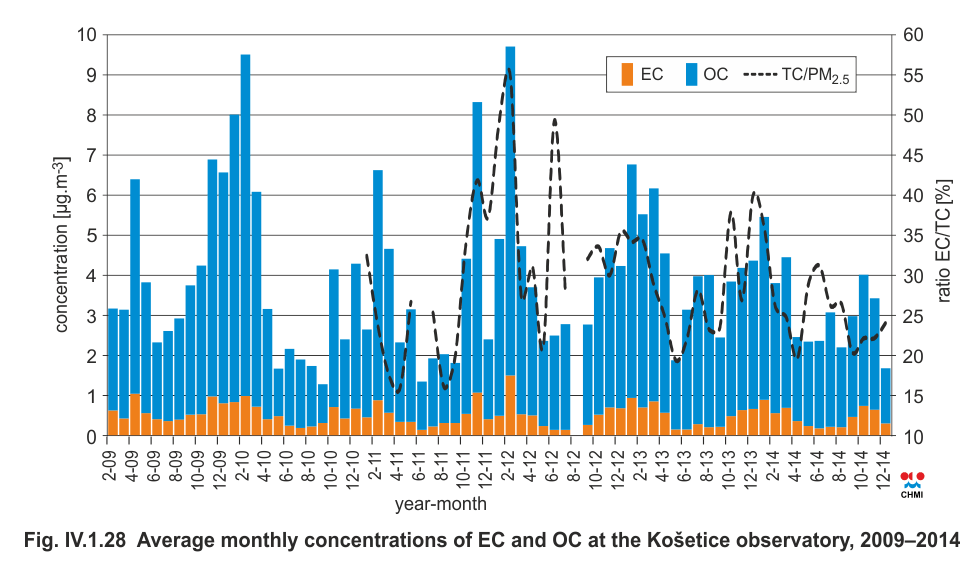
Fig. IV.1.28 Average monthly concentrations of EC and OC at the Košetice Observatory, 2015
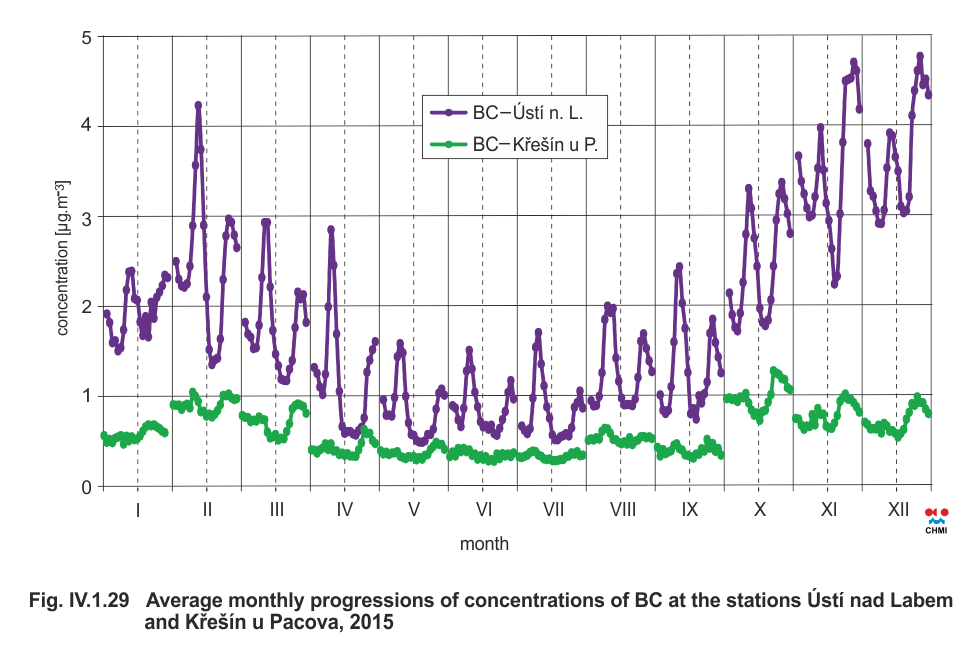
Fig. IV.1.29 Average monthly progressions of concentrations of BC at the stations Ústí nad Labem and Křešín u Pacova, 2015
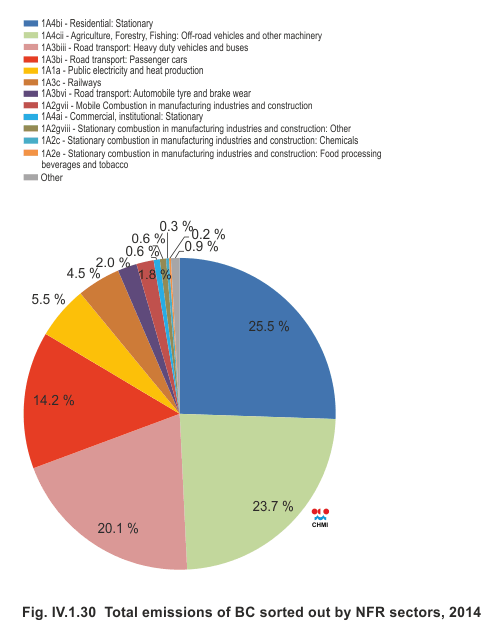
Fig. IV.1.30 Total emissions of BC sorted out by NFR sectors, 2014
1 Resuspended particles are particles previously settled on the Earth surface that are then lifted back into the air by wind or moving vehicles.
2 The author of this text wishes to thank Ing. Z. Wagner, CSc. (Institute of Chemical Processes CAS) for the processing of data from measurements taken by the SMPS spectrometer at Koše- tice, which have been used in the preparation of this subchapter.
3 Project ‘Air quality information system in the Polish-Czech border area in the Silesian and Moravian-Silesian region’, financed under the Operational Programme Cross-Border Cooperation Czech Republic-Poland 2007–2013; project registration number: CZ.3.22/1.2.00/09.01610.