IV.8 CARBON MONOXIDE
IV.8.1 Air pollution caused by carbon monoxide in the year 2014
In 2014 carbon monoxide (CO) concentrations were measured in 28 localities, classified in most cases as traffic localities in which the highest measured concentrations can be expected. Sufficient amounts of data for ambient air quality evaluation were reported from 21 stations. The maximum daily 8-hour running averages did not exceed, similarly as in the previous years, the limit value of 10,000 µg.m-3 at any of the stations (Table XIII.23). The highest daily 8-hour average concentration of CO was measured at the locality Ostrava-Radvanice ZÚ (4,415 µg.m-3). This quarter of the city is exposed to heavy loads from industry, traffic and local sources. The second highest 8-hour concentration of CO (3,225 µg.m-3) was recorded at the Ostrava-Českobratrská station, which is classified as a traffic hot spot; a strong influence of traffic is therefore assumed. The third highest 8-hour concentration of this pollutant was measured at the rural locality Tobolka-Čertovy schody (2,923 µg.m-3), where the increase was probably caused by the Vápenka Čertovy schody limeworks.
IV.8.2 Development of carbon monoxide concentrations
Fig. IV.8.1 shows the apparent decreasing trend of maximum 8-hour concentrations of CO at most localities in the Czech Republic. In 2014, CO concentrations were comparable with the previous year. At some stations, e.g. at the localities Tobolka-Čertovy schody and Prague 2-Legerova, there was an apparent decrease. Other stations, conversely, recorded a certain increase in CO concentrations. These were, for example, Ostrava-Českobratrská, Ostrava-Přívoz and Uherské Hradiště.
IV.8.3 Emissions of carbon monoxide
Emissions of CO are produced during the combustion of carbon-containing fuels at low temperatures and with insufficient amounts of combustion air. The greatest amount of CO emissions is produced in sector 1A4bi-Local household heating; the contribution of this sector to total country-wide CO emissions in 2013 amounted to 53.1 % (Fig. IV.8.2). Further significant sources include sectors 1A2a-Stationary combustion in manufacturing industries and construction: Iron and steel production (17.4 %), 1A3bi-Passenger car transport (8.8 %) and 1A3biii-Road freight transport over 3.5 t (4.1 %).
The downward trend of CO emissions in the years 2007–2013 was caused primarily by the natural renewal of the car fleet and the decrease of iron and steel production after the year 2007. Because of the prevailing influence of sector 1A4bi, this trend is strongly influenced by the course of temperatures during heating seasons (Fig. IV.8.3).
In individual parts of the Czech Republic, the contributions
of different types of sources to the total emissions varies
depending on the particular energy mix in each given region. Due
to the prevailing share of the local household heating sector,
CO emissions are distributed across the entire territory of
populated areas in the Czech Republic. The influence of
transport has its prevailing impact along highways and in big
cities. A large amount of CO emissions in the O/K/F-M
agglomeration come from the production of iron and steel (Fig.
IV.8.4).
Tab. XIII.23 Stations with the highest values of maximum 8-hour running average concentrations of CO
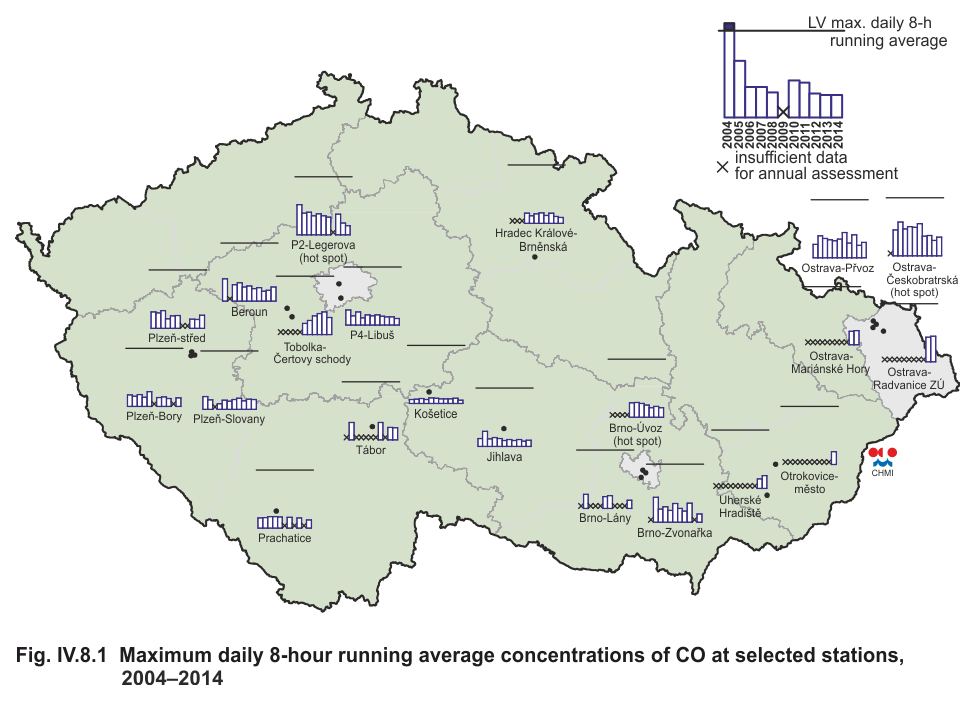
Fig. IV.8.1 Maximum daily 8-hour running average
concentrations of CO at selected stations, 2004–2014
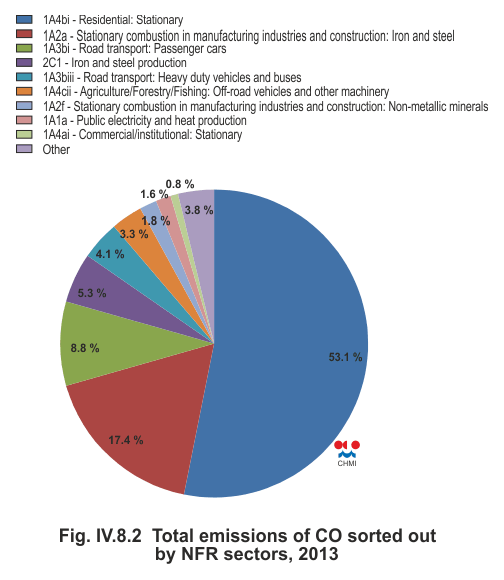
Fig. IV.8.2 Total emissions of CO sorted out by NFR sectors,
2013
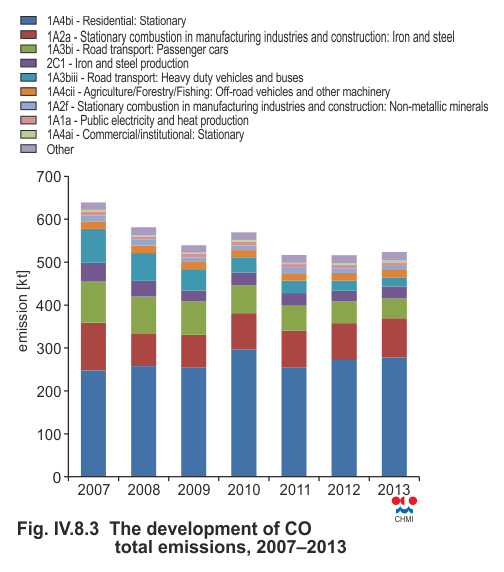
Fig. IV.8.3 The development of CO total emissions, 2007–2013
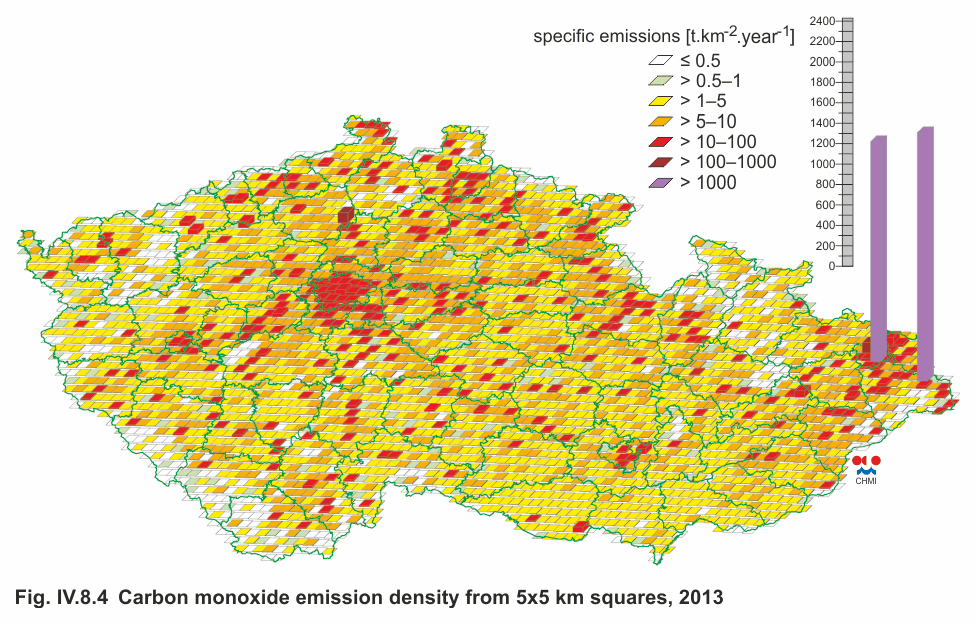
Fig. IV.8.4 Carbon monoxide emission density from 5x5 km squares,
2013