XI. AIR QUALITY EVALUATION
XI.1 BASIC SOURCES FOR AMBIENT AIR QUALITY EVALUATION
Ambient air quality evaluation published in the yearbook
covers the whole territory of the Czech Republic. It is
necessary to document the compliance with the legislative
requirements also in the areas where none of the limit values is
exceeded, and namely in accordance with one of the fundamental
principles of the Directive 2008/50/EC. Where the objectives for
ambient air quality laid down in this Directive are not met, the
member states should take action in order to comply with the
limit values and long-term objectives.
The level of air pollution is documented mainly in maps of
spatial distribution of air pollution characteristics. Measuring
stations are marked with symbols of different shape according to
the type of locality, and the concentration levels are indicated
with the colour of the symbol. The exceedance of the limit value
is marked with red colour, further basic thresholds between the
categories include the lower assessment threshold and upper
assessment threshold.
The diagram maps depict clearly the development of air pollution
characteristics in the period 2003–2013, the exceedance of the
limit value in 2013 is highlighted with the red name of the
respective station. The courses of concentrations of individual
pollutants at selected stations during the year 2013 are
documented by the graphs.
The graphs of trends of air pollution characteristics of
selected pollutants in agglomerations and in the whole territory
of the Czech Republic starting from the year 1996 show the long-term
development of the level of ambient air pollution. The values
depicted in the graphs are calculated as the average from
average concentrations only of those monitoring stations in the
given territory which measured the monitored pollutant for the
whole evaluated period.
The tables in the annex present individual pollutants in the
localities with the highest air pollution characteristics in
2013 (the values listed downwardly), the grey colour of the
background highlights the exceedance of the limit value.
The ambient air quality evaluation is founded on the
concentrations measured at monitoring stations. The measuring
network is densest in the areas with the highest levels of
pollutants’ concentrations, nevertheless it covers the whole
territory of the CR.
The backbone network of monitoring stations is represented by
the National air pollution network (SIS) operated by CHMI. It
includes both the automated monitoring stations (AMS, AIM) and
the manual stations (MIM) from which the obtained samples are
analyzed in CHMI laboratories. In many cases, in one locality
parallel ambient air pollution monitoring is carried out using
both automated and manual methods. The National air pollution
network is supplemented with monitoring stations of other
organizations and their measurement results are also used for
ambient air quality evaluation.
New calculation criteria pursuant to Annex I to the Directive
2008/50/EC and Annex IV to the Directive 2004/107/EC were
implemented for air quality evaluation in this yearbook. The
above annexes set the data quality objectives for ambient air
quality assessment. Pursuant to Annex I to the Directive
2008/50/EC and Annex IV to the Directive 2004/107/EC only data
from the measuring stations may be used for ambient air quality
evaluation for which the requirement for minimum data capture
amounting to 90 % is fulfilled. The requirements for the
calculation do not include losses of data due to the regular
calibration or the normal maintenance of the instrumentation.
Without prejudice to Annex I to Directive 2008/50/EC, the
criteria set in Annex XI of the same directive shall be used
when aggregating data and calculating statistical parameters.
Due to these changes some of the data presented in previous
yearbooks may slightly differ as compared with the data
presented in this yearbook.
XI.2 CLASSIFICATION OF STATIONS
The production of maps of air pollution characteristics and
ambient air quality evaluation are based on the EoI
classification of measuring stations (Table XI.2). This official
European classification has been implemented in all localities
in the CR registered in the Air Quality Information System (ISKO)
database. The complete EoI classification of localities consists
of three fundamental letters divided by strokes showing the type
of the locality, the type of the area and the characteristic of
the area. The third column shows only the examples of the
combinations for area characteristics; in fact, any logical
combination is possible, however, the first letter has the
highest priority. Further information on station classification
incl. the new legislation is presented in the 2013 “Summary
Tabular Survey” (CHMI 2014b).
The number of monitoring stations of basic pollutants operated
by selected organizations, from which the data are stored in the
ISKO database from, has been continuously changing since 1969.
The greatest number of stations was operated in the 80’s and
90’s of the 20th century. At present most stations are operated
by CHMI within the National air pollution network (Fig. XI.2).
SIS includes also four “hot spot” stations; this term is usually
used for the localities with high levels of air pollution. The
yearbook uses this name for the stations focused exclusively on
the monitoring of traffic influence on ambient air quality.
Monitoring stations with “hot spot” classification are operated
by CHMI in the localities with heavy traffic loads in Prague,
Brno, Ostrava and Ústí nad Labem.
XI.3 AIR QUALITY INFORMATION SYSTEM – AIR POLLUTION DATABASE
The concentrations measured by all monitoring networks are
stored in the ISKO air pollution database. The data has been
stored in ISKO since the beginning of the measurement, the
concentrations of sulphur dioxide and suspended particles
obtained from CHMI station networks in northern Bohemia and in
Prague has been stored since 1971.
ISKO has been continuously developed and operated on the basis
of state-of-the-art information technologies as an integrated
system for nation-wide comprehensive evaluation of the state and
development of air pollution; the system includes the collection,
storage and processing of data from air pollution automated and
manually-operated measuring networks in the Czech Republic (air
pollution database), as well as the storage and processing of
data on emissions and air pollution sources (emission database).
The former Air Pollution Information System (IIS) has become an
integral part of ISKO, as have other air quality information
systems on the agenda, especially the system of collection,
processing and storage of data on individually registered air
pollution sources and also the database on chemical composition
of precipitation and atmospheric deposition. Together with air
pollution data also supplementary meteorological data measured
at the great number of CHMI automated stations are stored in the
air pollution database, and they are used for the evaluation of
air pollution-meteorological relations.
In addition to the results from CHMI measurements ensured by the
staff of air pollution monitoring departments in the centre and
in the branches, the ISKO air pollution database includes also
data provided by the cooperating institutions, and mainly by
health institutes, Czech Energetic Works, a. s. (CEZ), Forestry
and Game Management Research Institute, p.r.i., Czech Geological
Survey, Water Management Research Institute TGM, p.r.i., Hydro-biological
Institute, municipal authorities and other contributors (Table
XI.1). The database also includes the information from the
boundary areas in Germany and Poland.
XI.4 AIR QUALITY INFORMATION SYSTEM – EMISSION DATABASE
Methodical development and annual nation-wide processing and
keeping of records of the emission database are guaranteed by
CHMI. In the time series starting approx. in 1984, there are
stored in the ISKO emission database the annual overviews of
emission data and supplementary technical data from the
operators of the most significant group of facilities (formerly
extra large and large sources called as REZZO 1). Starting from
the 90’s of the 20th century the database includes also the data
from the sources listed by the previous legislation among the so
called medium-sized air pollution sources (formerly REZZO 2
sources). The collection of reported data from stationary
sources, newly specified in Annex No. 2 of the Air Protection
Act, is carried out through the Integrated system of the
fulfilment of notification obligations (ISPOP) implemented by
Act No. 25/2008 Coll., on the integrated pollution register and
the integrated system of the fulfilment of notification
obligations in the field of environmental protection, and
amendments to several acts.
The new classification of facilities into the REZZO 1 and REZZO
2 categories is based on the form of the reported data of
summary operational records for the year 2013 where for approx.
40 % of the reported data the so called simplified form was used
(the conditions are set in the introductory text of Annex No. 11
to the Decree No. 415/2012 Coll., on permissible level of
pollution and its ascertainment and on the implementation of
several other provisions of the Air Protection Act describing
the list of data of the summary operational records).
XI.5 EMISSION BALANCE
Since 1997 emissions from local household heating units are
inventoried according to the methodology based on the General
Census data. The General Census data are regularly (once a year)
updated in cooperation with the regional suppliers of fuels and
energy. At present the modified method of the year 2006 is used
(Machálek, Machart 2006), and the 2011 General Census data are
included.
The final output of the model consists in data on emissions of
pollutants and on fuel composition for household heating units
at local level included in the database REZZO 3. In addition to
data on local household heating, also data on emissions from
other stationary sources, not listed in Annex No. 2 of the Air
Protection Act, comprising the mass use of solvents,
agricultural and building activity, are re-calculated in the
REZZO 3 database.
The inventory of emissions from mobile sources (REZZO 4) covers
road, railway, water and air transport processed by the
Transport Research Centre (CDV) in Brno based on their own
method and off-road mobile sources (agriculture, building
industry etc.) processed with the use of the data on fuel
consumptions (CSO) and emission factors based on the VÚTZ Prague
method.
XI.6 ISKO LINKS TO DATA SOURCES AND THE PRESENTATION OF DATA
ISKO is linked to data sources and cooperating systems,
mainly to air quality monitoring networks, sources of reported
data and to cross-sectional information systems. The
interconnection is carried out mainly through the exchange of
data by e-mail, on magnetic media, over switched data lines and,
in case of data from the automated air pollution monitoring
networks, mainly over radio transmission (Fig. XI.1).
The selected information, tables, graphs and maps both from the
”Summary Tabular Survey” and the graphic yearbook “Air Pollution
in the Czech Republic in 2013”, are accessible in CHMI website (www.chmi.cz),
where you can find other overviews relevant to ambient air
pollution. Under “Air Quality” there are also presented, with a
short time lag, the current results of measurements from
automated stations operated by CHMI and other organizations in
the form of tables, the so called air quality index, graphs and
estimate of spatial distribution of PM10, SO2, NO2 and O3 concentrations.
Tab. XI.1 Air pollution monitoring localities, based on the owner, Czech Republic, 2013
Tab. XI.2 Exchange of Information (EoI) station classification
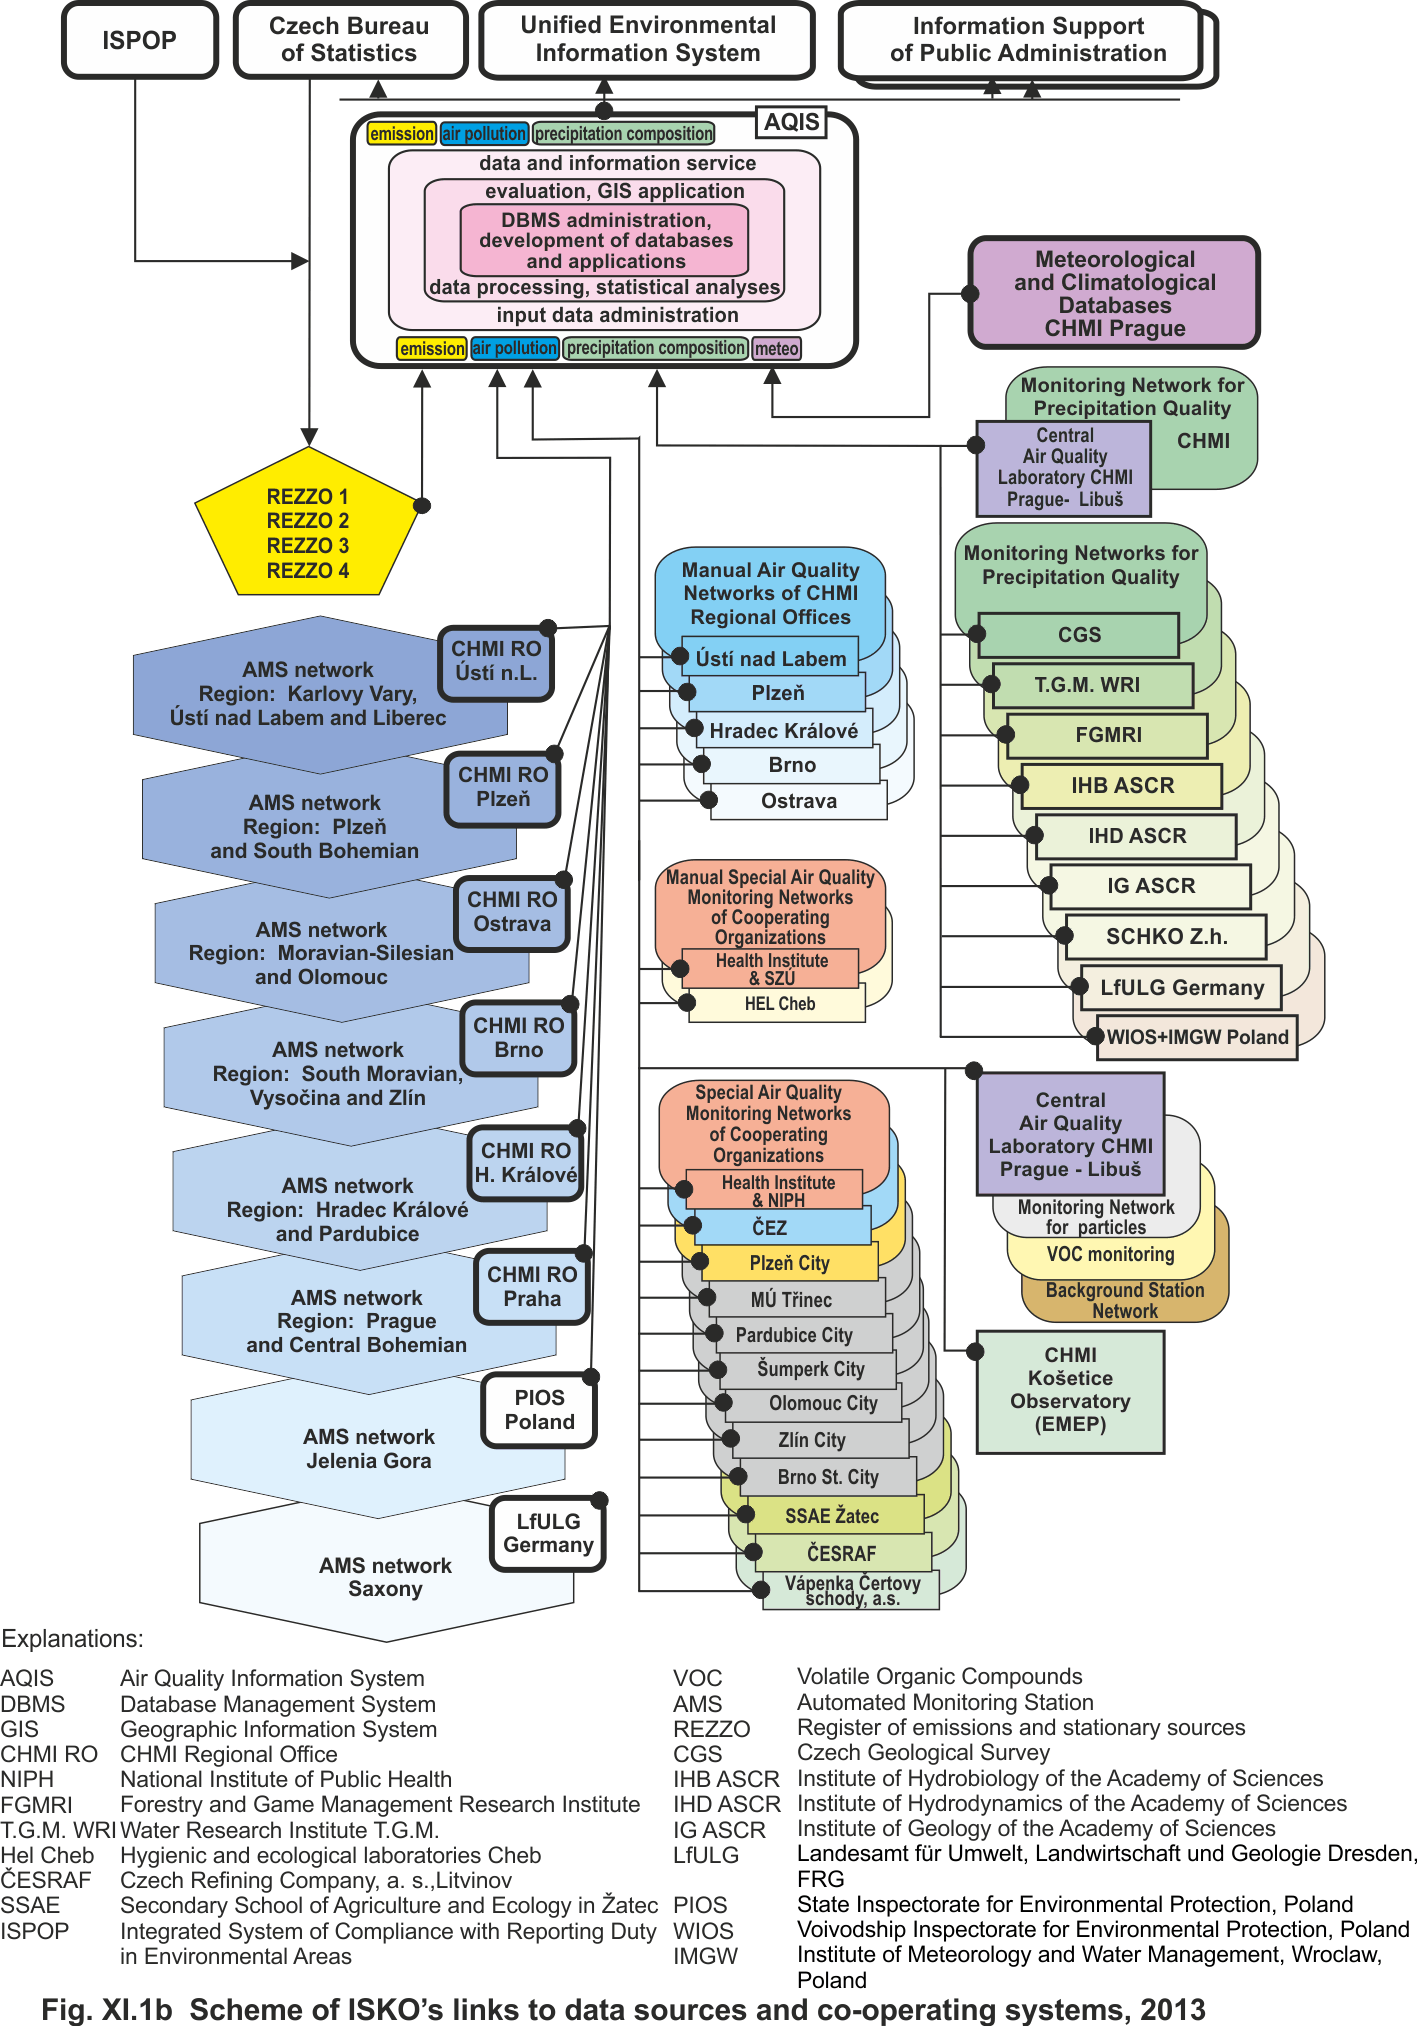
Fig. XI.1 Scheme of ISKO’s links to data sources and co-operating
systems 2013
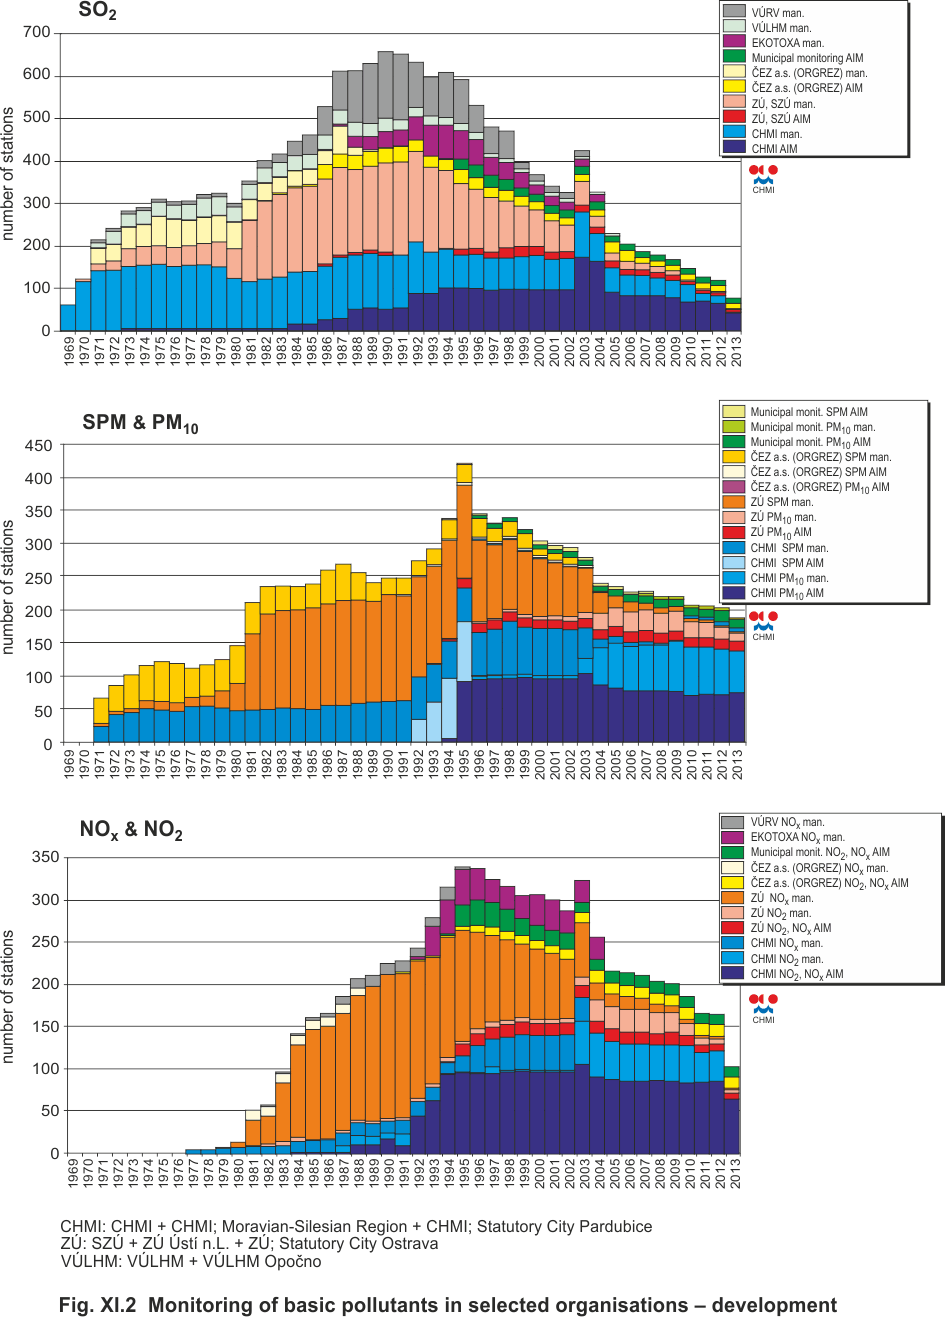
Fig. XI.2 Monitoring of basic pollutants in selected organisations – development