VII. AREAS WITH EXCEEDANCES OF LIMIT VALUES
VII.1 AREAS WITH EXCEEDED LIMIT VALUES WITH REGARD TO HUMAN
HEALTH PROTECTION
The Air Protection Act sets the limit values for the selected
pollutants without further distinguishing between limit values
and the target values. For the second time for the year 2013 the
areas with exceeded limit values are defined together for all
pollutants monitored with regard to human health protection.
The map of the areas with the exceedance of at least one limit
value1 (ozone excluded) presents the complete information on
ambient air quality in the territory of the CR in 2013. Within
the evaluated year 17.5 % of the CR territory with approx. 54.6
% of population was defined as the above areas (Fig. VII.2).
More detailed analysis (Table VII.1) shows quite clearly that
the inclusion of zones and agglomerations into these areas is
mostly caused by the exceedance of the daily limit value for
PM10 suspended particles and by the exceedance of the annual
limit value for PM2.5 and benzo[a]pyrene. In some areas, mainly
in those with traffic and industrial loads, the inclusion of the
respective territory to these areas in 2013 was influenced to a
certain extent also by the exceedance of the limit value for
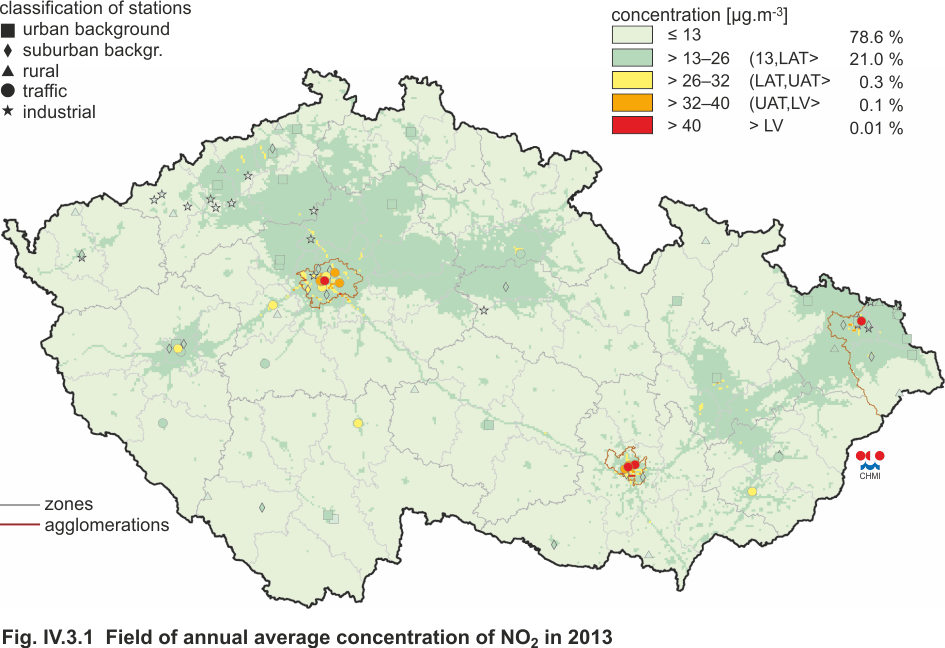
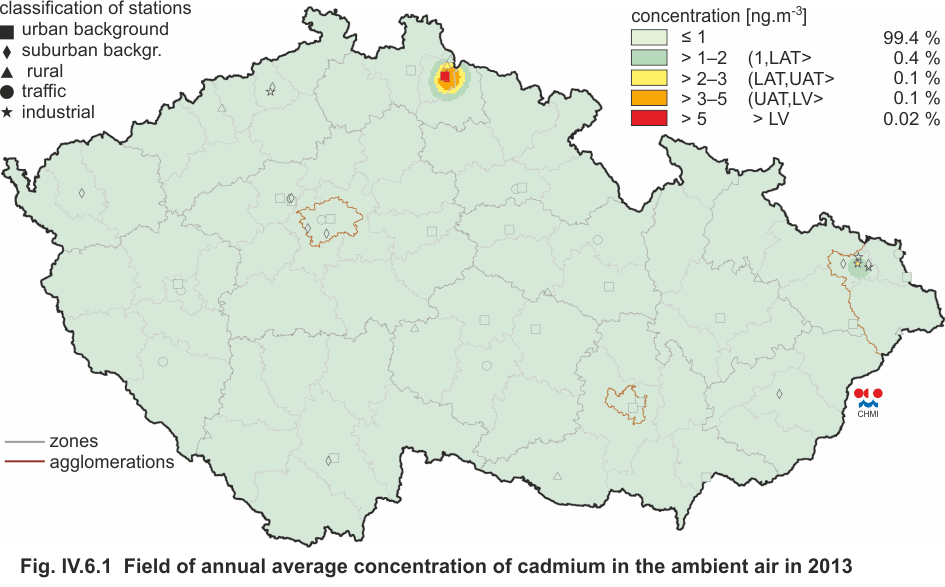
NO2, cadmium and arsenic (Chapter IV. and
Figs. IV.3.1,
IV.6.1 and
IV.6.2). The limit value for benzene, the pollutant which
contributed to the inclusion of some territories into these
areas in the agglomeration of O/K/F-M, was not exceeded for the
first time since the start of benzene measurements in 1999.
The year-to-year comparison shows that the share of the areas
with the exceedance of at least one limit value1 decreased,
which is given mainly by the reduction of the territory with the
exceedances of limit values for PM10 and benzo[a]pyrene.
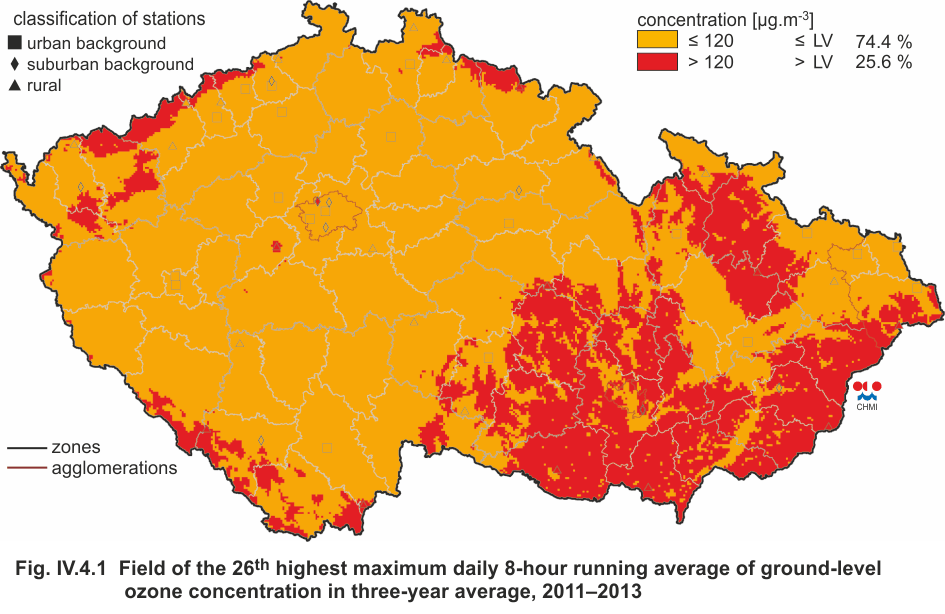
After including the ground-level ozone, 37 % of the territory of
the CR was defined as the areas with the exceedance of at least
one limit value (Fig. VII.1). The share of inhabitants living in
these areas is approx. 60 %. The rise of the share of
inhabitants after including the ground-level ozone into these
areas is not high. This is caused by the fact that the increased
to above-the-limit ozone concentrations occur mainly in
relatively clean natural areas, i.e. in the areas with lower
population density (Fig. IV.4.1). Nevertheless, in 2013, in
comparison with the year 2012, the share of the territory/population
exposed to the above-the-limit O3 concentrations increased (more
details see in Chapter IV.4).
In order to keep the continuity of evaluation from the previous
years (Fig. VII.3,
Table VII.1), particularly also the
territories with the exceeded limit values set by point 1 (formerly
the areas with deteriorated air quality, so called OZKO) and the
territories with exceeded limit values set by point 3 (formerly
the areas with the target values exceedances, ozone excluded)
were delineated. The development of the delineation of these
areas (formerly OZKO) is given mainly by the above-the-limit air
pollution caused by PM10 particles and to a certain extent it
corresponds with the trend of their concentrations (Chapter
IV.1.2), i.e. the largest areas of OZKO were defined in the
years 2006, 2010 and 2011. The development of areas formerly
called the areas with the target values exceedances (ozone
excluded) is given mainly by the above-the-limit air pollution
caused by benzo[a]pyrene. However, for further evaluation it is
necessary to consider also the uncertainty of the estimate of
the fields of annual average benzo[a]pyrene concentrations (Chapter
IV.2, Annex I).
The areas with exceeded limit values have been delineated since 2006. Considerable part of the territory of the CR is still exposed to the abovethe-limit concentrations of ambient air pollutants. The maps in Figs. VII.1 and VII.2 show clearly that these areas are very densely populated.
VII.2 AREAS WITH EXCEEDED LIMIT VALUES WITH REGARD TO THE
PROTECTION OF ECOSYSTEMS AND VEGETATION
With regard to the protection of the most valuable natural
localities in the CR there were evaluated the exceedances of the
limit values2 for the protection of ecosystems and vegetation in
the territory of NP and CHKO (Table VII.2). In total,
exceedances were recorded in 0.7 % of the territory of NP and
CHKO (Fig. VII.5). On the basis of spatial distribution, the
above-the-limit concentrations of NOx occur mainly near
communications; with regard to the most valuable natural areas
in the CR, the limit value for NOx was exceeded in a very small
territory of several CHKO in the CR (Table VII.2).
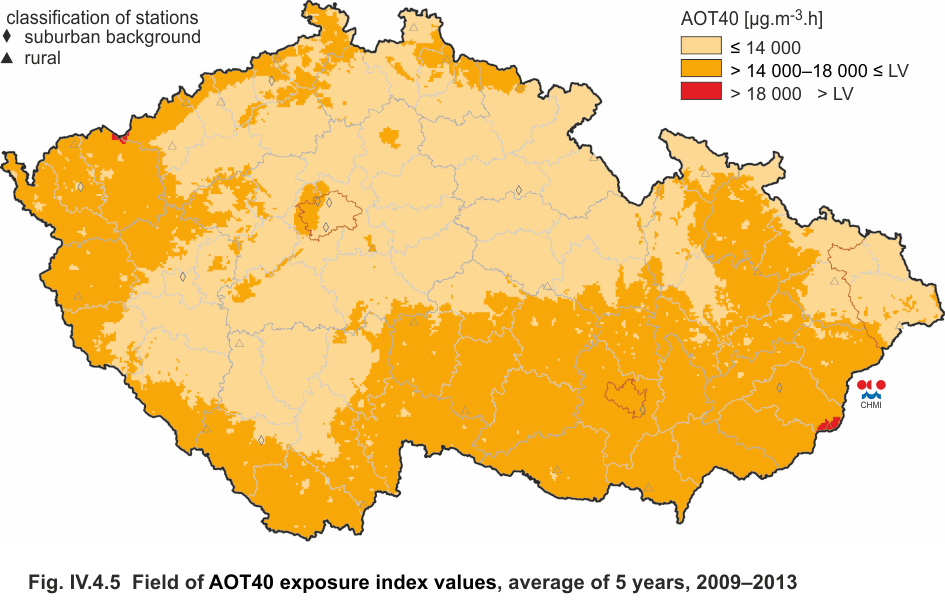
The limit value for ground-level ozone, i.e. the AOT40 exposure
index, is usually exceeded in a relatively large territory of
the CR. In 2013, however, the AOT40 values decreased in 91 % of
localities (Chapter IV.4.1) and its exceedances were recorded
only in a small part of the CR territory (Fig. IV.4.5) within
the CHKO Bílé Karpaty (Fig. VII.5).

Fig. VII.1 Areas with exceeding of the health protection
limit values, incl. ground-level ozone, 2013

Fig. VII.2 Areas with exceeding of the health protection limit
values, ground-level ozone excluded, 2013
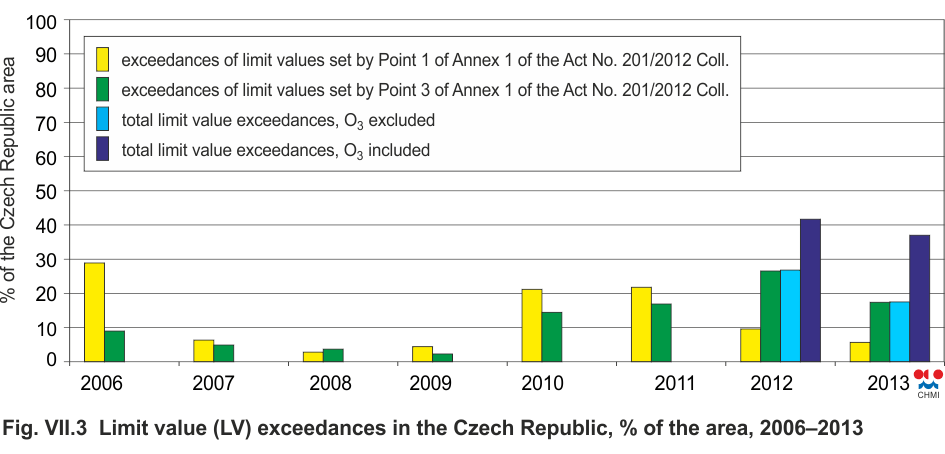
Fig. VII.3 Limit value (LV) exceedances in the Czech Republic, %
of the area, 2006–2013
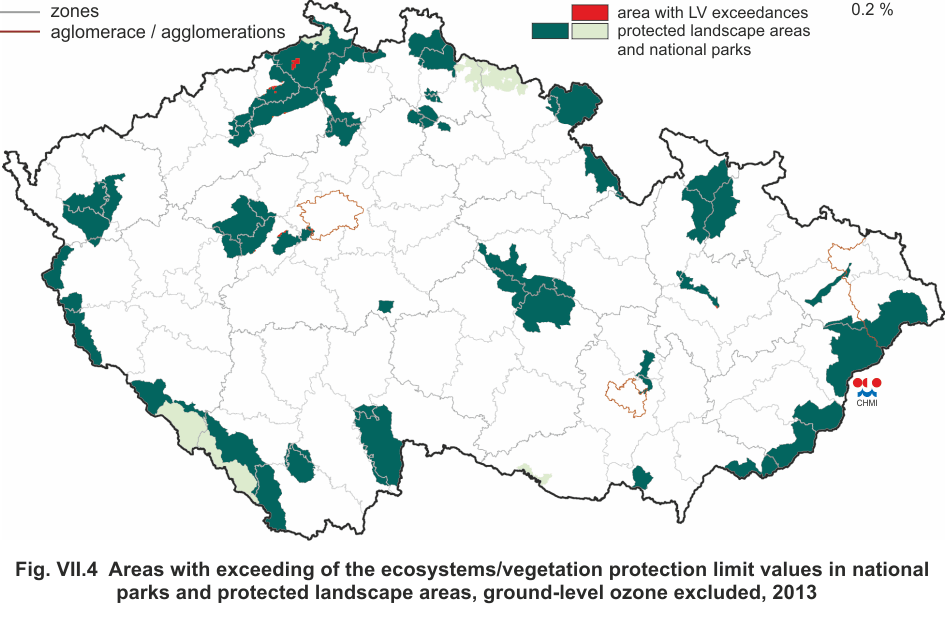
Fig. VII.4 Areas with exceeding of the health protection limit
values, ground-level ozone excluded, 2013
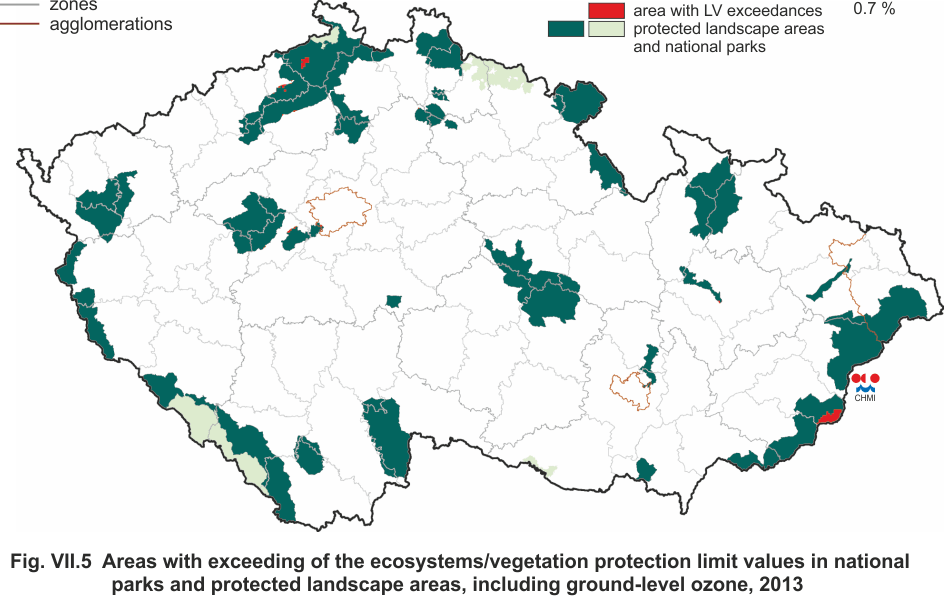
Fig. VII.5 Areas with exceeding of the health protection limit values, incl. ground-level ozone, 2013
1Annual limit value for PM10, PM2.5, benzo[a]pyrene, NO2, lead, cadmium, arsenic, nickel and benzene, limit value for CO (max. daily 8-hour running average), daily limit value for PM10 and SO2, 1-hour limit value for SO2 and NO2.
2LV for the annual and winter average concentration of SO2, LV for the annual average concentration of NOx and the LV for O3 expressed as AOT40 exposure index.