V.3 THE AGGLOMERATION OF OSTRAVA/ KARVINÁ/FRÝDEK-MÍSTEK
The agglomeration of Ostrava/Karviná/Frýdek-Místek (O/K/F-M) is one of the most urbanized and industrialized areas in central Europe, geographically it covers the southwestern part (approx. one fifth) of the Upper Silesian basin, extending for the greater part in the territory of the Republic of Poland. The area has historical loads from extensive industrial activities in the Upper Carboniferous basin. The sources of ambient air pollution in this area include high concentration of industrial production, high density of built-up areas with local heating using solid fuels and concentrated transport infrastructure on both sides of the Czech-Polish border. Specific problems of the area are caused by the emissions from burning slag heaps and by the significant effect of fugitive emissions from large industrial facilities. The villages and towns in most of the agglomeration territory are very close to each other, they are almost connected (so called Silesian type of house building), and the industrial zones form the part of the cities. The concentrations of suspended particles measured at the stations classified as rural or background are significantly higher than at similarly classified stations in other parts of the CR. This is caused by high emissions in the cross-border area, i.e. not only by the production of pollutants produced by sources on the Czech side of the border, but also by the transborder exchange of pollutants with the Republic of Poland (more details see e.g. in the results of transborder projects Air Silesia and Clean Border1). Due to the above-thelimit concentrations of some pollutants recorded in the long term the area is covered by a dense network of 24 air pollution monitoring stations2.
V.3.1 Ambient air quality in the agglomeration of
Ostrava/Karviná/Frýdek-Místek
Suspended particles PM10 and PM2.5
The limit value concentrations of suspended particles and some
other pollutants bound to them, e.g. poly-cyclic aromatic
hydrocarbons (PAH), are exceeded in the agglomeration of O/K/F-M
in the long term.
The values measured in urban localities of the agglomeration
rank high in the statistical records within the CR. The highest
average annual concentrations of PM10 and PM2.5 are measured in
the localities near the Czech-Polish border affected by
emissions both from the Czech Republic and the Republic of
Poland. The concentrations below the limit values are measured
mostly in the southern part of the agglomeration in background
and rural localities of the Moravskoslezské Beskydy Mts. and
their foothills. The PM10 and PM2.5 concentrations in the
agglomeration are characterized by more marked growth in winter
period in comparison with other areas of the CR. The ratio of
PM2.5/PM10 concentrations is higher in the Moravia-Silesia
region than in other parts of the CR, i.e. the share of fine
particles in PM10 is higher mainly in the cold part of the year.
In 2013 the above-the-limit annual average concentrations of
PM10 particles were measured in the cities in the Karviná area
and in most localities in Ostrava (Fig. V.3.1). The above-the-limit
annual average concentration of PM2.5 was measured in all
localities monitoring this fraction, with the exception of the
background locality Čeladná (Fig. V.3.2). Unlike other areas,
the measuring stations in the agglomeration of O/K/F-M record
the above-thelimit daily concentrations of PM10 also in summer
months, even in suburban localities. The highest share of the
days with above-the-limit values was recorded as usually in the
cold part of the year during the heating season, with peak
levels in January and February (Fig. V.3.3). The permissible
number of 35 days with above-the-limit daily concentration set
by the legislation was exceeded in all localities with
continuous measurement of PM10 in 2013, the most polluted
localities in the agglomeration (industrial localities and
localities near the Czech-Polish border in the Karviná area) was
exceeded already in the first months of the calendar year. In
the localities Ostrava-Radvanice ZÚ (industrial locality) and
Ostrava-Zábřeh (locality influenced by ongoing building activity)
the above-the-limit daily values occurred in more than 100 days
(Fig. V.3.4).
During the long episodes with inversions the concentrations of
pollutants, primarily those of suspended particles, are
gradually increasing, which results in the exceedance of the
limit values and threshold values for smog situations. During
January and February 2013 four smog situations were announced in
the agglomeration and in the Třinec area, and on 17–18 February
2013 regulation was announced in the agglomeration of O/K/F-M
without Třinec area, i.e. there were valid special conditions of
operation for stationary sources contributing significantly to
air pollution level by exceeding the regulatory threshold value
for PM10 particles pursuant to the Air Protection Act. In
November 2013 smog situation was announced in the agglomeration
of O/K/F-M without Třinec area. The length of all smog
situations in the year 2013 was 426 hours (almost 18 days).
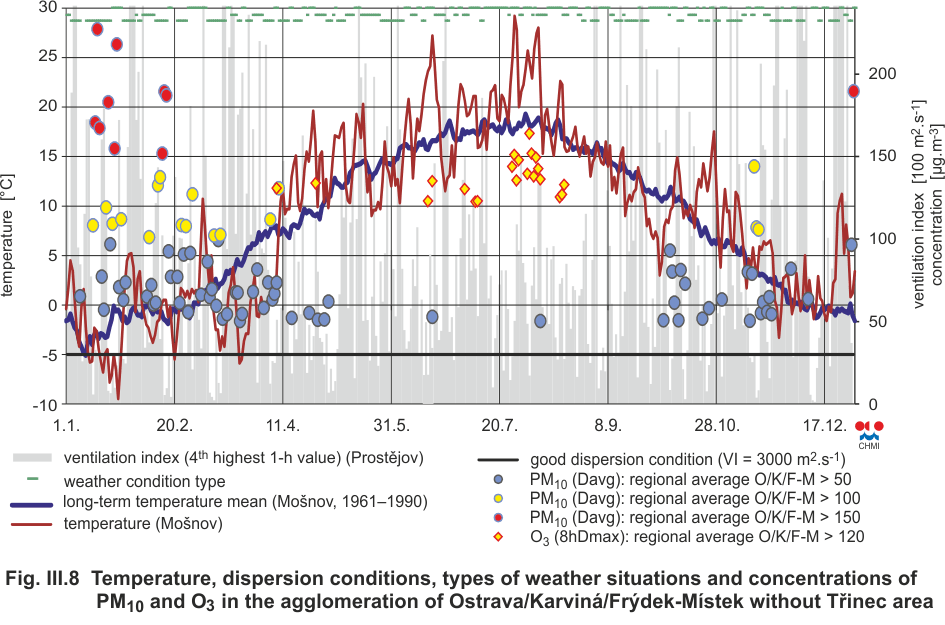
The annual course of air pollution in 2013 was influenced by
high air pollution concentrations in January and February. In
comparison with the previous year the total number of days with
abovethe-limit daily concentrations of PM10 per calendar year
increased in urban localities of the agglomeration. Due to
atypical character of the weather at the end of the year 2013
with prevailing good dispersion conditions in the area, the
result average annual concentrations of PM10 and PM2.5 particles
remained comparable with the previous two years (Fig. III.8). The increase of the number of exceedances of the daily limit
value and the annual average concentration of PM10 in 2013 as
against the values measured in the previous years was recorded
in the locality Ostrava-Zábřeh due to the local influence of the
measuring site by ongoing construction of road connection. The
estimated contribution of this building activity to the annual
average is approx. 10 %, i.e. several micrograms. The number of
exceedances of the daily limit value in other stations in
Ostrava increased in 2013 as compared with the year 2012 by
approx. 10–15 %, in Ostrava-Zábřeh by 61 %.
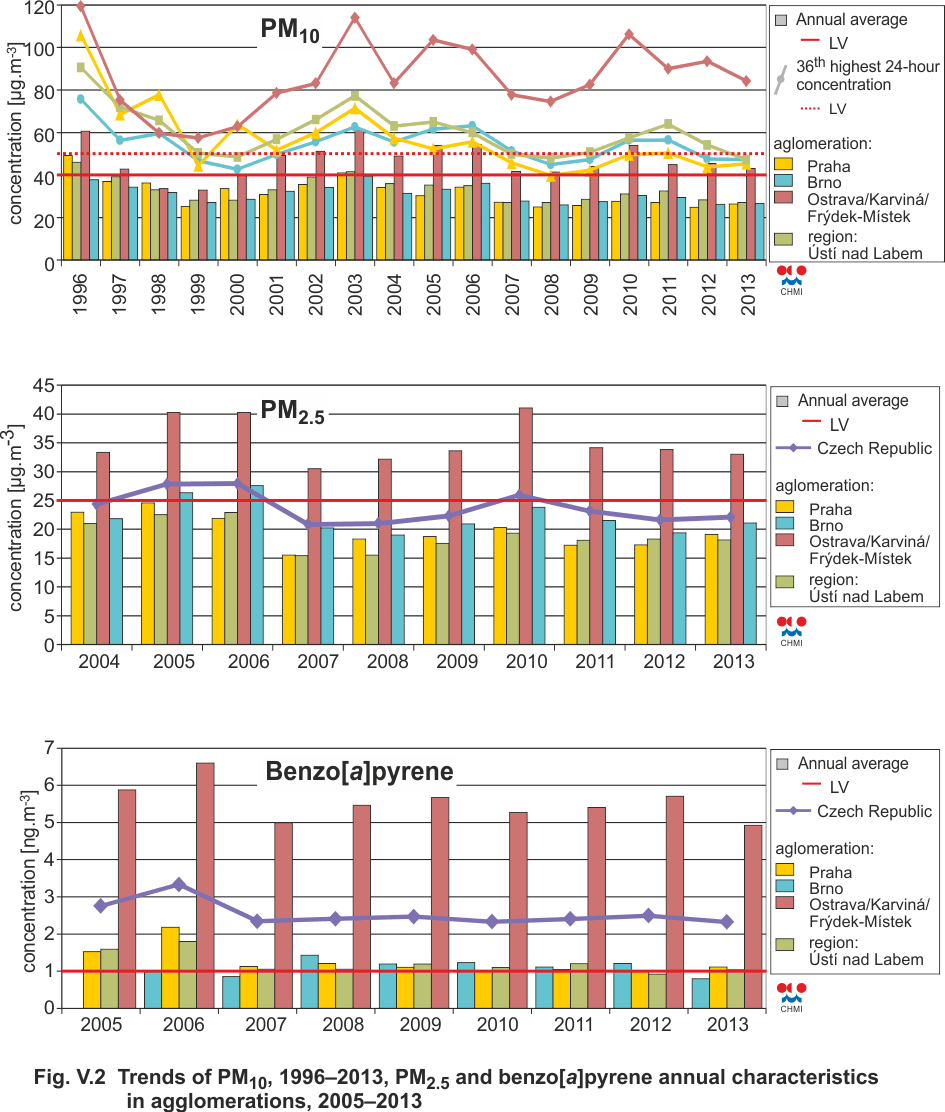
The year-to-year comparison shows the fluctuation character of
the average annual concentrations and there is no evident trend
indicating the improvement of the long lasting unfavourable air
pollution situation. The fluctuation is significantly influenced
by meteorological conditions prevailing in the respective years
(mainly in the cold periods). In the years with the occurrence
of longer episodes with inversions (2005, 2006, 2010) the
average annual values increased (Fig. V.2).
Nitrogen dioxide NO2
Similarly as in the previous years the limit value of the
average annual concentration of NO2 was exceeded at the traffic
hot-spot station OstravaČeskobratrská. It can be expected that
similar concentration levels may occur in other localities with
similar traffic loads in Ostrava.
Concentrations of NO2 in 2013 as compared with the previous year
slightly decreased in all types of localities, nevertheless
there has not been any apparent trend in most localities since
the year 2006. A slight decrease of concentrations was recorded
only in the hot spot locality Ostrava-Českobratrská (Fig.
V.3.5).
Benzo[a]pyrene
The level of air pollution caused by benzo[a]pyrene is a very
serious problem in the whole transboundary area of Silesia and
Moravia. In 2013 the annual average concentrations in the
agglomeration recorded almost threefold to ninefold exceedance
of the limit value. The highest concentration was measured in
the industrial locality Ostrava-Radvanice. With regard to
considerably high concentrations measured in southern Poland it
can be assumed that similarly high levels occur also in the
Czech-Polish boundary area (Fig. V.3.6).
The annual course shows the maximum benzo[a]pyrene levels in the
cold parts of the year, the summer concentrations are lower. In
most localities the concentrations show a slightly decreasing
year-to-year trend, in 2013 all localities measured lower
concentrations than in the previous year.
Further evaluation
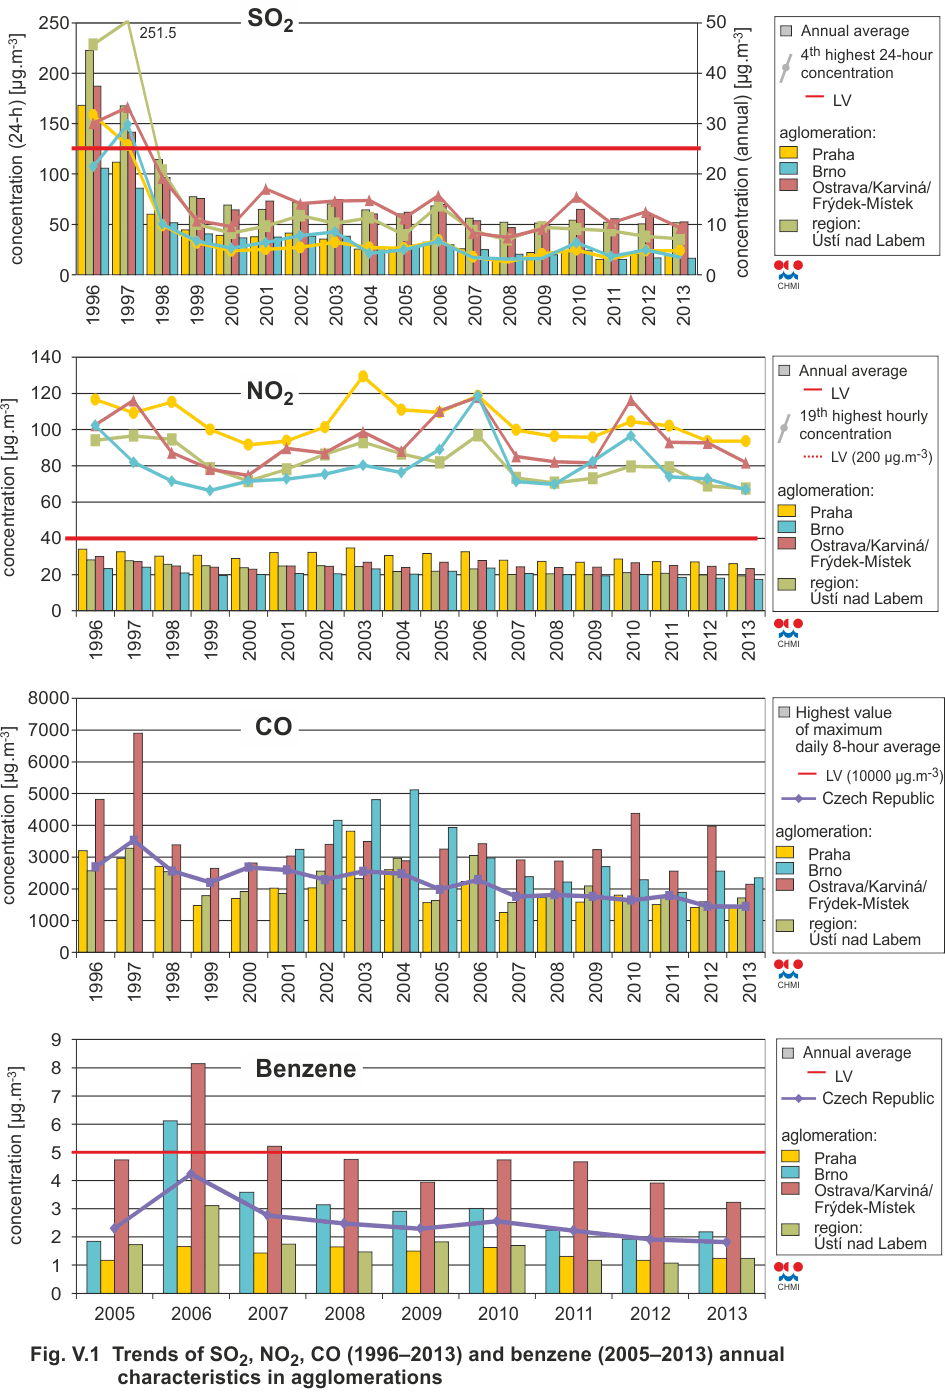
For the first time since the beginning of benzene measurements
in the agglomeration (1999) the annual average concentration of
this pollutant decreased in 2013 in Ostrava-Přívoz below the
limit value. Up to the year 2012 this was the only locality in
the CR with above-the-limit benzene concentrations.
The concentrations of carbon monoxide remain below the limit
value in the long term, in spite of the fact that the values
measured in the agglomeration are higher than in other areas of
the Czech Republic, in connection with higher emissions from
industrial sources (Fig. V.1).
The concentrations of sulphur dioxide in the agglomeration do
not exceed the limit values for the protection of human health.
The average annual concentrations had mostly a decreasing level
also in the year 2013 (Fig. V.1). Higher concentrations are
reached in industrial localities and in the localities near the
state boundary with the Republic of Poland.
Since the year 2006 the concentrations of metals in PM10
suspended particles have been decreasing in the agglomeration.
The positive trend continued in all localities except for the
station Bílý Kříž in the ridges of the Beskydy Mts. also in the
year 2013 in arsenic, cadmium, lead and nickel. The limit values
have not been exceeded in the recent years.
In 2013 the number of exceedances of the limit value for ground-level
ozone in the average for three years exceeded closely the
permissible level of 25 days in the locality Bílý Kříž in the
ridges of the Beskydy Mts. In comparison with the previous years
the number of days with exceedances slightly increased in 2013
in all localities measuring this pollutant in the agglomeration.
However, in total the values of this characteristic have
remained at lower level since the year 2009 (Fig. V.3.7).
V.3.2 Emissions in the agglomeration of
Ostrava/Karviná/Frýdek-Místek
Individual categories of emission sources in the agglomeration
of O/K/F-M have different distribution than in other areas of
the CR. As concerns primary emissions of TSP, the dominant
position is occupied by emissions from large industrial sources
(about 2/3 share), followed by emissions from residential
heating (30 %). The share of traffic in total emissions of TSP
is not very significant3. The total quantity of produced TSP
emissions in the area is an order higher than the emissions
reported in the agglomeration of Prague and the agglomeration of
Brno. In benzo[a]pyrene the share of emissions from residential
heating represents approximately one half of the total annual
emission, there is a significant share of emissions from large
industrial sources again (38 %), not reported at all by the
remaining agglomerations, and traffic has a smaller share (9 %).
Total emissions in the agglomeration of O/K/F-M are approx. five
times as high as in the agglomeration of Prague and eight times
as high as in the agglomeration of Brno. As concerns SO2 and NO2
emissions from stationary sources, absolutely dominant in the
agglomeration (95 %) are emissions from large REZZO 1 sources4 (Fig.
V.3.8).
At present there are more than 900 individually registered
plants – sources of ambient air pollution included in the REZZO
1 and REZZO 2 database. Only several dozens of them have their
significant contribution to total emissions. These include
primarily metallurgy (agglomeration of ores, production of pig
iron, steel and metal casting), coke production, production of
electric energy (e.g. Dalkia Třebovice and power station
Dětmarovice) and thermal energy suppliers. Approximately 15 most
significant plants produce annually 90 % of all emissions from
individually monitored sources, while the considerable share is
contributed also by hardly determinable fugitive emissions of
TSP, produced e.g. in storage areas, handling of loose materials
and in shop floors with dusty operations.
As concerns heating in households and in the communal sector
there prevail central sources of heat energy (about 59 % of
flats) and gas boiler stations and local gas boilers (about 25 %
of flats). There are significant differences in the evaluated
area resulting primarily from the character of the structure of
dwellings in the districts of Ostrava, Karviná and
Frýdek-Místek. In the district of Frýdek-Místek the share of
flats heated locally by solid fuels amounts to 20 %, in the
district of Karviná 8 % and in the district of Ostrava only 4 %.
This fact, stressed moreover by higher average altitude of
settlements in the district of Frýdek-Místek and by larger
average flat area, is apparent primarily in emissions with more
significant share of REZZO 3 category, i.e. in TSP and particles,
VOC, benzene and mainly in benzo[a]pyrene emissions.
In the period 2002–2012 the above mentioned significant sources
recorded the decrease of all monitored emissions (e.g. in TSP by
about 50 %, in SO2 and NOx by about 25 %). The decrease of
emissions is partly the result of the decline in production of
pig iron and the connected production of metallurgical coke and
steel related e.g. to the shutdown of the coking plant Jan
Šverma and some of the production technologies of EVRAZ
Vítkovice Steel in Ostrava. Simultaneously, a number of
important measures have been implemented in the recent period
aimed at emission reduction, mainly of TSP and toxic emissions
of heavy metals and POP bound to them. In spite of these
positive trends, the production of emissions of the mentioned
pollutants but also of other pollutants, such as CO and VOC, is
still high and contributes to deteriorated ambient air quality
not only in the territory of the agglomeration, but also in the
neighbouring districts and regions including the Republic of
Poland.
The share of emissions from household heating in the air
pollution load of the whole agglomeration is questionable. An
important factor manifested primarily in the local ambient air
quality, is the higher probability of operating dual-fuel
domestic household heating systems (e.g. combination natural gas
and boiler or fireplace using wood), which cannot be rightly
evaluated from the Census data. Similarly, the structure of the
used solid fuel boilers, as concerns their types, age and
emission class, is in terms of ambient air quality evaluation
rather unfavourable. If there occur any year-to year changes in
the production of emissions from household heating, they are
connected mainly with meteorological situation. The previous or
current programmes for the improvement of ambient air quality, e.g.
supporting environmentally sound methods for producing heat and
hot water through the Green Savings Programme or the Boiler
Subsidy Programme, have not yet produced such changes in the
overall structure of household heating sources which would
significantly reduce the number of outdated combustion devices
and replace them by the environmentally friendly ones.
V.3.3 Conclusion
In the year 2013 the concentrations of suspended particles
remained at similar levels as in the previous year. The
concentrations of PM10 and PM2.5 particles and benzo[a]pyrene
exceed the limit values in the long term in most localities. The
above-the-limit concentration of NO2 was measured in the traffic
hot spot locality in Ostrava.
The decrease was recorded in the annual average concentrations
of benzene which in 2013, for the first time since the beginning
of benzene measurements, remained below the annual limit value
even as concerns the industrial locality Ostrava-Přívoz, and
also in benzo[a]pyrene and metals contained in PM10 particles.
There is a specific representation of shares from individual
categories of emission sources in the agglomeration. In all
registered pollutants with the exception of benzo[a]pyrene the
emissions from REZZO 1 sources prevail. Nevertheless, these
emissions represent a significant share also in benzo[a]pyrene
(38 %).
The decrease of average annual concentrations of the above
listed pollutants in the recent years is probably the result of
the reduction of emissions from industrial sources after
implementing the measures aimed at emission reduction, mainly
emissions of TSP and heavy metals and further pollutants bound
to them.
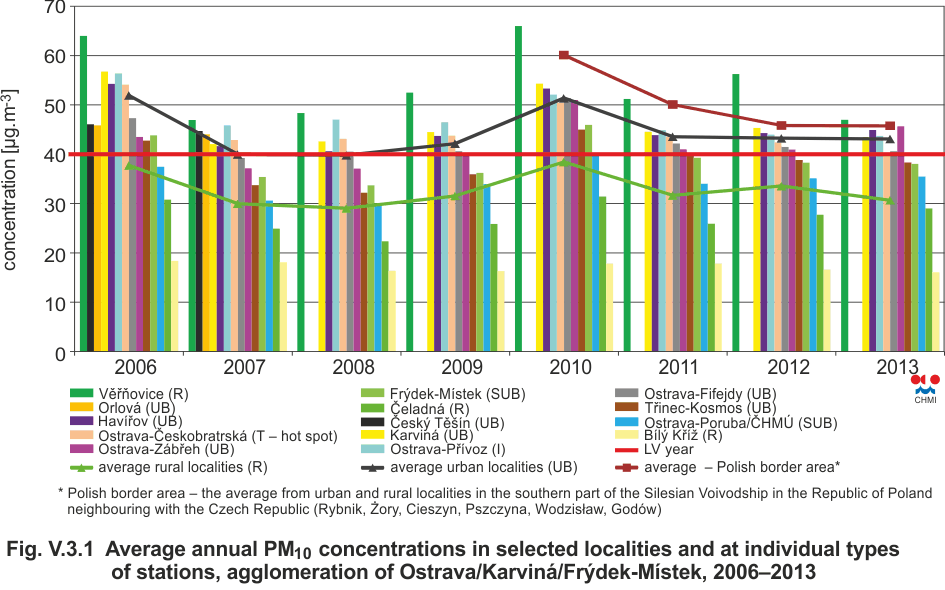
Fig. V.3.1 Average annual PM10 concentrations in selected
localities and at individual types of stations, agglomeration of
Ostrava/Karviná/Frýdek-Místek, 2006–2013
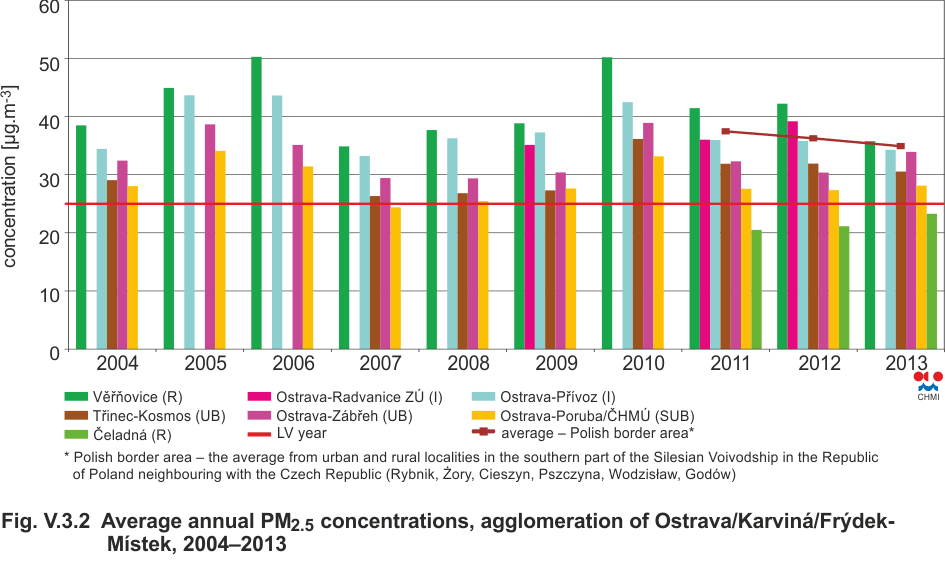
Fig. V.3.2 Average annual PM2.5 concentrations, agglomeration of
Ostrava/Karviná/Frýdek-Místek, 2004–2013
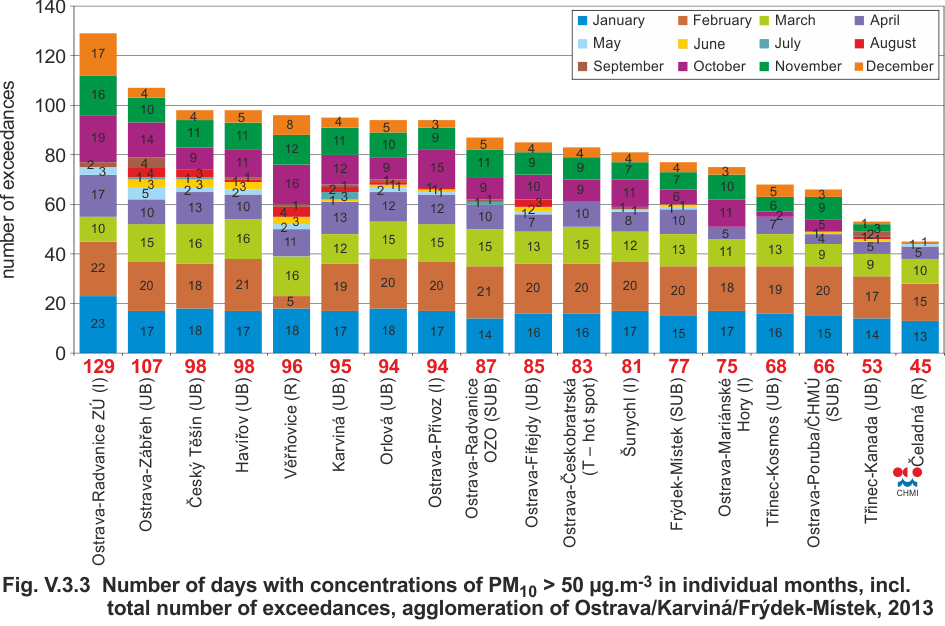
Fig. V.3.3 Number of days with concentrations of PM10 > 50 µg.m-3, agglomeration of Ostrava/Karviná/Frýdek-Místek, 2013

Fig. V.3.4 Number of exceedances of 24-hour limit value for PM10
in selected localities and the 36th highest 24-hour
concentrations of PM10 at individual types of stations,
agglomeration of Ostrava/Karviná/Frýdek-Místek, 2006–2013
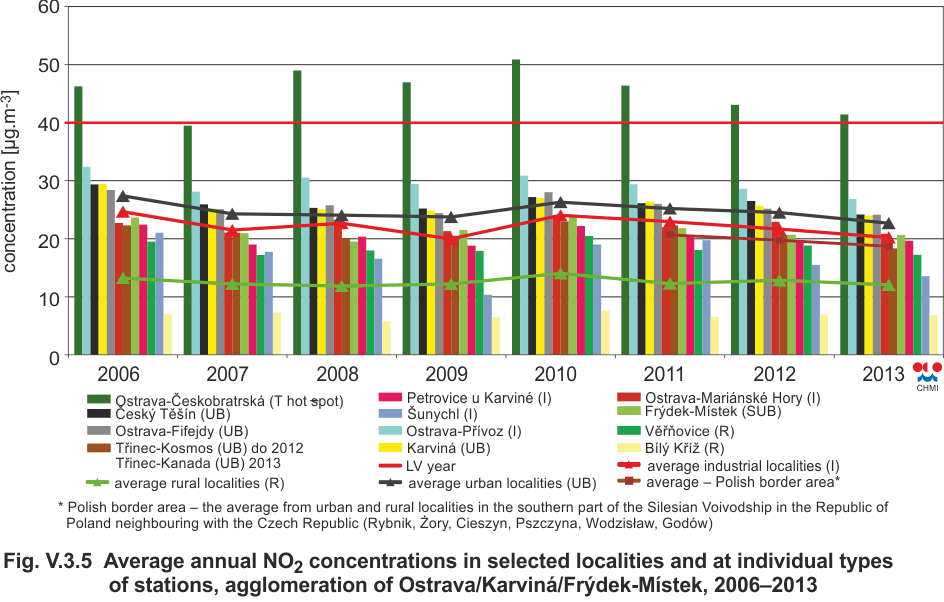
Fig. V.3.5 Average annual NO2 concentrations in selected localities and at individual types of stations, agglomeration of Ostrava/Karviná/Frýdek-Místek, 2006–2013
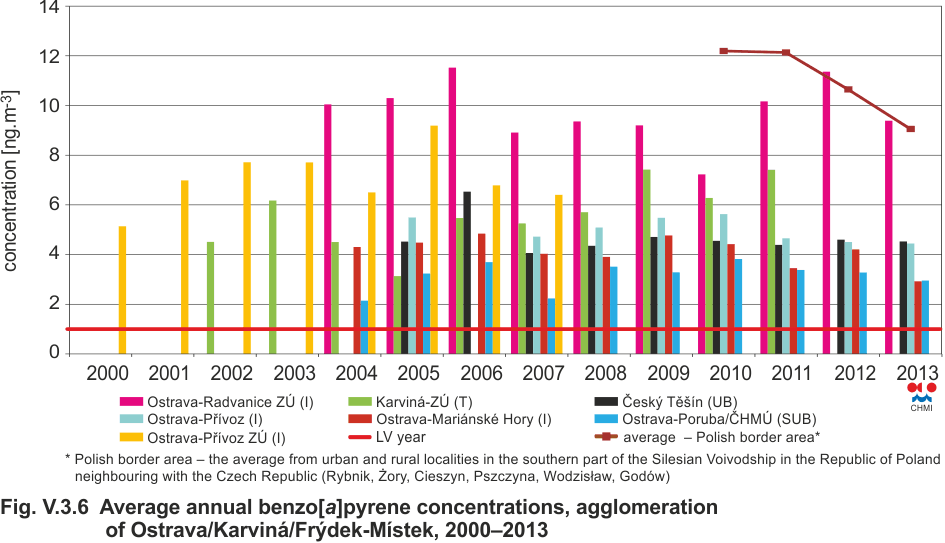
Fig. V.3.6 Average annual benzo[a]pyrene concentrations,
agglomeration of Ostrava/Karviná/Frýdek-Místek, 2000–2013

Fig. V.3.7 Number of exceedances of the target value of O3 in
the average for three years, agglomeration of
Ostrava/Karviná/Frýdek-Místek, 2006–2013

Fig. V.3.8 Most significant stationary sources of TSP, NOx and
SO2 emissions, agglomeration of Ostrava/Karviná/Frýdek-Místek,
2012
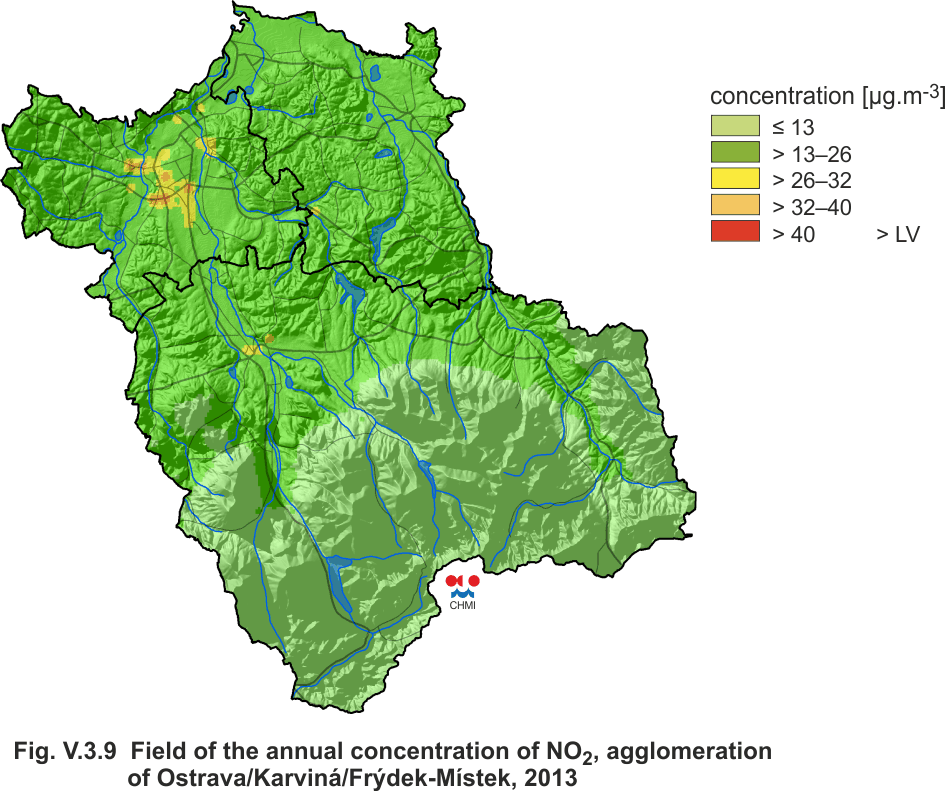
Fig. V.3.9 Field of the annual concentration of NO2,
agglomeration of Ostrava/Karviná/Frýdek-Místek, 2013
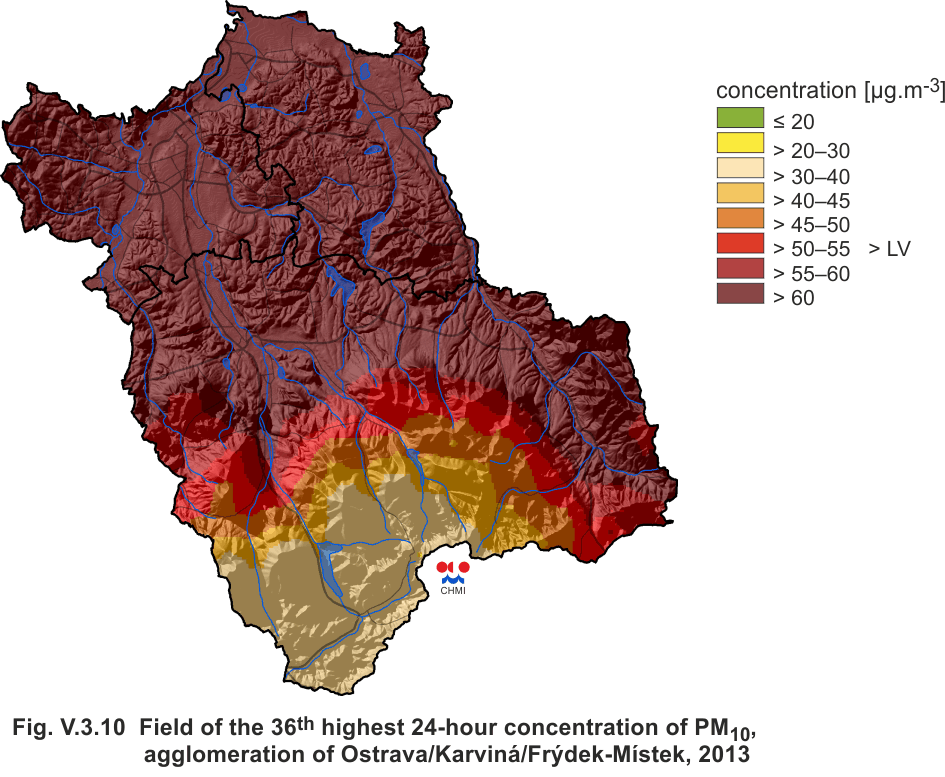
Fig. V.3.10 Field of the 36th highest 24-hour concentration of
PM10, agglomeration of Ostrava/Karviná/Frýdek-Místek, 2013
1The project Ambient air quality improvement in the border
area of the Czech Republic and Poland (www.cleanborder.eu) and
the project Air quality information system in the Polish-Czech
border area in the Silesian region and the Moravia-Silesia
region (www.air-silesia.eu) within the Operation programme of
transborder cooperation Czech Republic–Republic of Poland
2007–2013.
2The evaluation presented below shows the concentrations from
the measurements at the stations of air pollution monitoring in
the southern part of the Silesian Voivodship in the Republic of
Poland, see
http://stacje.katowice.pios.gov.pl/monitoring). Data of comparable quality are available only since the year 2010.
3The estimate of traffic share in total air pollution in the
district
Ostrava-město in the winter period without resuspension is
about 12 % for TSP and 16 % for NOx (Jedlička et al. 2013)
4Evaluated on the basis of data for the year 2012. The final
data for the year 2013 are not available by the deadline of the
yearbook.