EXECUTIVE SUMMARY
Ambient air pollution caused by suspended particles of PM10
and PM2.5 fractions, benzo[a]pyrene and ground-level ozone is a
major problem in the field of air quality in the Czech Republic
(Fig. 1). The level of air pollution in the given year depends
on the amount of emissions and the prevailing meteorological and
dispersion conditions. Most air pollutants characteristics have
had a decreasing trend since the year 2000; this trend, however,
is not as marked as that in the 90s of the last century.
Nevertheless, the concentrations of the above mentioned
pollutants with serious impacts on human health exceed every
year their respective limit values in a number of localities.
From the local and regional perspective the most serious
situation remains in the agglomeration of
Ostrava/Karviná/Frýdek-Místek, nevertheless the limit values are
exceeded in all zones and agglomerations. In the agglomeration
of Ostrava/ Karviná/Frýdek-Místek high concentrations of
pollutants are caused not only by the sources from the Czech
Republic, but also by the transfer of emissions from Poland. On
both sides of the border there is a high concentration of
industrial production, high density of built-up areas with local
household heating using solid fuels and developed transport
infrastructure (Chapter V.3). In Prague and in Brno there remain
to be solved the above-the-limit concentrations of air
pollutants produced mainly by traffic, to which considerable
part of population are exposed (Chapters
V.1,
V.2).
The deteriorated ambient air quality is not a problem only in
the agglomerations and larger cities but also in small
settlements, where air pollution caused by suspended particles
and benzo[a]pyrene comes from the sources of local heating. It
can be expected that the increased and the above-the-limit
concentrations of these pollutants can occur also in the places
where they are not measured.
Considerable part of the territory of the Czech Republic is also
exposed every year to the abovethe-limit concentrations of
ground-level ozone.
However, with regard to the chemism of ozone these are not so
densely populated areas as in the case of PM10 and PM2.5
suspended particles and benzo[a]pyrene. Consequently, the result
share of inhabitants affected by the above-the-limit
concentrations of ozone is lower in comparison with the share of
inhabitants affected by the above-the-limit concentrations of
PM10 and PM2.5 and benzo[a]pyrene.
AIR QUALITY IN THE CZECH REPUBLIC IN THE YEAR 2013 WITH REGARD TO THE LIMIT VALUES FOR THE PROTECTION OF HUMAN HEALTH
The areas with deteriorated air quality (ozone excluded) covered
in 2013 approx. 17.5 % of the CR territory with approx. 54.6 %
of inhabitants. The absolute majority of these areas were
defined due to the exceedance of the limit values of PM10 and
PM2.5 suspended particles and benzo[a]pyrene. Some areas were
included also due to the exceedance of the limit value for
sulphur dioxide, cadmium and arsenic, although to a lesser
extent. The areas with deteriorated air quality (ozone included)
covered approx. 37 % of the CR territory with approx. 60 % of
inhabitants (Chapter VII.).
The daily limit value for PM10 suspended particles was exceeded
in 5.7 % of the CR territory with approx. 15.9 % of inhabitants
and the average annual concentration in 0.7 % of the territory
with approx. 4.8 % of inhabitants. The year 2013 as against the
year 2012 recorded the decrease of the 36th highest PM10
concentration at more than a half of stations and the reduction
of the areas with the exceedances of the daily limit value for
PM10 (Chapter IV.1).
The annual limit value for PM2.5 suspended particles was
exceeded in 2.4 % of the CR territory with approx. 9.6 % of
inhabitants. The situation concerning the annual average
concentration of PM2.5 and PM10 improved only slightly as
compared with the year 2012 (Chapter IV.1).
The limit value for benzo[a]pyrene was exceeded, similarly as in
the previous years, in a number of towns and small settlements
(17.4 % of the CR territory with approx. 54.5 % of inhabitants).
The estimate of the fields of annual average concentrations of
benzo[a]pyrene is burdened by the greatest uncertainties ensuing
from insufficient density of measurements, mainly at rural
regional stations and in small settlements in the CR. As regards
air pollution caused by benzo[a]pyrene, small settlements
represent the substantial influence on ambient air quality due
to local household heating (Chapter IV.2).
The limit value for nitrogen dioxide was exceeded only in 0.01 %
of the CR territory with 0.2 % of inhabitants, and namely in the
localities with high intensity of traffic in Prague, Brno and
Ostrava. However, the exceedance of the limit value can be
assumed also in other places exposed to similar traffic loads,
where there are no measurements. The 1-hour limit value for NO2 was not exceeded, similarly as in the previous years (Chapter
IV.3).
The limit value for ground-level ozone was exceeded
in 25.6 % of the CR territory with approx. 8.2 % of inhabitants
(the average for the period 2011–2013;
Chapter IV.4). In comparison with the previous year (the average for the period
2010–2012) the area with the exceeded concentrations increased (Chapter
IV.4).
The limit value for benzene was not exceeded in any locality.
The highest concentrations were reached at the stations in the
agglomeration of Ostrava/Karviná/Frýdek-Místek. In 2013, for the
first time from the beginning of the measurements in 1999, the
average annual benzene concentration in the locality
Ostrava-Přívoz did not reach the limit value (Chapter IV.5).
The limit value for arsenic was exceeded only in the locality
Kladno-Švermov. The limit value for cadmium was exceeded only in
one locality Tanvald-školka (Chapter IV.6).
The limit values for lead, nickel, sulphur dioxide and carbon
monoxide were not exceeded, similarly as in the previous years (Chapters
IV.6,
IV.7,
IV.8).
AIR QUALITY IN THE CZECH REPUBLIC IN THE YEAR 2013 WITH REGARD TO THE LIMIT VALUES FOR THE PROTECTION OF ECOSYSTEMS AND VEGETATION
The limit value for ground-level ozone expressed as the AOT40
exposure index was exceeded only in a small area of the CR in
the CHKO Bílé Karpaty. In 2013, in comparison with the previous
year, the AOT40 values decreased in 91 % of localities (Chapters
IV.4,
VII.2).
The limit values for sulphur dioxide and nitrogen oxides for the
protection of ecosystems and vegetation were not exceeded in any
rural locality with their measurements.
According to the results of modelling the limit values for SO2 were exceeded only in the North-western zone in a small area of
the Ústí nad Labem region (Chapter IV.7). The above-the-limit
concentrations of NOx occur mainly along transport
communications; the results of modelling in the most valuable
natural areas of the CR show the exceedance of the limit value
for NOx in a very small part of several protected landscape
areas of the CR (Chapter IV.3 and
VII.2).
SMOG WARNING AND REGULATORY SYSTEM
In 2013 there were announced 20 smog situations and one
regulation due to the increased PM10 concentration. At least one
smog situation was announced in 10 of the total 15 SVRS areas
for PM10. Both the greatest number of smog situations and the
only one regulation were announced in the territory of the
agglomeration of Ostrava/Karviná/ Frýdek-Místek. In comparison
with the year 2012 the number of smog situations increased by 20
% and the number of regulations decreased by 80 %. However, the
number of the announced smog situations and regulations was
substantially influenced by the change of the rules for their
announcement.
Unlike the year 2012, when there was not announced any smog
situation, in 2013, due to high concentrations of ground-level
ozone (Chapters III. and
IV.4) 16 smog situations in 9 of the
total number of 16 SVRS areas were announced (even with regard
to the fact that starting from September 2012 only one
exceedance instead of three subsequent exceedances of the
information threshold value is sufficient for the announcement
of a smog situation;
Chapter VII.). The greatest number of smog
situations was announced in the territory of the Ústí nad Labem
region.
EMISSIONS OF AIR POLLUTANTS
Total emissions of main pollutants decreased in 2013 in
comparison with the year 2012 with the exception of CO emission,
where a slight increase was recorded caused mainly by the growth
of emissions in the sector of iron and steel production.
The year-to-year decreasing trend of emissions of nitrogen
oxides and volatile organic compounds is caused mainly by the
natural renewal of the car fleet, in emissions of TSP and
sulphur dioxide also by meeting the stricter emission limit
values, resulting in some cases from the updated integrated
permits, or from the voluntary commitments fulfilled by major
operators of stationary sources. This trend was affected by the
increase of emissions in the sector of public electricity and
heat production, caused by the longer heating season, and,
consequently, by higher demands for heat than in the previous
year. The almost 12% decline of sulphur dioxide emissions was
caused mainly by the reduction of emissions from waste gases
processing in refineries by approx. 3.7 kt. A slight increase of
some emissions of the REZZO 3 category is also connected with
the longer heating season in 2013 as against the year 2012 (Chapter
III.).
The sector of local household heating contributed significantly
to ambient air pollution, and namely in emissions of PM10 40.8
%, PM2.5 59.2 %, carbon monoxide 52.8 % and benzo[a]pyrene 89.6
%. The share of the sector of public electricity and heat
production prevailed in emissions of sulphur
dioxide 62.2 %, arsenic 65.8 % and nickel 58.8 %, the share of
the sector of iron and steel production in emissions of cadmium
37.7 % and lead 38.7 %. The sector of road freight transport
over 3.5 t, passenger car transport and off-road vehicles and
other machines used in agriculture and forestry contributed with
37.1 % of nitrogen oxides emissions. The most significant
sources of emissions of volatile organic compounds are found in
the sector of organic solvent use and application, contributing
to ambient air pollution caused by these pollutants with 52.6 %. The share of the main source of
ammonia emissions – breeding of
farm animals in total emissions amounted to 69.6 % (data for the
year 2012).
The absolutely greatest amount of emissions of main pollutants
(Table II.2) comes from the production of pig iron.
Agglomeration plants and blast furnaces – TŘINECKÉ ŽELEZÁRNY, a.
s. and ArcelorMittal Ostrava, a. s. reported, among others,
approx. 800 t of total suspended particles and more than 90,000
t of carbon monoxide in 2013. The greatest amount of emissions
of sulphur dioxide and nitrogen oxides
are emitted in the air by the sources within the sector of
public electricity and heat production (the power plants:
Elektrárna Počerady, a. s., elektrárny ČEZ, a. s., Elektrárna
Opatovice and others) and energy industries (Sokolovská uhelná,
a. s., UNIPETROLRPA, s. r. o., ArcelorMittal Energy Ostrava, s.
r. o. and others).
With regard to the fact that the newly presented emission data
are in many cases based on the significantly innovated methods (e.g.
structure of fuels and devices used in household heating, fleet
of lorries, completion of specific groups of sources in the
whole time series), the comparison of emissions cannot be
related to the data presented in the previous yearbooks. There
is one key information, and namely that the emission inventory
data for the years 2000–2013 are for the first time processed by
consistent methods. In spite of the fact that in the future
period minor changes and details will be specified, the data
presented since 2000 show the ongoing decreasing trend of air
pollution levels in almost all sectors monitored pursuant to the
international classification of sources (Chapter II.).
ATMOSPHERIC DEPOSITION
As concerns precipitation, the year 2013 was slightly above the
long-term normal. The average precipitation in the territory of
the CR amounted to 727 mm, which is 108 % of the long-term
normal of the period 1961–1990. In comparison with the year 2012
(689 mm) the total precipitation was higher.
Wet sulphur deposition was lower as against the year 2012. It
was the third lowest value since the year 1995 (after the years
2003 and 2011). The highest values of wet sulphur deposition were reached in the
mountainous areas (the Krušné hory Mts., the Moravskoslezské
Beskydy Mts., the Jeseníky Mts., the Krkonoše Mts.).
Dry sulphur depositions increased in comparison with the year
2012. The downward trend from the period 2010–2012 was thus
interrupted.
Total sulphur deposition amounted to 49,314 t of sulphur on the
area of the CR; since the year 2007 its value ranges around
50,000 t. The highest values are reached in the Krušné hory Mts.
Wet deposition of reduced (N/NH4+) and oxidized (N/NO3-) forms
of nitrogen in the year 2013 decreased. The total wet deposition
of nitrogen on the area of the CR amounted to 48,457 t.year-1.
Dry deposition of oxidized forms of nitrogen slightly increased.
Total nitrogen deposition amounted to 69,693 t of nitrogen on
the area of the CR.
Wet deposition of hydrogen ions slightly increased, and thus the
growth of hydrogen ions deposition has continued since 2011,
probably due to the increasing total precipitation.
Wet deposition of lead slightly increased. The highest values
were reached in the Moravskoslezské Beskydy Mts., the Orlické
hory Mts. and the Hrubý Jeseník Mts. Dry depositon of lead
reached the similar level as in 2012.
Wet deposition of cadmium in 2013 increased. The highest values
were reached in the locality U dvou louček in the Orlické hory
Mts. The reason of this increase is not entirely clear.
Wet deposition of nickel ions in 2013 recorded the highest
values in the locality Pluhův bor. This was probably caused by
the specific undersoil (serpentine) with high content of Ni and
Mg.
Wet deposition of chloride ions decreased. This decrease might
have been influenced by the end of the measurements in the
locality Podbaba, where the highest levels of wet deposition of
Cl- were recorded in the previous years (Chapter IX.).
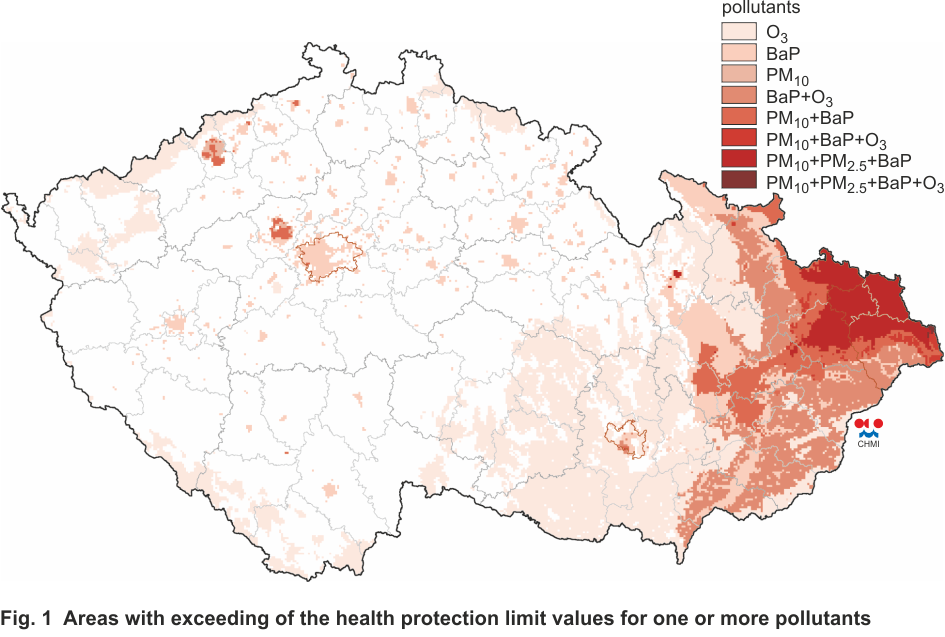
Fig. 1 Areas with exceeding of the health protection limit
values for one or more pollutants