IV.7 SULPHUR DIOXIDE (SO2)
IV.7.1 Air pollution caused by SO2 in the year 2013
Air pollution caused by SO2 in the year 2013 with regard to the limit values for the protection of human health
In 2013 neither the limit value for the hourly SO2 concentration
nor for the 24-hour SO2 concentration were exceeded in the CR at
any measuring station (Tables XIII.1 and
XIII.2). There were
only two localities in the Ústí nad Labem region where there was
measured 1-hour concentration of SO2 exceeding the limit value
350 µg.m-3 (Výsluní 513 µg.m-3 and Krupka 390 µg.m-3), however,
the tolerated number of the limit value exceedances (24x) was
not exceeded. The station Výsluní (ČEZ) is classified as
industrial rural, and thus it can be assumed that it is affected
by the sources from the Podkrušnohorská basin in the foothills
of the Krušné hory Mts. The background station Krupka is
probably influenced by the local source (details in Annex II).
The 25th highest SO2 concentration reached the maximum values at
the stations: Ostrava-Radvanice 129 µg.m-3, Lom 124 µg.m-3 and
Teplice 105 µg.m-3 . The maximum 24-hour concentrations of SO2
did not exceed the limit value 125 µg.m-3 (Ostrava-Radvanice 97
µg.m-3, Lom 94 µg.m-3 and Teplice 84 µg.m-3). The 4th highest
24-hour SO2 concentration reached the maximum values at the
stations Ostrava-Radvanice 79 µg.m-3, Lom 60 µg.m-3 and
Věřňovice 57 µg.m-3.
The map of the field of the 4th 24-hour SO2 concentration in
2013 (Fig. IV.7.1) shows that in 99.7 % of the CR territory the
concentration of this pollutant did not reach 50 µg.m-3, and
thus only in approx. 0.3 % of the territory of the CR SO2
concentrations exceeded the lower assessment threshold. This
small area, with SO2 concentrations exceeding 50 µg.m-3,
occurred mainly in the Ústí nad Labem region, in the part of the
Podkrušnohorská basin, in the districts Most and Teplice.
Figs. IV.7.2 and
IV.7.3
depict the courses of 1-hour and 24-hour
SO2 concentrations at selected stations in 2013.
Air pollution caused by SO2 with regard to the limit values for
the protection of ecosystems and vegetation
In 2013 neither the limit value for the annual average
concentration nor the limit value for the winter average
concentration were not exceeded in rural localities (Tables
XIII.17 and
XIII.18). The highest winter average concentration
in 2013 was recorded in the localities Krupka (14.9 µg.m-3) and
Lom (14.8 µg.m-3), the annual average concentration reached its
maximum in the locality Věřnovice (10.1 µg.m-3). The maps of the
field of annual average concentration 2013 and of the average
concentration for the winter period 2013/2014 (Figs. IV.7.4 and
IV.7.5) show the exceedance of the limit value in a small part
of the Ústí nad Labem region, in the area between the cities
Most and Litvínov. This exceedance is apparent in the map
constructed by model calculation based on the emission from the
year 2012. This fact can influence to a certain extent the shape
of the field of SO2 concentrations. The decrease of the annual
average concentration of SO2 at the station Lom in 2013
corresponds with the decrease of SO2 emissions in the district
Most based on the preliminary results of emission records for
the year 2013.
The map was constructed from the data of all background stations
measuring SO2 with regard to their classification; only rural
stations are marked with spot symbols.
This chapter is closed by the graphs of the courses of 24-hour
SO2 concentrations at selected stations, related to the limit
value for the winter and annual averages (Figs. IV.7.6 and
IV.7.7).
IV.7.2 The development of SO2 concentrations
After the year 1998 there was recorded, in connection with
coming into force of the Act No. 309/1991 Coll., and meeting the
required emission limit values, a marked decrease of SO2
concentrations. Since then the annual average concentrations of
this pollutant have not exceeded the set limit value 20 µg.m-3
at rural stations (Fig. IV.7.9). In 2008 there was further
decrease of air pollution caused by SO2 in the whole territory
of the CR. In 2009 and 2010, on the contrary, the slight
increase of air pollution caused by SO2 was recorded. From 2011
to 2013 there is another further apparent decreasing trend in
air pollution caused by this pollutant.
In 1996–2000 there occurred a marked decrease of SO2
concentrations (by approx. 70–80 % depending on the respective
air pollution characteristic) –
Fig. IV.7.10. The development of
the trends of SO2 concentrations is influenced by the decrease
of emissions, desulphurisation and the change of the used fuels.
To a certain extent there is also the influence of
meteorological and dispersion conditions.
The development of SO2 concentrations with regard to the limit
values for the protection of human health
Fig. IV.7.8 shows the apparent decreasing trend in the
development of the 4th highest 24-hour and 25th highest 1-hour
concentrations of SO2 in selected localities, which started in
the year 2003.
In 2013, in comparison with the year 2012, the 4th highest 24-hour
concentration and the 25th highest 1-hour concentration of SO2
decreased in almost all localities. This decrease of SO2
concentrations is apparent at all CHMI stations in the Moravia-Silesia
region and the Ústí nad Labem region, where the measurements of
SO2 are carried out in the highest number of localities. The
greatest decrease of SO2 concentrations in comparison with the
previous year was recorded at the station Pardubice-Dukla. This
locality was influenced by the episode of high 1-hour SO2
concentrations in March 2012.
The development of SO2 concentrations with regard to the limit
values for the protection of ecosystems and vegetation
The development of the annual and winter average concentrations
of SO2 in selected rural localities is presented in
Figs.
IV.7.11 and
IV.7.12. The annual average of SO2 concentrations
shows an apparent downward trend, the winter average has a
slowly decreasing trend as well.
In 2013, as against the previous year, SO2 annual concentrations
decreased in most rural localities. Particularly apparent
decrease was recorded at the stations Lom and Věřňovice. As
concerns the winter average concentrations of SO2, the numbers
of selected localities with the decrease and the increase of SO2
concentrations were almost equal. A slight decrease was recorded
in the localities in the Moravia-Silesia region and a slight
increase was recorded at most stations in the Ústí nad Labem
region.
IV.7.3 Emissions of SO2
Emissions of SO2 are created mainly during the combustion of sulphur-containing solid fossil fuels. In 2012 the sector of public electricity and heat production contributed by 62.2 % of SO2 emissions, and the sector of local household heating contributed by 11.7 % (Fig. IV.7.13). The decrease of SO2 emissions between the years 2007 and 2008 in the sector of public electricity and heat production resulted from the implementation of the obligation to comply with emission ceilings for LCP sources (Fig. IV.7.14). Since 2008 the emissions of SO2 have remained approximately at the same level. Due to the prevailing influence of the sector of public electricity and heat production SO2 emissions are concentrated in the Ústí nad Labem region, Moravia-Silesia region and Central Bohemia region, where the largest producers of energy are found (Fig. IV.7.15).
Tab. XIII.1 Stations with the highest values of the 25th and maximum hourly concentrations of SO2
Tab. XIII.2 Stations with the highest numbers of exceedances of the 24-hour limit value of SO2
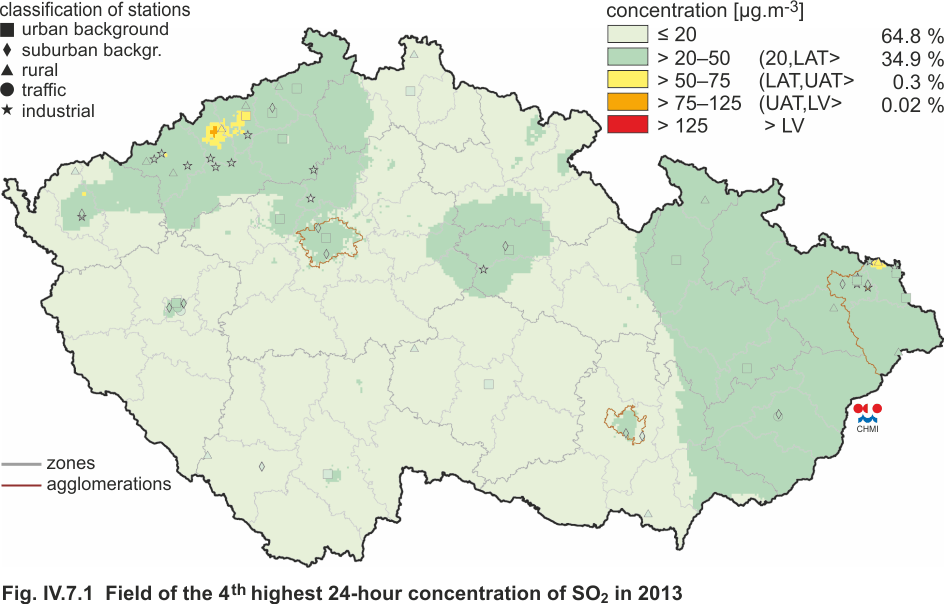
Fig. IV.7.1 Field of the 4th highest 24-hour
concentration of SO2 in 2013
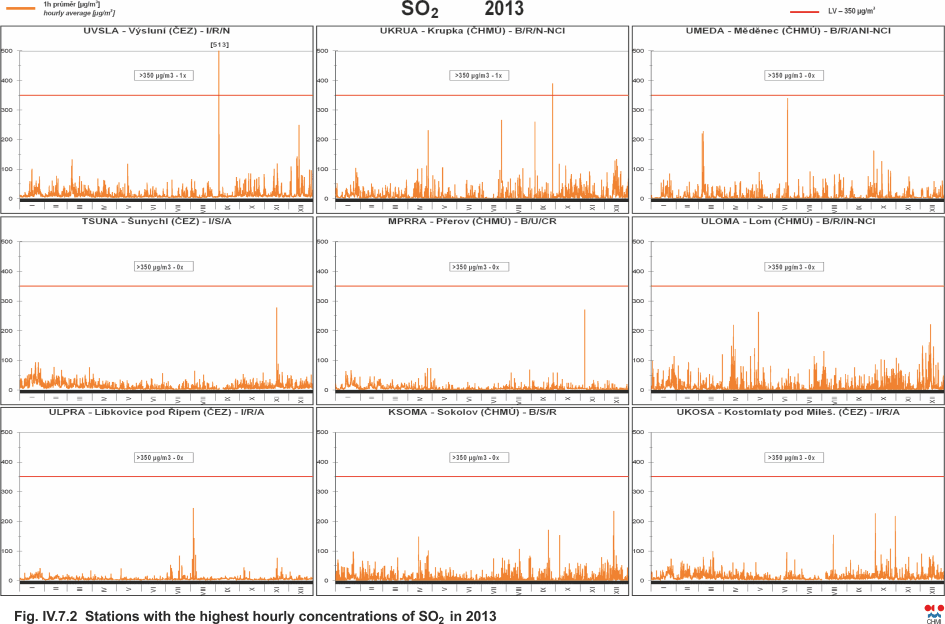
Fig. IV.7.2 Stations with the highest hourly concentrations
of SO2 in 2013
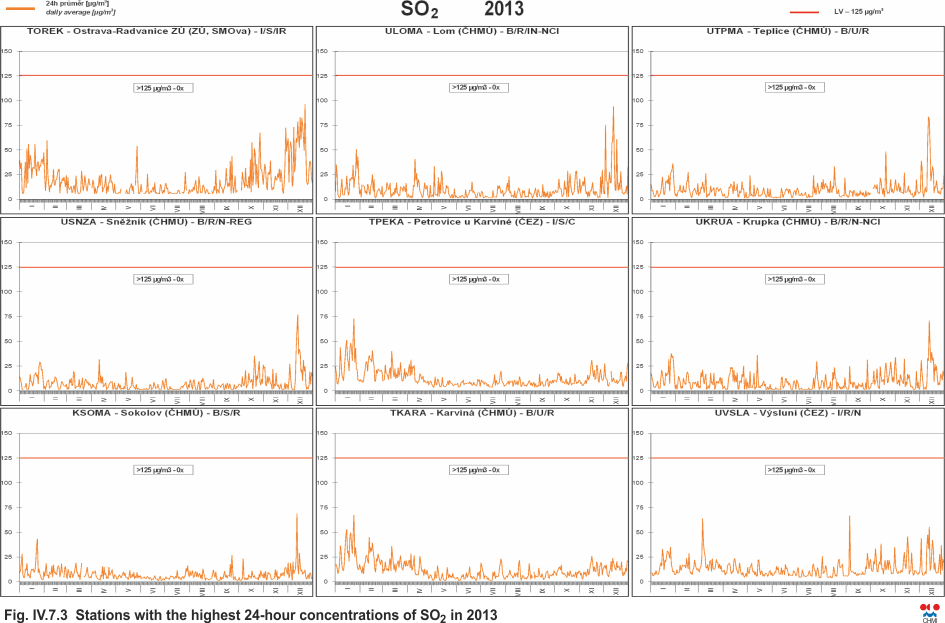
Fig. IV.7.3 Stations with the highest 24-hour concentrations
of SO2 in 2013
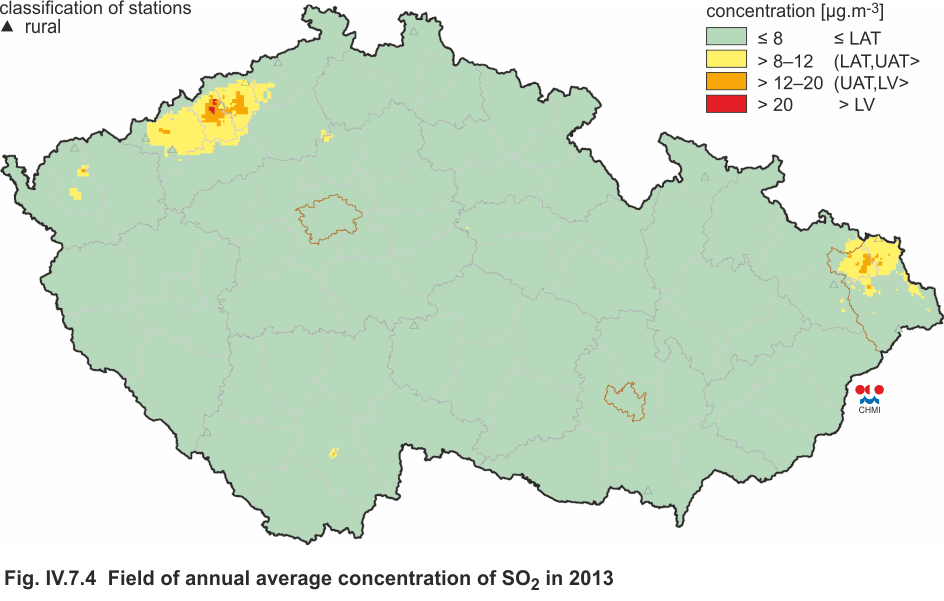
Fig. IV.7.4 Field of annual average concentration of SO2
in 2013
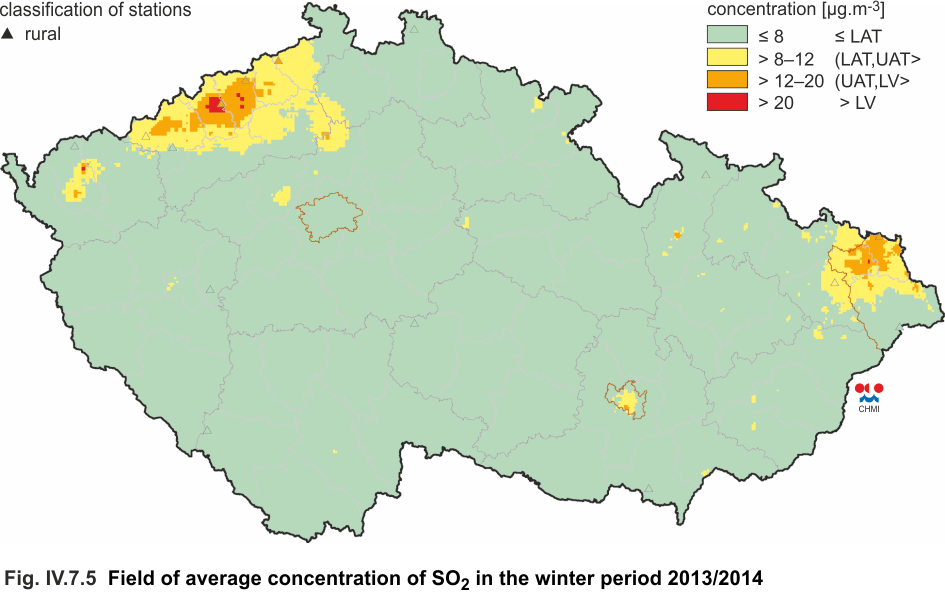
Fig. IV.7.5 Field of average concentration of SO2
in the winter period 2013/2014
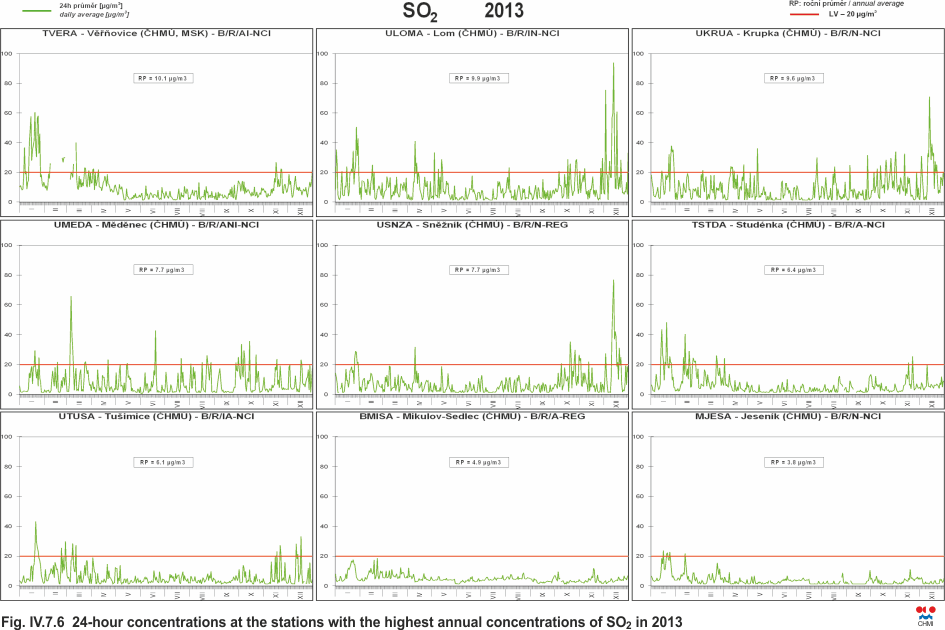
Fig. IV.7.6 24-hour concentrations at the stations with the
highest annual concentrations of SO2 in 2013
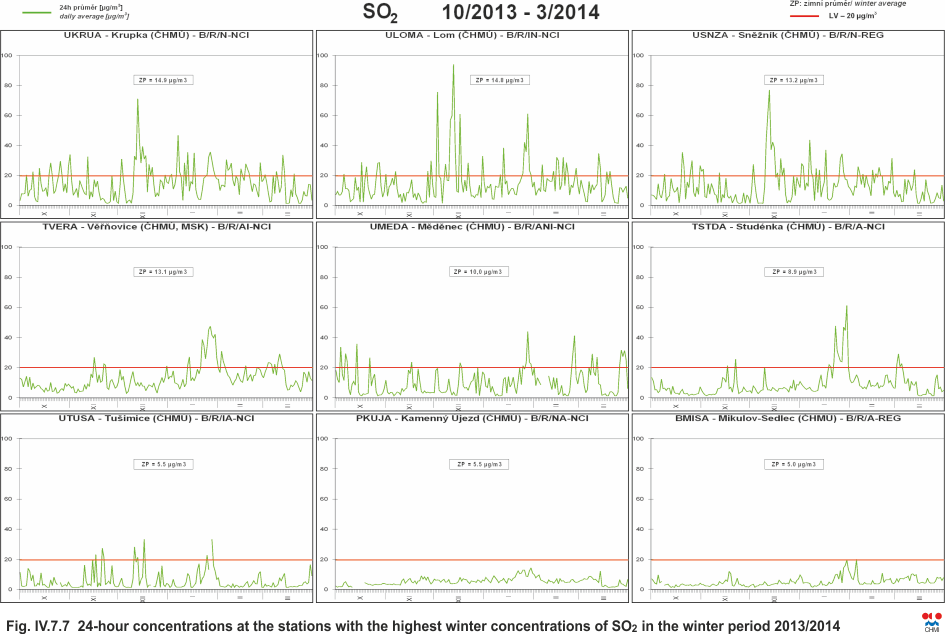
Fig. IV.7.7 24-hour concentrations at the stations with the
highest winter concentrations of SO2 in the winter
period 2013/2014
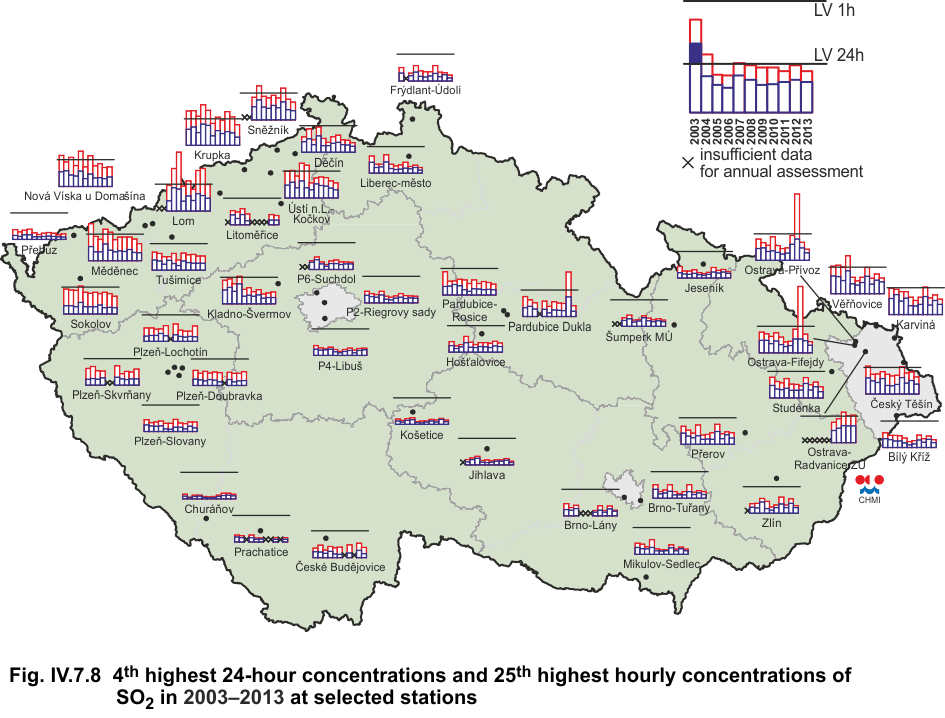
Fig. IV.7.8 4th highest 24-hour concentrations
and 25th highest hourly concentrations of SO2 in
2003–2013 at selected stations
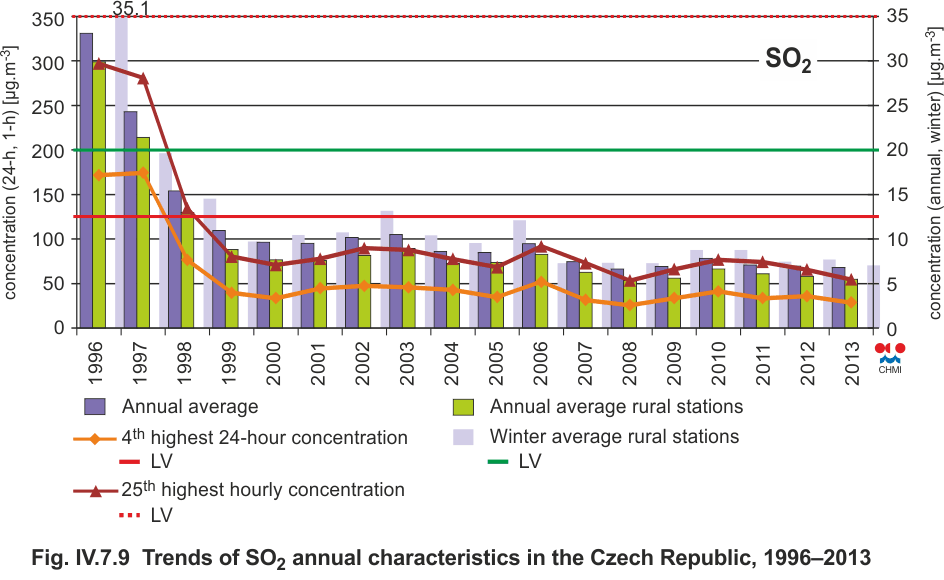
Fig. IV.7.9 Trends of SO2 annual characteristics in the
Czech Republic, 1996–2013
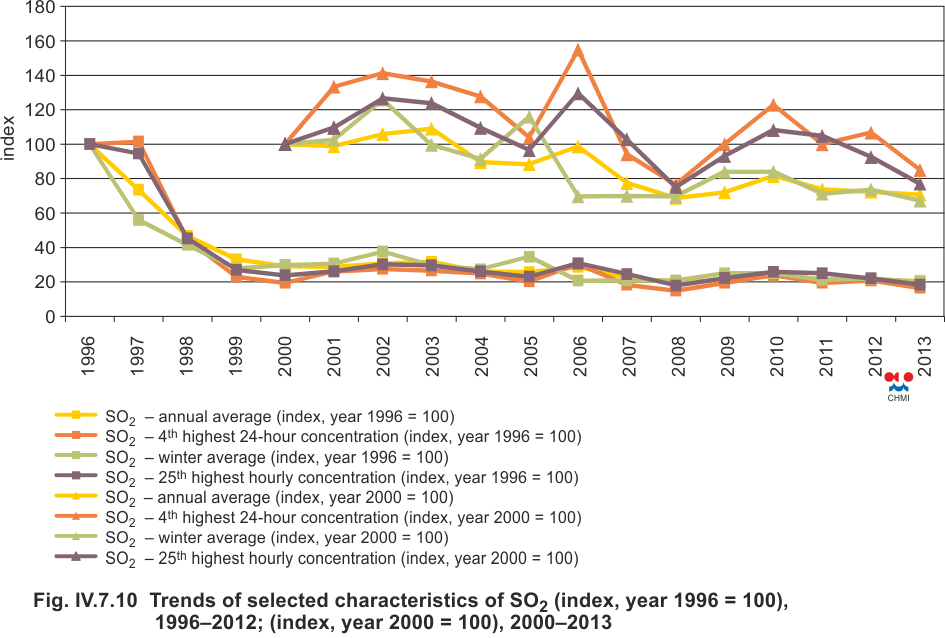
Fig. IV.7.10 Trends of selected characteristics of SO2
(index, year 1996 = 100), 1996–2012;
(index, year 2000 = 100), 2000–2013
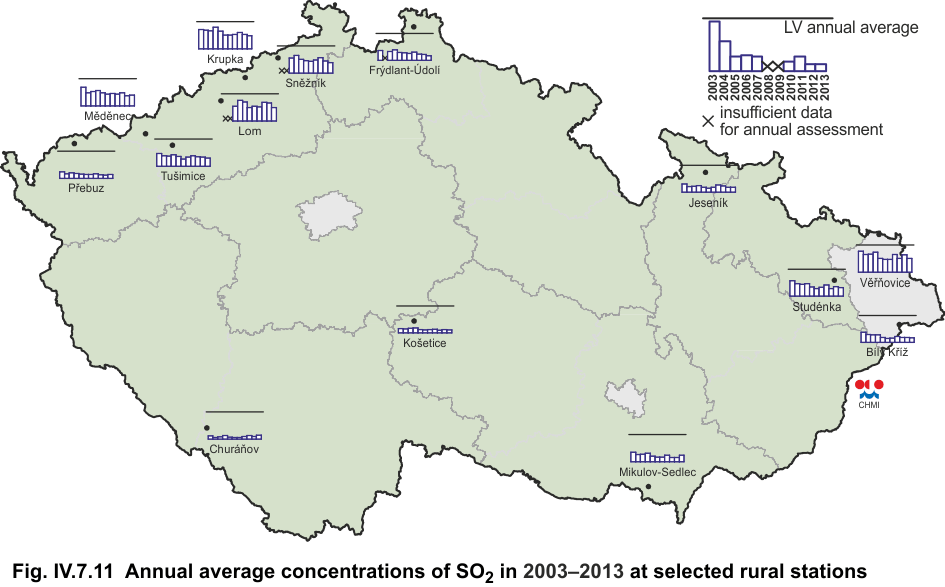
Fig. IV.7.11 Annual average concentrations of SO2
in 2003–2013 at selected rural stations
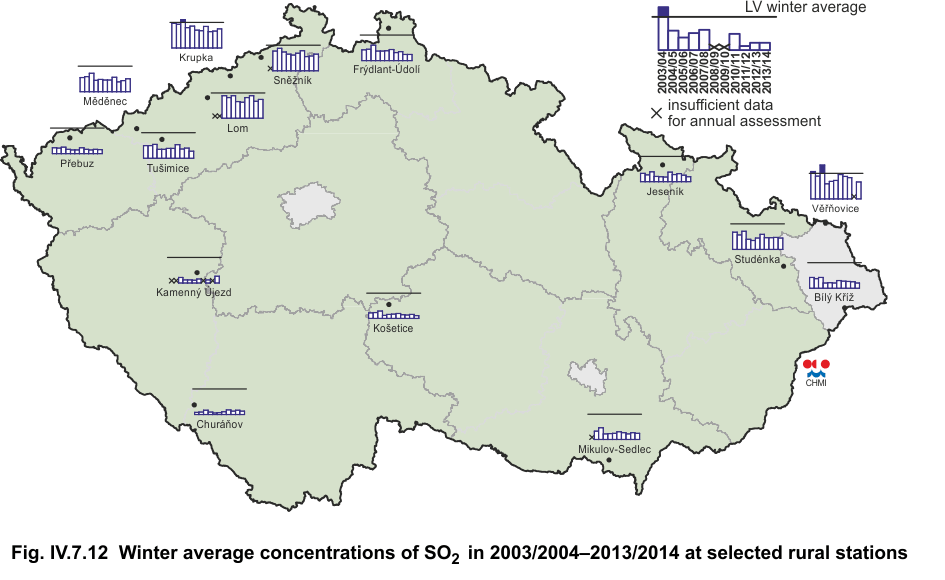
Fig. IV.7.12 Winter average concentrations of SO2
in 2003/2004–2013/2014 at selected rural stations
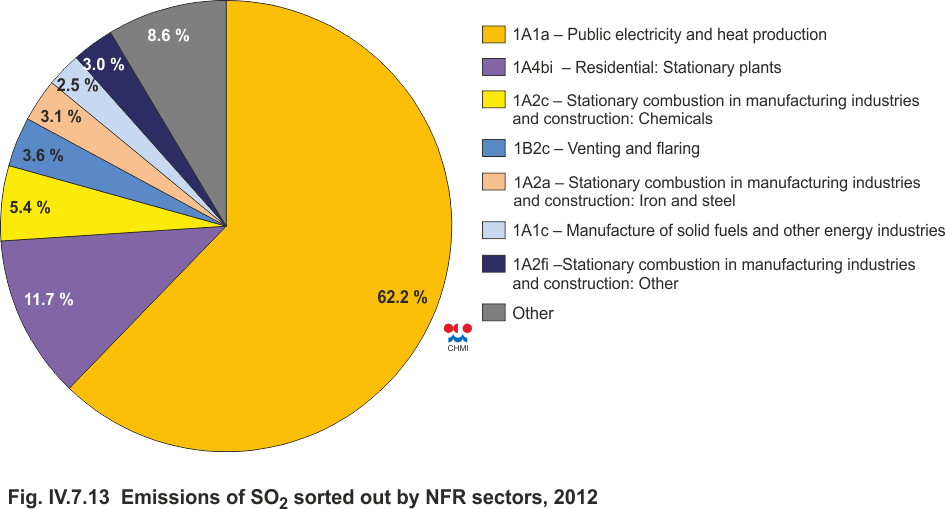
Fig. IV.7.13 Emissions of SO2 sorted out by NFR
sectors, 2012
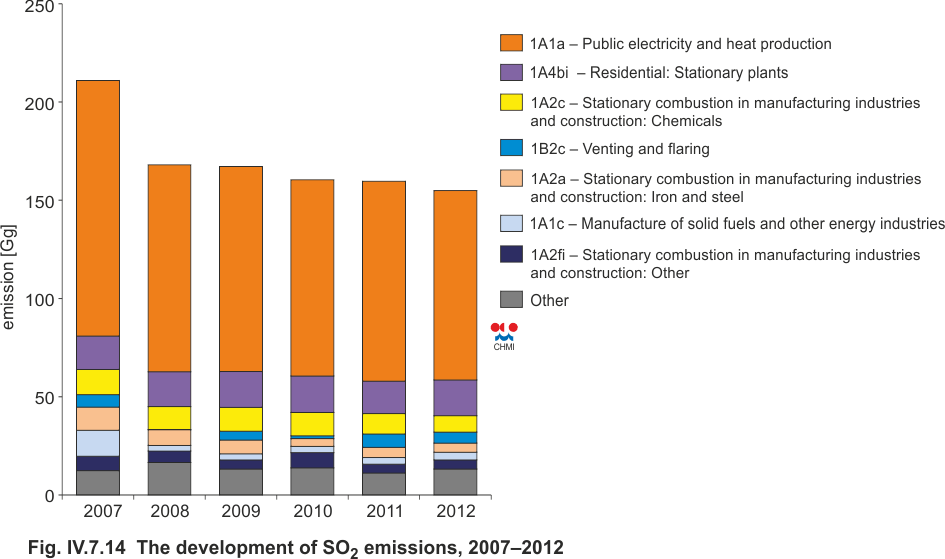
Fig. IV.7.14 The development of SO2 emissions,
2007–2012

Fig. IV.7.15 Sulphur dioxide emission density from 5x5 km squares, 2012