IV.5 BENZENE (C6H6)
IV.5.1 Air pollution caused by C6H6 in the
year 2013
In 2013 benzene concentrations were measured in total in 29
localities. The level of the limit value (5 µg.m-3)
was not exceeded in any locality in 2013 (Fig. IV.5.1). The
highest concentrations were reached at the stations in the
agglomeration of Ostrava/Karviná/Frýdek-Místek and
Ostrava-Přívoz and Ostrava-Fifejdy were the most loaded
localities in the recent years (Table XIII.10). In 2013, for the
first time from the beginning of the measurements in 1999, the
result benzene concentration in the locality Ostrava-Přívoz
(3.95 µg.m-3) did not reach the limit value; the concentration
in the locality Ostrava-Fifejdy decreased from 4.1 µg.m-3 in the
year 2012 to 3.5 µg.m-3. Higher concentrations depicted by the
field of the annual average benzene concentration (Fig. IV.5.1)
are connected primarily with industrial activities, and namely
with coke production and processing of chemical products (CHMI
2013d).
In comparison with the year 2012, approximately 31 % of
localities (4 localities) recorded the decrease of annual
average concentration, 69 % of localities (9 localities)
recorded a slight increase of these concentrations (of the total
number of 13 stations which measured benzene concentrations both
in 2012 and 2013). In the summer period benzene concentrations
are usually lower than those in the winter period (Fig. IV.5.2). This annual course is probably the result of worse dispersion
conditions in winter periods (Schnitzhofer et al. 2008).
IV.5.2 The development of C6H6 concentrations
The annual average concentration of benzene in the CR within the
period 2005–2013 reached its maximum levels in the year 2006.
Since then the concentration has been gradually decreasing with
one positive deviation in the year 2010. The years 2006 and 2010
were characterized by deteriorated dispersion conditions in the
CR which could result in the increased accumulation of benzene
in the air (Fig. IV.5.4).
Higher annual average concentrations are measured in the
localities situated in the cities; the highest benzene
concentrations are usually reached at the stations classified as
urban industrial and urban traffic (Fig. IV.5.4). The localities
situated in rural areas reach the lowest levels. The same
results were reached also by Karakitsios et al. (2007). This is
caused by higher concentration of industrial production and road
transport in the cities.
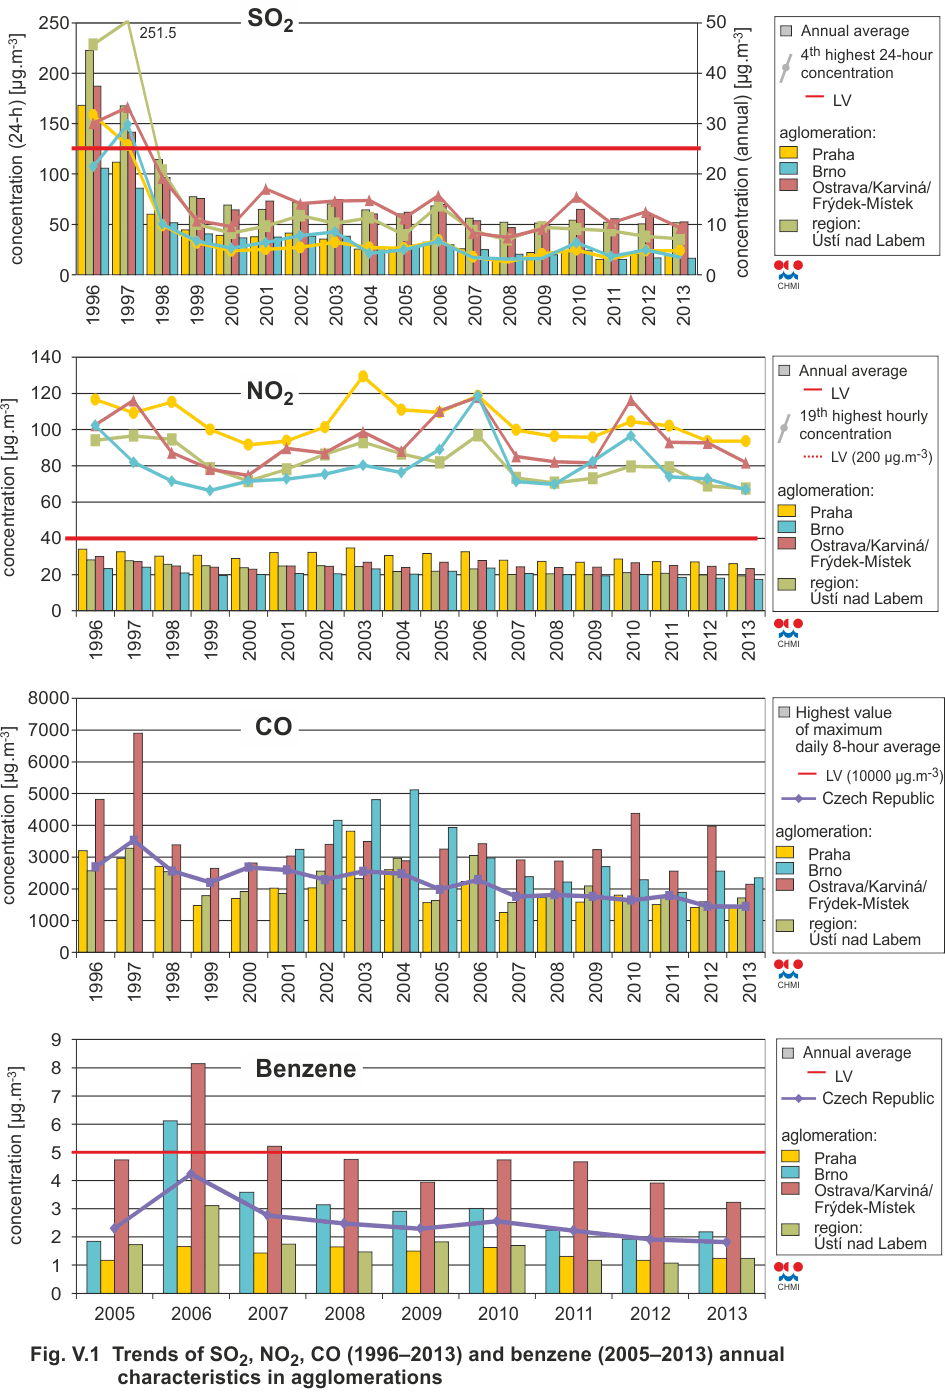
Although benzene reaches the highest annual average
concentrations in the agglomeration of Ostrava/
Karviná/Frýdek-Místek (Fig. V.1,
Fig. IV.5.3), the results of
the long-term automated measurements in this area show that the
average annual concentrations of benzene have had a downward
trend there since 2012. The exceedances of the annual limit
value at the station Ostrava-Přívoz before the year 2013
occurred due to the fact that this locality recorded 1-hour
concentrations higher than 50 µg.m-3, i.e. such concentrations
that at other stations in Ostrava occurred in much smaller
numbers, and outside Ostrava they did not occurred at all.
Benzene concentrations in Ostrava were temporarily influenced
also by the removal of old ecological loads in Ostrava-Mariánské
Hory in 20111. The annual concentrations decreased after the
shutdown of the coke plant Koksovny Jan Šverma (shut down on 31.
12. 2010) and after the implementation of a number or measures
aimed at the reduction of emissions from the sources of the
companies BorsodChem MCHZ, s. r. o. and the coke plant OKK
koksovny, a. s. (CHMI 2013d). The second highest average
concentration of benzene is usually measured in the
agglomeration of Brno. However, this agglomeration is
represented by only one traffic locality, Brnostřed, which as
the only one from this area had the continuous and sufficiently
long time series of measurements necessary for the assessment of
the trend. Therefore it is necessary to point out that the
values measured in this locality are not representative for the
whole agglomeration of Brno.
IV.5.3 Emissions of C6H6
The balance of benzene emissions is based for the great part on
the calculation from the reported VOC emissions. The reported
emissions can be found only in the sources with the obligation,
set by the legislation, to ascertain air pollution levels,
mainly for the verification of the compliance with the emission
limit values. There are certain exceptions, and namely the
sources such as coke plants and connected branches of chemical
production for which the operator is obliged to ascertain
benzene emissions pursuant to the integrated permit and specific
procedures are used to ascertain the release. The Ostrava area
where such technologies are used is one of the few localities
with frequent exceedances of the set limit values in the long
term.
Emission balances were produced only exceptionally in the recent
years, as a rule they were presented within the respective
project results. The last of them presents the data for the year
2010 and the greatest share of the total amount of benzene (approx.
1,250 t.year-1) is represented by the use of paints (Resler,
Jareš 2014). The shares of benzene in VOC emissions result
partly from composition of the used products (e.g. solvents,
paints, finishes and adhesives), or fuels, or they are
determined from the assumed composition of specific organic
substances formed during the combustion of various types of
fuels. The greatest amount of benzene emissions for the year
2013 (as well as for the previous one) was reported by the
chemical production company DEZA, a. s. – Chemické výroby,
Valašské Meziříčí (5.356 t.year-1), further emissions items are
about one order lower.
Tab. XIII.10 Stations with the highest values of annual average concentrations of benzene

Fig. IV.5.1 Field of annual average
concentration of benzene in the ambient air in 2013
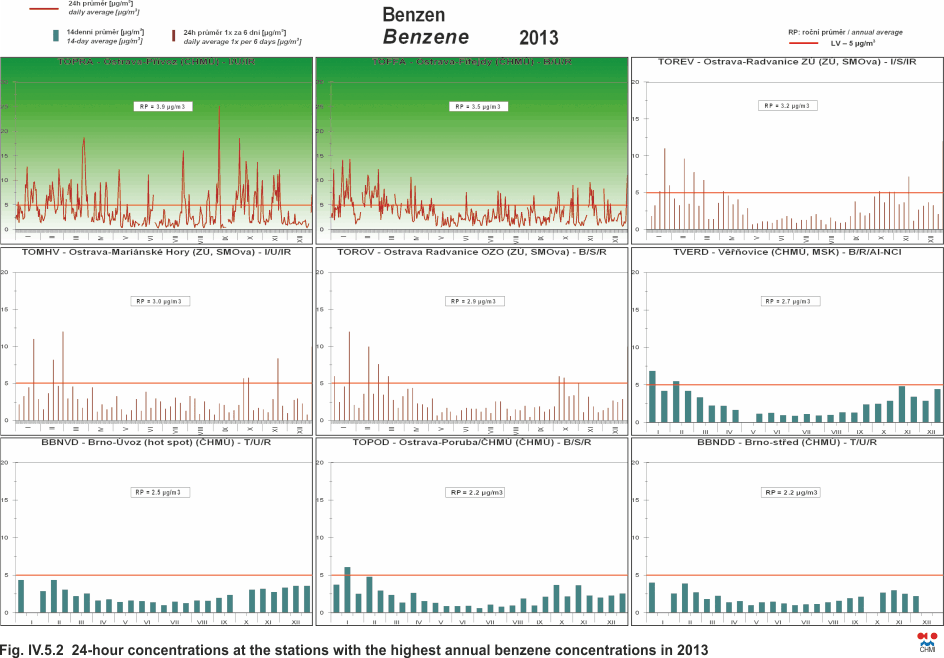
Fig. IV.5.2 24-hour concentrations at the stations with the
highest annual benzene concentrations in 2013

Fig. IV.5.3 Annual average concentrations of benzene in
2003–2013 at selected stations
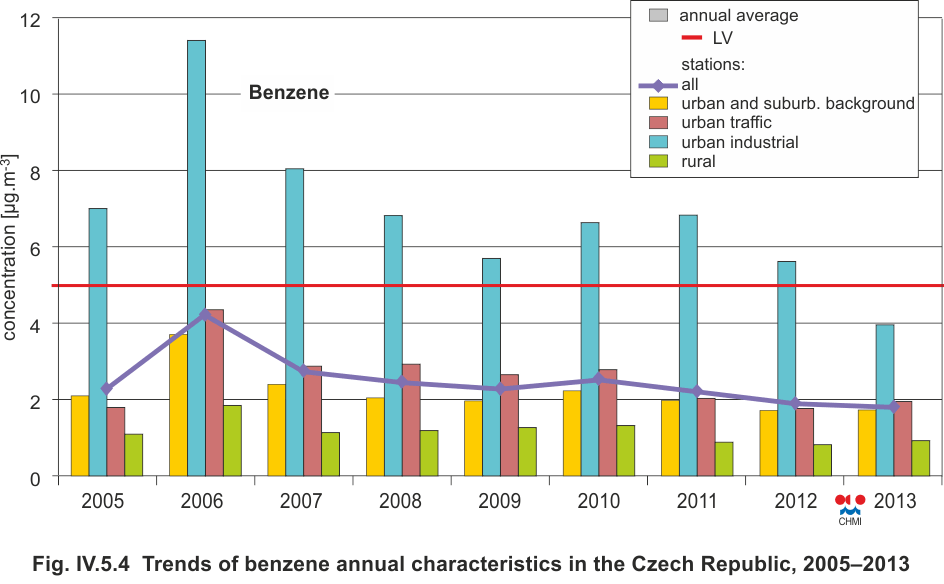
Fig. IV.5.4 Trends of benzene annual characteristics in the
Czech Republic, 2005–2013
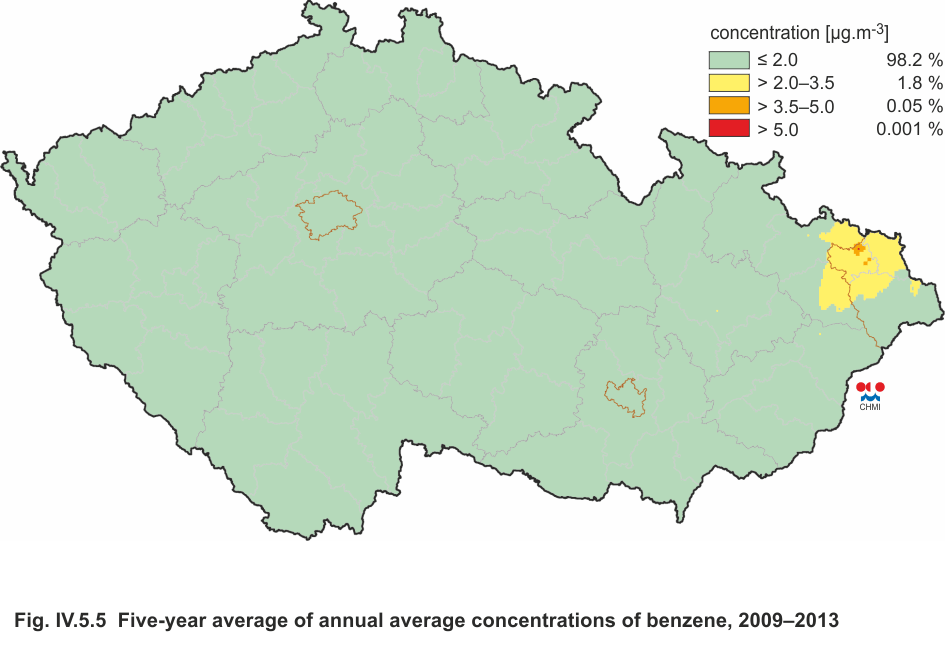
Fig. IV.5.5 Five-year average of annual average concentrations of benzene, 2009–2013
1Removal of old ecological loads in Ostrava-Mariánské Hory was carried out in 2011 by remediation of waste lagoons formed by waste disposal from refinery production launched at the end of 19th century (starting from 1965 also waste from regeneration of exploited lubricating oils was deposited there from the state enterprise OSTRAMO Ostrava, since 1992 OSTRAMOVlček and co., s. r. o.). The shutdown occurred in 1996.