IV.2 BENZO[A]PYRENE
IV.2.1 Air pollution caused by benzo[a]pyrene in the year 2013
Air pollution caused by benzo[a]pyrene is one of the main
problems of air quality protection in the CR. In 2013 the annual
average concentrations of benzo[a]pyrene exceeded the limit
value in almost 68 % of stations (i.e. at 21 of the total number
of 31 stations with sufficient number of measurements for the
evaluation). The year-to-year comparison shows no significant
change because in 2012 exceedances occurred in 67 % of stations
(i.e. at 20 of 30 stations with sufficient amount of the
measured data for the evaluation. The average annual
concentrations in 2013 in comparison with the year 2012 (evaluated
on the basis of the group of stations for which data both for
the year 2012 and 2013 are available) slightly decreased in more
than a half of the localities. Similarly, the average annual
concentration (averaged for the same group of stations at which
measurements were carried out both in 2012 and 2013) was
slightly lower in 2013 (1.96 ng.m‑3) in comparison with the year
2012 (2.11 ng.m‑3).
A number of towns and smaller settlements were evaluated,
similarly as in the previous years, as the territories with the
exceeded limit value (Fig. IV.2.1). In 2013 the limit value was
exceeded in 17.4 % of the territory of the CR (in 2012 in 26.5 %
of the territory of the CR). The percentage of inhabitants
exposed to the above-the-limit concentrations of benzo[a]pyrene
in 2013, is estimated at 54.5 % (in 2012 approx. 66.3 %).
It is necessary to consider that the estimate of the fields of
annual average benzo[a]pyrene concentrations (Fig. IV.2.1), in comparison with other mapped pollutants, is burdened with the
greatest uncertainties resulting from insufficient density of
measurement. The uncertainty of the map is influenced also by
insufficient number of measurements at rural regional stations.
However, there is another contribution to uncertainty resulting
from the absence of measurements in small settlements in the CR
which would represent the fundamental influence of local heating
as concerns ambient air pollution caused by benzo[a]pyrene.
Consequently, the assessment of the year-to-year change of the
share of the affected area and population by exceeded benzo[a]pyrene
concentrations is burdened with greater uncertainty. More
details on uncertainty of mapping are presented in Annex I.
The highest annual average concentration in 2013 was measured,
similarly as in the previous years, in the industrial locality
Ostrava-Radvanice ZÚ (9.4 ng.m‑3) with almost ninefold
exceedance of the level of the limit value. The above-the-limit
concentrations were reached also in other three industrial
localities and in almost 73 % of urban and suburban background
stations. As concerns traffic stations, benzo[a]pyrene
concentrations are measured at two stations only and one of them
exceeded the limit value (Table XIII.16). The exceedance of the
limit value for benzo[a]pyrene at most stations is given by more
or less regular distribution of the main source of benzo[a]pyrene
emissions, i.e. household heating. The highest concentrations
are measured, similarly as in other pollutants, in the
agglomeration of O/K/F-M due to the highest emission loads
within the CR (more details see in Chapter IV.2.3).
The highest concentrations of benzo[a]pyrene in the CR are
measured every year at the stations OstravaPřívoz and Český
Těšín (Fig. IV.2.4). Unfavourable situation in the
Ostrava-Karviná area and the year-round influence of emissions
is illustrated by the fact that in summer periods, when benzo[a]pyrene
concentrations at other stations reach the levels around the
margin of detection (0.04 ng.m‑3), even daily concentrations
exceeding 1 ng.m‑3 are recorded at the above stations (e.g.
Ostrava-Přívoz 3.48 ng.m‑3 on 24. 7. 2014, Český Těšín 2.47 ng.m‑3
on 29. 8. 2014 –
Fig. IV.2.3).
The above-the-limit benzo[a]pyrene
concentrations represent the burden also for the settlements
without the routine monitoring of benzo[a]pyrene concentrations.
This fact is repeatedly confirmed by the measurement results
from various localities, financed in the recent years from the
budget of the Moravia-Silesia region1, and also by the routine
measurements, implemented newly in 2013 and carried out by CHMI
in Valašské Meziříčí. Although the new sampler is located on the
ground near the school building in the sesidential area and it
is not directly influenced by benzo[a]pyrene emissions, due to
the annual average 2.9 ng.m‑3 this locality is ranked among the
strongly polluted ones. Similar annual average concentrations of
benzo[a]pyrene were measured at the station in Zlín and even
also at the station in Frenštát pod Radhoštěm (2.6 ng.m‑3) in
the foothills of the Beskydy Mts.
Benzo[a]pyrene concentrations show a marked annual course (Figs.
IV.2.2 and
IV.2.3) with the maximum levels in the winter period,
and the minimum levels in the summer period. The increased
concentrations of the winter period are related with the
increased PAH concentrations from seasonal anthropogenic sources
– from local heating (i.e. from the most significant source of
benzo[a]pyrene emissions –
Fig. IV.2.9). PAH emissions have
another significant source, and namely traffic; moreover, in
winter period PAH emissions are increased due to cold starts.
Further causes of increased concentrations include deteriorated
dispersion conditions in winter period, simpler gas-particle
conversion at low temperatures and lower photochemical
decomposition of PAH. In summer periods, on the contrary, the
concentrations decrease due to better dispersion conditions,
increased chemical and photochemical decomposition of PAH at
higher intensity of solar radiation and high temperatures and,
of course, due to the reduction of emissions from anthropogenic
sources (Li et al. 2009; Ludykar et al. 1999; Teixeira et al.
2012).
In 2013 the highest concentrations were measured in the months
of January–March, probably due to the frequent occurrence of
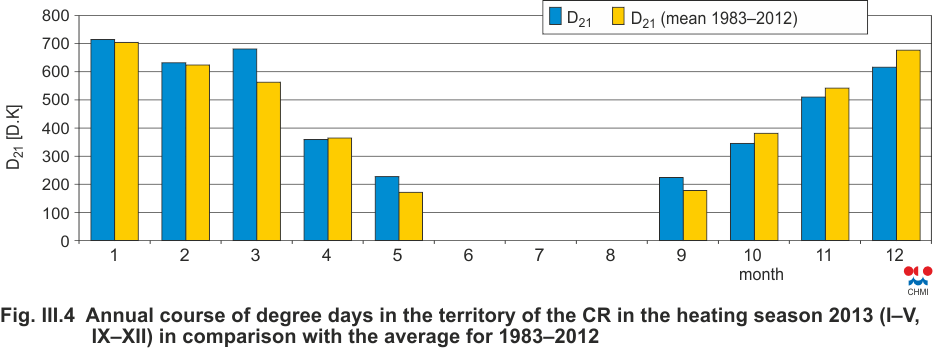
unfavourable dispersion conditions. On the contrary, the last
three months of the year had more favourable dispersion
conditions and above-the-normal temperatures (see Chapter III),
which, together with lower intensity of heating, resulted in
lower concentrations than it is usual in this period. The
reduced intensity of heating and the consequent decrease of
emissions from heating from October to December can be assumed
on the basis of the comparison of degree days in the individual
months of the heating season (Fig. III.4). However, the average
monthly concentration in October–December for individual types
of localities, however, mostly exceeded the limit value in spite
of the mentioned favourable dispersion conditions. Nevertheless,
in comparison with the period October–December of the year 2012
they reached lower levels (Fig. IV.2.2,
Fig. IV.2.7).
IV.2.2 The development of benzo[a]pyrene concentrations
The trends of average annual concentrations of benzo[a]pyrene can be evaluated since 2005. The national average of the levels of this pollutant shows the long-term exceedances of the limit value, (more than double levels). The highest benzo[a]pyrene concentrations were measured in 2006 (more than threefold exceedance of the limit value) due to deteriorated meteorological and dispersion conditions. Since 2007 concentrations of benzo[a]pyrene have fluctuated and have not shown any marked trend; according to the year-to-year comparison 2012/2013 it can be stated that the concentrations slightly decreased, in the national average by almost 8 %. The highest concentrations are reached in industrial localities, the above-the-limit concentrations, however occur also at urban and suburban stations (Figs. IV.2.4 and IV.2.5). As already mentioned, insufficient number of measurements at rural stations does not allow the ascertainment of the level of benzo[a]pyrene concentration in small settlements, nevertheless on the basis of the structure of emission sources and e.g. the results of the study by Krejčí (2012) it may be stated that the concentrations there reach the above-the-limit levels as well.
IV.2.3 Emissions of benzo[a]pyrene
Emissions of PAH, in the ambient air pollution sphere
represented by benzo[a]pyrene, are produced almost exclusively
by combustion processes during which the present organic
combustible substances are not sufficiently oxidized. Benzo[a]pyrene
is the product of insufficient combustion at the temperatures
from 300 to 600 °C. Therefore, the most significant sources
include the combustion of solid fuels in low-output boilers,
primarily in households, and transport.
The sector of local household heating contributed to benzo[a]pyrene
emissions in 2012 by 89.6 % (Fig. IV.2.9). This high share was
caused by the combustion of solid fuels, mainly coal, in boilers
of old types (under-fire boilers, over-fire boilers). The expert
estimates state that non-gasification boilers and lower
combustion boilers represent up to 85 % of all solid fuels
combustion plants in households (Bufka 2011). The influence of
passenger car transport and road freight transport over 3.5 t is
estimated at 6.5 %. Other significant sources of benzo[a]pyrene
emissions are found in the sector iron and steel production.
Due to the dominant share of the local household heating sector
benzo[a]pyrene emissions are distributed throughout the area of
the CR with residential development (Fig. IV.2.10). The
influence of traffic is evident mainly along highways and in the
territory of big cities. The greatest burden of benzo[a]pyrene
emissions is recorded in the Moravia-Silesia region due to the
share of iron and steel production plants and the coke plants
connected with them.
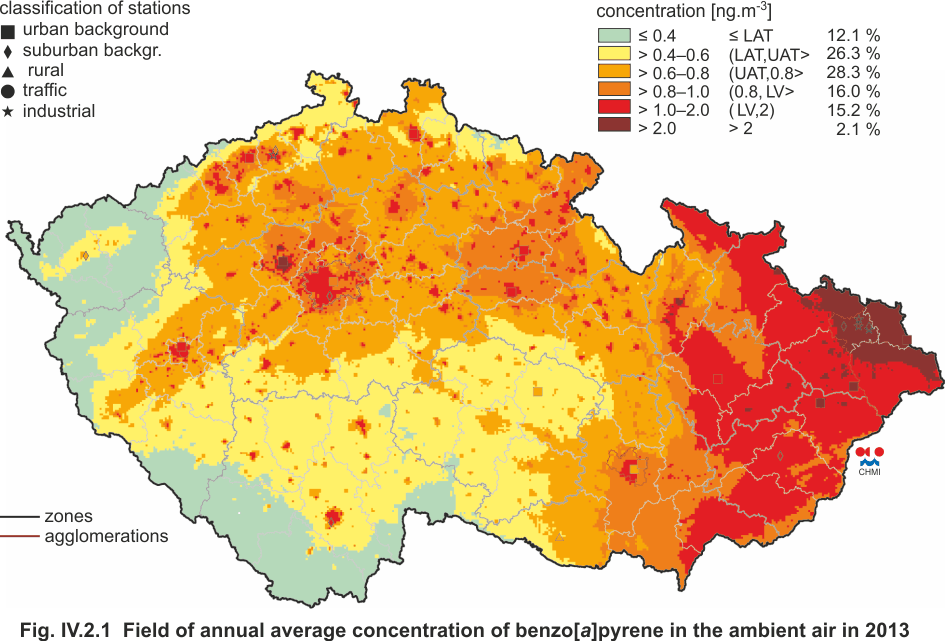
Fig. IV.2.1 Field of annual average concentration of benzo[a]pyrene in the ambient air in 2013
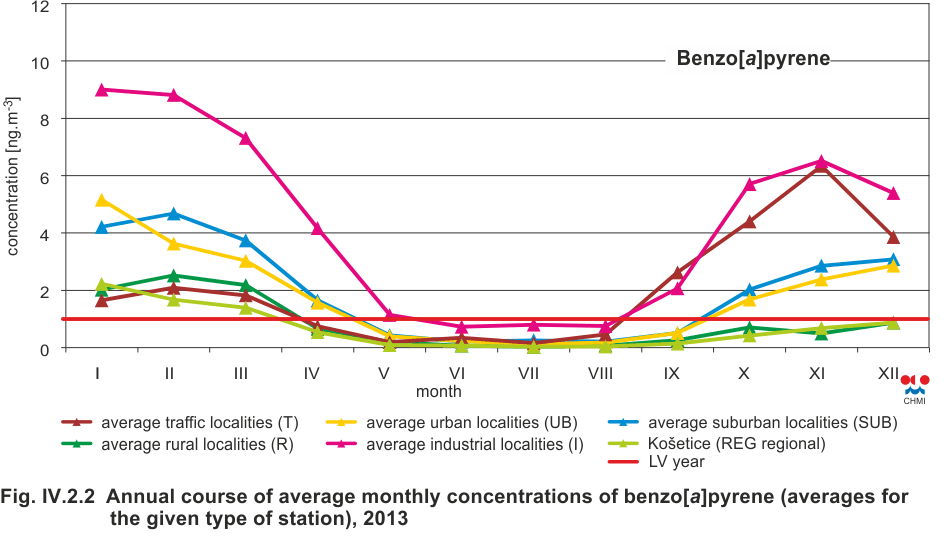
Fig. IV.2.2 Annual course of average monthly concentrations of benzo[a]pyrene (averages for the given type of station), 2013

Fig. IV.2.3 24-hour concentrations at the stations with the highest annual concentrations of benzo[a]pyrene in 2013
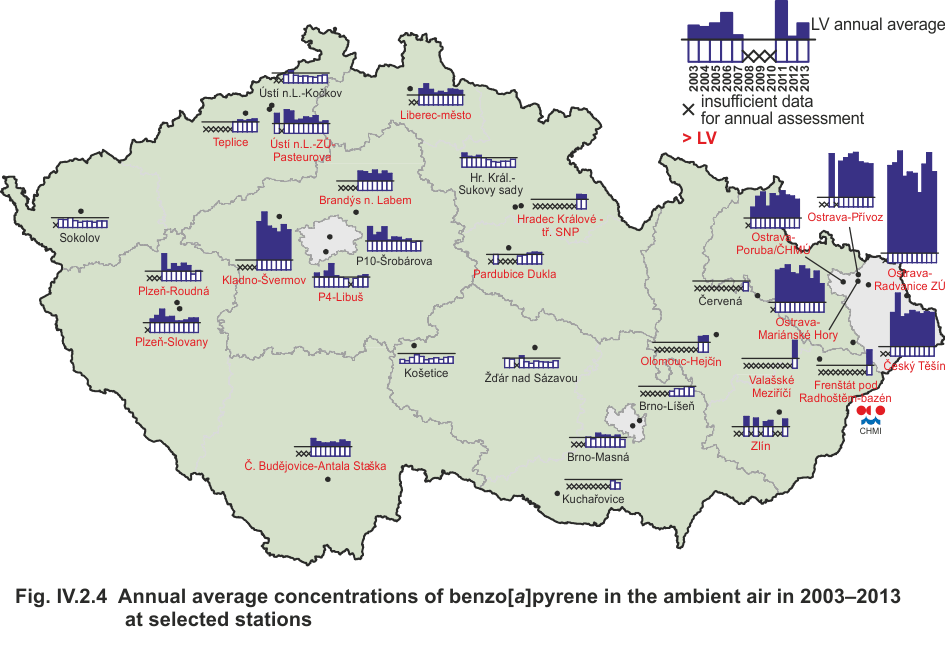
Fig. IV.2.4 Annual average concentrations of benzo[a]pyrene in the ambient air in 2003–2013 at selected stations

Fig. IV.2.5 Trends of benzo[a]pyrene annual characteristics in the Czech Republic, 2005–2013

Fig. IV.2.6 Five-year average of annual average concentrations of benzo[a]pyrene, 2009–2013
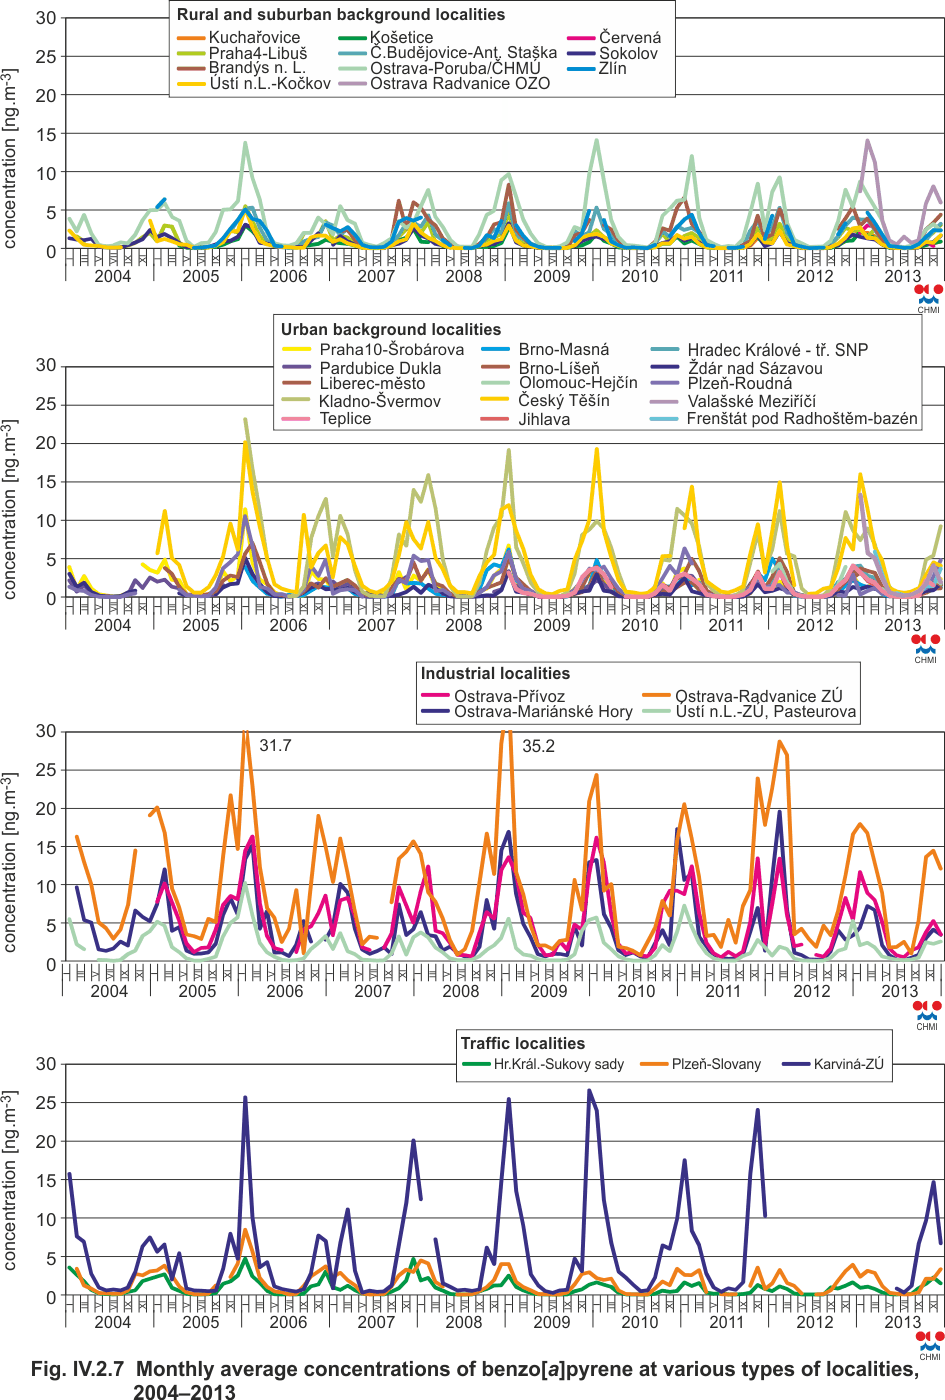
Fig. IV.2.7 Monthly average concentrations of benzo[a]pyrene at various types of localities, 2004–2013

Fig. IV.2.8 Concentrations of benzo[a]pyrene and PM10 particles in individual localities, 2009–2013
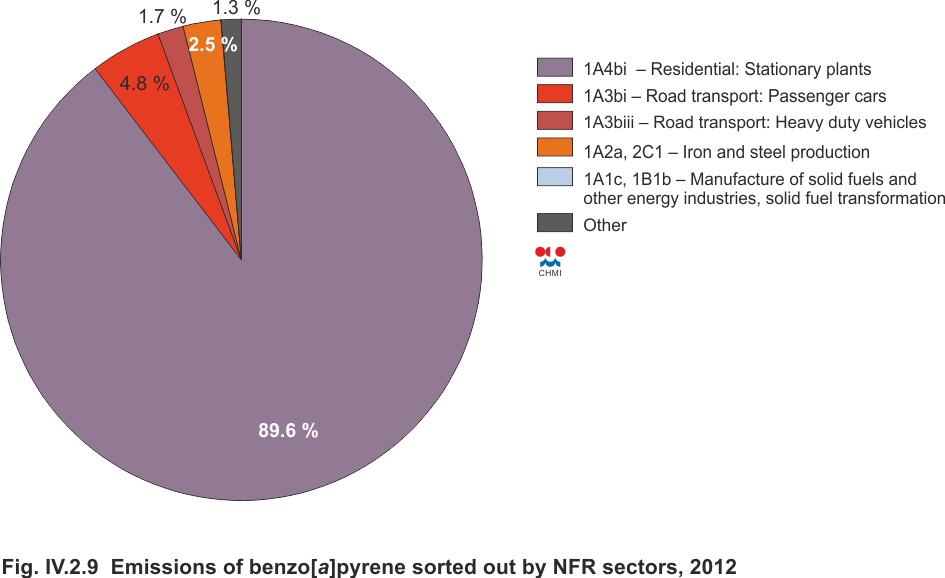
Fig. IV.2.9 Emissions of benzo[a]pyrene sorted out by NFR sectors, 2012
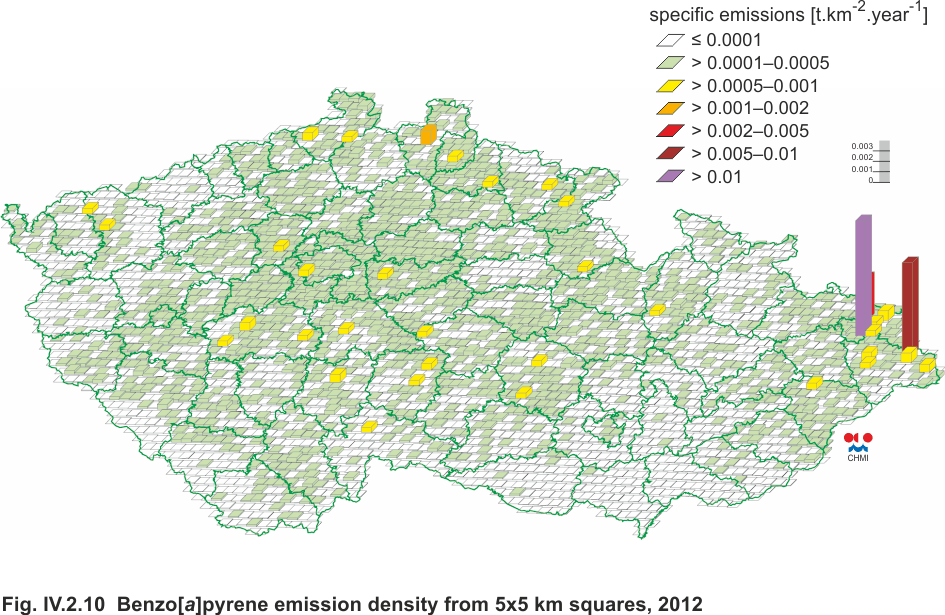
Fig. IV.2.10 Benzo[a]pyrene emission density from 5x5 km squares, 2012
1The detailed annual evaluation see www.chmi.cz: About us Organizational Chart Ostrava Regional Office Air Quality Monitoring Services portal.chmi.cz/o-nas/organizacni-struktura/pobocka-ostrava/oddeleni-ochrany-cistoty-ovzdusi/nabidka-sluzeb.