IV. AIR QUALITY IN THE CZECH REPUBLIC
IV.1 SUSPENDED PARTICLES
Air pollution caused by PM10 and PM2.5 fraction of suspended particles remains one of the main problems of air quality assurance in the CR. The exceedance of PM10 and PM2.5 limit values is still significant for including the respective settlements among the areas with limit value exceedances.
IV.1.1 Air pollution caused by suspended particles in the year
2013
Suspended particles of PM10 fraction
The limit value for PM10 24-hour concentrations was exceeded in 2013 in 5.7 % of the territory of the CR with approx. 15.9 % of inhabitants, and for PM10 average annual concentration in 0.7 % of the territory with approx. 4.8 % of inhabitants (Figs. IV.1.1 and IV.1.2).
The exceedance of the 24-hour limit value for PM10 was recorded
in 2013 in almost one third of stations (32.6 %, i.e. 42
stations of the total number of 129). In 2012 the daily limit
value was exceeded in 42 % of stations (53 stations of 147;
Fig.
IV.1.14). In comparison with the year 2012 the 36th highest
concentration of PM10 decreased in almost 60 % of stations. The
average 36th highest concentration of PM10 in 2013 (48.9 µg.m-3) was lower as compared with the year 2012 (51.3 µg.m-3)1.
Consequently, the territory with the exceeded daily limit value
for PM10 decreased from 9.6 % with about one third of the CR
population, to the already mentioned 5.7 % with approx. 15.9 %
of inhabitants.
The most affected area of large coverage was, similarly as in
the previous years (Figs. IV.1.10 and
IV.1.11) the agglomeration
of O/K/F-M where the daily limit value for PM10 was exceeded in
2013 at most stations. However, the daily limit value for PM10
was exceeded in all zones and agglomerations in at least one
locality with the exception of the South-eastern zone (Fig.
IV.1.3,
Table XIII.4). In the agglomeration of Prague, in the
agglomeration of Brno, in the North-eastern zone and in the
Southwestern zone the exceedance of the limit value in 2013 was
connected primarily with traffic loads; in other zones, however,
the exceedances occurred also at the background urban, suburban
and rural stations. In 2013 the annual limit value for PM10 was
exceeded in 7.4 % of stations, i.e. at 10 stations of the total
number of 136 stations in the CR with sufficient amount of data
for the evaluation; all exceedances were recorded only at the
stations in the agglomeration of O/K/F-M (Table XIII.5,
Fig.
IV.1.12). In 2012 the exceedances of the annual limit value were
recorded in 10.8 % of stations (15 stations of 138;
Fig.
IV.1.14). The annual average concentration of PM10 decreased in
comparison with the year 2012 in 54 % of stations and the
average annual concentration in 2013 (26.8 µg.m-3) was slightly
lower in comparison with the year 2012 (27.3 µg.m-3)1. The
territory with the annual limit value exceedances in 2013
decreased to 0.7 % with approx. 4.8 % inhabitants from 0.9 % of
the territory with approx. 5.2 % of inhabitants evaluated in
2012.
The concentrations of PM10 show a clear annual course with the
highest concentrations in the cold months of the year (Figs.
IV.1.4,
IV.1.5,
IV.1.6). Higher concentrations of PM10 in the ambient air
during the cold part of the year are connected both with higher
emissions of particles from seasonal heat sources (e.g. the
share of local heating in PM10 and PM2.5 emissions in the CR is
41 % and 59 % respectively –
Figs. IV.1.19 and.
IV.1.20), and
with deteriorated dispersion conditions, more frequent in winter
months.
In 2013 the highest concentrations were measured in the months
January–March, namely due to frequent unfavourable dispersion
conditions. On the contrary, the last three months of the year
were, with regard to dispersion conditions, more favourable and
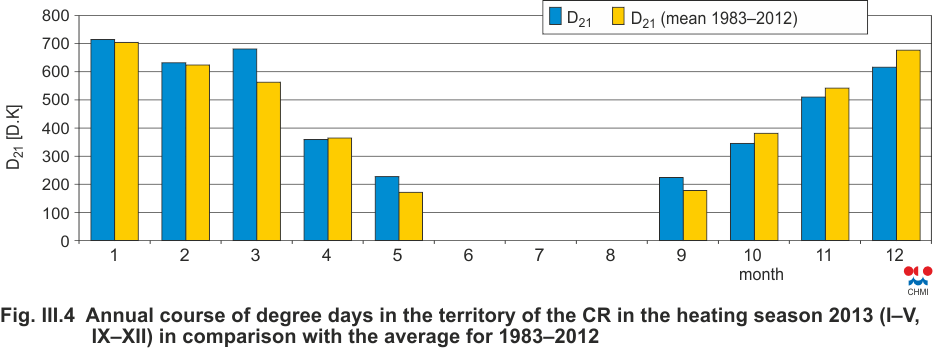
recorded the above-the-normal temperatures (see Chapter III).
Along with the lower intensity of heating this resulted in lower
average monthly concentrations, i.e. in their decrease. The
lower intensity of heating and the subsequent decrease of
emissions from heating from October to December can be assumed
on the basis of degree days comparison in individual months of
the heating season (Fig. III.4). Detailed analysis of the
reasons for higher concentrations of PM10 in the first months of
the year 2013 is presented in Chapter III.
Suspended particles of PM2.5 fraction
The level of air pollution caused by PM2.5 in 2013 did not
changed significantly in comparison with the year 2012. The
annual limit value for PM2.5 was exceeded in 2.4 % of the CR
territory with approx. 9.6 % of inhabitants (Fig. IV.1.7). In
2012 the same part of the territory of the CR with the exceeded
limit value was recorded with approx. 10.2 % of inhabitants. The
exceedances were recorded at six stations in the agglomeration
of O/K/F-M and at one station in the agglomeration of Prague, at
one station in the Moravia-Silesia zone and at one station in
the Central Moravia zone (Table XIII.6,
Fig. IV.1.9) of the
total number of 46 stations (i.e. exceedances in 19.6 % of
stations); in 2012 exceedances were recorded at nine stations of
45 (Fig. IV.1.14). In comparison with the year 2012 the average
annual concentration of PM2.5 increased in almost 60 % of
stations, nevertheless the average annual concentration of PM2.5
in 2013 was only slightly higher as against the year 2012 (20.9
vs. 20.3 µg.m-3); the evaluation was based on the same set of
stations in both years.
Air pollution caused by PM2.5 occurs mainly in the cold part of
the year (Fig. IV.1.9); higher concentrations in the cold part
of the year are similarly as those in PM10 caused by emissions
from heating and deteriorated dispersion conditions.
The ration of PM2.5 and PM10 fractions of suspended particles
The ratio between PM2.5 and PM10 fractions is not constant, it
shows a certain seasonal course, and at the same time it is
dependent on the locality (Fig. IV.1.8). In 2013 the ratio, in
the average from 32 localities in the CR measuring both PM2.5
and PM10 and with sufficient number of values, ranged from 0.68
(August) to 0.82 (January) with lower values in the summer
period. In Prague, where the annual course is influenced by a
large share of traffic localities, this ratio ranged from 0.56 (September)
to 0.75 (March), in Brno from 0.7 (May) to 0.85 (November) and
in the Moravia-Silesia region from 0.69 (May) to 0.85 (January).
When comparing the ratio with regard to the classification of
localities, the ratio in rural localities is from 0.78 (July) to
0.93 (December), in urban localities from 0.7 (August and
September) to 0.81 (February and March), in suburban localities
from 0.67 (May) to 0.84 (December), in traffic localities from
0.61 (September) to 0.75 (January) and in industrial localities
0.63 (July) to 0.91 (January).
The seasonal course of PM2.5/PM10 fraction ratio is connected
with the seasonal character of several emission sources.
Emissions from combustion sources show higher shares of PM2.5
fraction than for instance emissions from agriculture and
reemissions during dry and windy weather. Consequently, heating
in the winter period can cause the higher share of PM2.5
fraction in comparison with PM10 fraction. The decrease during
the spring and early summer is also explained by the increased
amount of larger biogenic particles (e.g. pollen) by some
authors (Gehrig, Buchmann 2003). The higher PM2.5/PM10 fraction
ratio due to combustion is observed also at industrial stations.
The lowest PM2.5/PM10 ratio is at traffic localities (Fig.
IV.1.8). During fuel combustion the emitted particles occur
mainly in PM2.5 fraction and thus the ratio should be high in
traffic localities. The fact that this is not the case, accents
the significance of emissions of larger particles caused by tyre,
break lining and road surface abrasion. The share of the coarse
fraction at traffic stations increases also due to the re-suspension
of particles following winter spreading of roads. The growth of
PM10 concentrations can be caused also by the increased abrasion
of road surface by spreading and the subsequent re-suspension of
the abraded material (EC 2011).
IV.1.2 The development of PM10 and PM2.5 concentrations
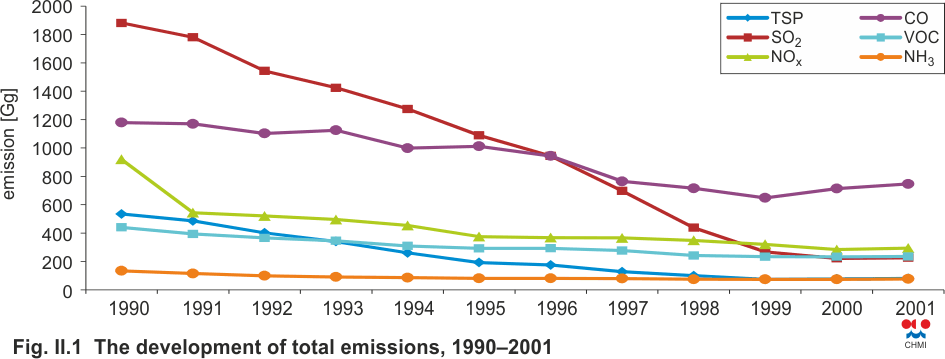
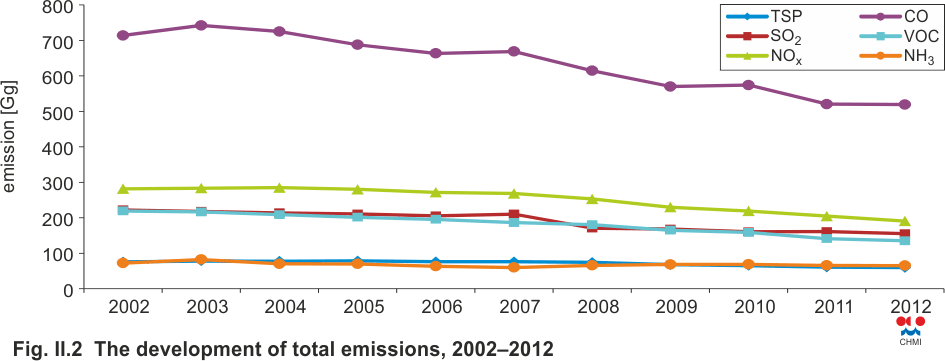
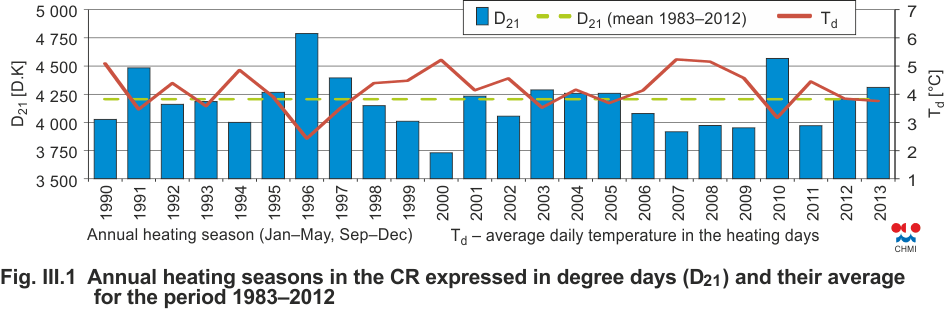
The concentrations of PM10 suspended particles, similarly as in other pollutants, decreased significantly in the 90s of the last century. This was caused by marked decrease of emissions of TSP and precursors of suspended particles (SO2, NOx, NH3 and VOC) in the period 1990–2001 due to the legislative changes, restructuring of economy and modernization or closure of the operated sources (more details see Chapter II., Fig. II.1). After the year 2001 the decrease of emissions continued at a slower rate (Fig. II.2), which resulted in the fact that pollutants concentrations were influenced mainly by the prevailing meteorological and dispersion conditions in the given year. In almost all localities in the CR an increasing trend of air pollution caused by PM10 was apparent from 2001 to 2003. In 2003 so far the highest values of PM10 concentrations were measured in the period after the year 2000. High PM10 concentrations in 2003 were caused both by unfavourable dispersion conditions in February and the belowthe-normal precipitation amounts. After a short change in 2004, when routine monitoring of PM2.5, fraction started, high concentrations of suspended particles were recorded again in the years 2005 and 2006, mainly due to the long episodes with unfavourable dispersion conditions. In 2007–2009, on the contrary, there were more favourable dispersion conditions and the concentrations of particles significantly decreased in comparison with the years 2003, 2005 and 2006. In the year 2008 lower concentrations were caused probably also by more marked decrease of emissions of some precursors of particles during the temporary decline in certain sectors due to the economic crisis (more details see Chapter II.). The subsequent increase of concentrations of suspended particles in 2010 was given mainly by the repeated occurrence of unfavourable meteorological and dispersion conditions in the winter period at the beginning and at the end of the year and by the coldest heating season since 1996 (Fig. III.1). During the last three years since 2010 the concentration of suspended particles have been decreasing. The annual average concentration of PM10 has remained below the limit value in the long term, on the contrary, the annual average concentration of PM2.5 and the 36th highest daily concentration of PM10 fluctuates around the limit value (in all cases averaged for all types of localities and the whole CR; Figs. IV.1.15 and IV.1.16).
IV.1.3 Emissions of PM10 and PM2.5
The combustion of fuels and other industrial activities result
in the production of aerosol emissions which can be solid,
liquid or mixed. The Czech legislation defines these emissions
as solid pollutants (TZL), the foreign literature refers to
Total Suspended Particulate Matter (TSP). With regard to the
effects on human health there were defined the size groups
called PMx (Particulate Matter). They contain the particles
smaller than x µm (aerodynamic diameter). Most often emission
inventories define the PM10 and PM2.5 size fractions. Emissions
of TSP have various size and chemical compositions according to
the character of the source and the way of formation. They may
contain heavy metals and they are carriers of VOC.
Emission inventories of PM10 and PM2.5 particles carried out
according to valid methods include only the emissions produced
by primary sources. In comparison with emissions of other
pollutants PM emissions are emitted into the air from a large
number of groups of sources. Apart from the sources from which
these substances are discharged in a controlled manner,
significant amount of PM emissions have their origin in fugitive
sources (quarries, landfills of dusty materials, operations with
dusty materials etc.). The ambient air quality can be influenced
also by emissions of PM produced by re-suspension of dust, not
included in emission inventories. The share of individual groups
of sources in PM10 and PM2.5 emissions in 2012 is depicted in
Figs. IV.1.19 and
IV.1.20. The main source of PM emissions is
represented by the sector of local household heating; its share
in air pollution caused by PM10 amounted to 40.8 % and by PM2.5
to 59.2 %. Other significant sources of PM10 emissions include
agricultural activities, where these emissions are produced
during tillage, harvest and cleaning of agricultural crops in
fields. This sector contributed with 13.1 % of PM10 emissions.
With regard to the effects on human health, most significant are
the emissions of PM caused by traffic, mainly from fuel
combustion in compression ignition engines, producing the
particles with the size from units to hundreds of nm (Vojtíšek
2010). Road freight transport over 3.5 t and the share of
passenger car transport in PM10 emissions was 6.5 % and in PM2.5
emissions 9.6 %.
The share of households using solid fuels for heating did not
changed in the period 2007–2012 significantly, and therefore the
trend of PM10 and PM2.5 emissions is influenced especially by
the character of heating seasons (Figs. IV.1.21 and
IV.1.22).
The decrease of emissions is influenced especially by the
natural renewal of the car fleet, the decrease of agricultural
production and the implementation of emission ceilings of TSP
for LCP sources since 2008.
With regard to the fact that the main source of PM10 and PM2.5
emissions is represented by the sector of local household
heating, the production of emissions of these pollutants is
distributed throughout the whole inhabited territory of the CR (Figs.
IV.1.23 and
IV.1.24). In the territory of the CR divided into
5x5 km squares there are localities with major energy producers
combusting solid fossil fuels (primarily the Moravia-Silesia
region and the Ústí nad Labem region). The share of traffic is
apparent mainly in big cities.
Tab. XIII.4 Stations with the highest numbers of exceedances of the 24-hour limit value of PM10
Tab. XIII.5 Stations with the highest values of annual average concentrations of PM10
Tab. XIII.6 Stations with the highest values of annual average concentrations of PM2.5
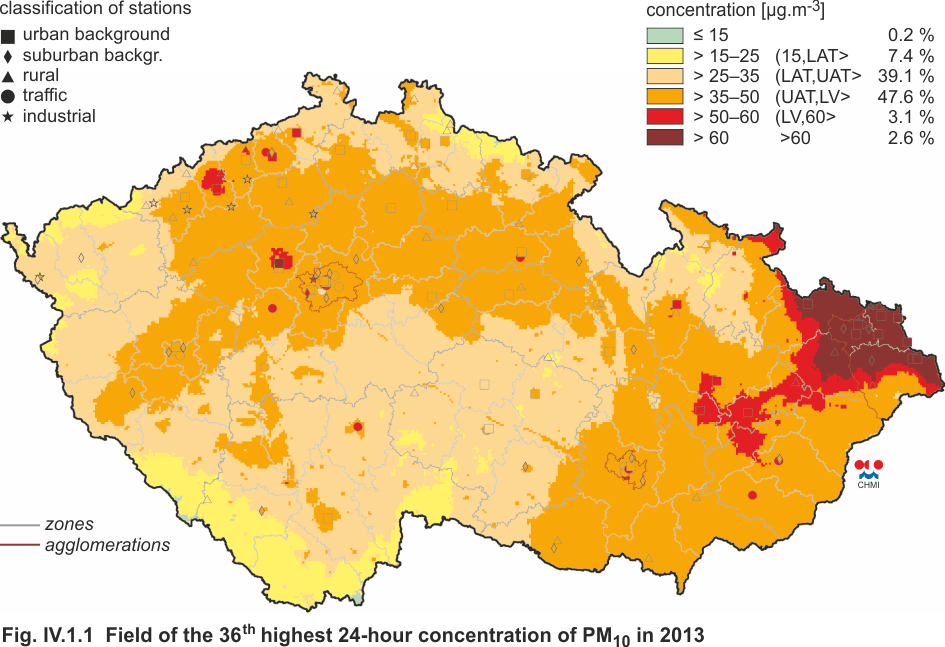
Fig. IV.1.1 Field of the 36th highest 24-hour concentration of PM10 in 2013
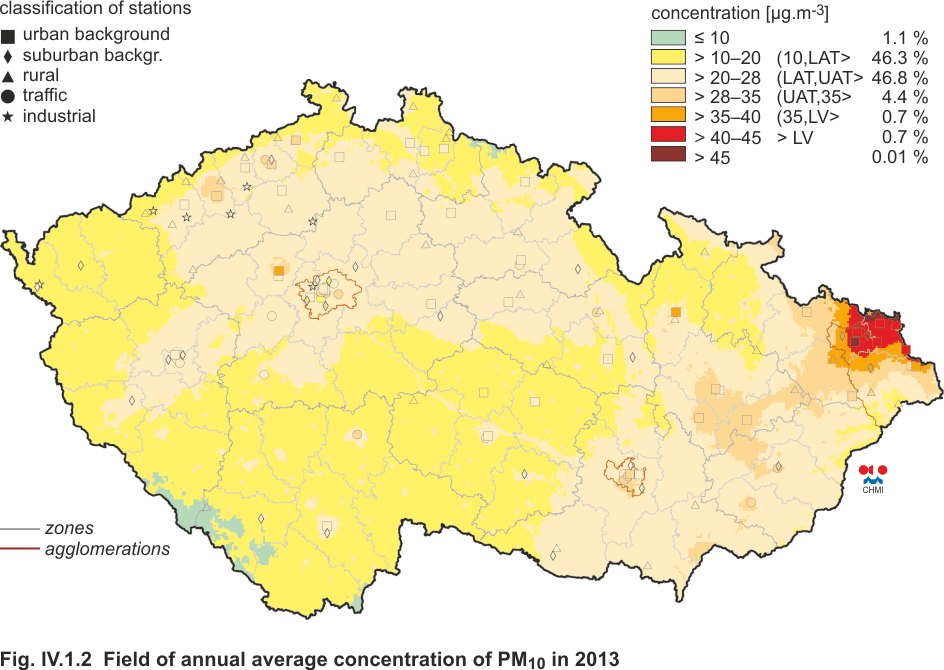
Fig. IV.1.2 Field of annual average concentration of PM10 in 2013
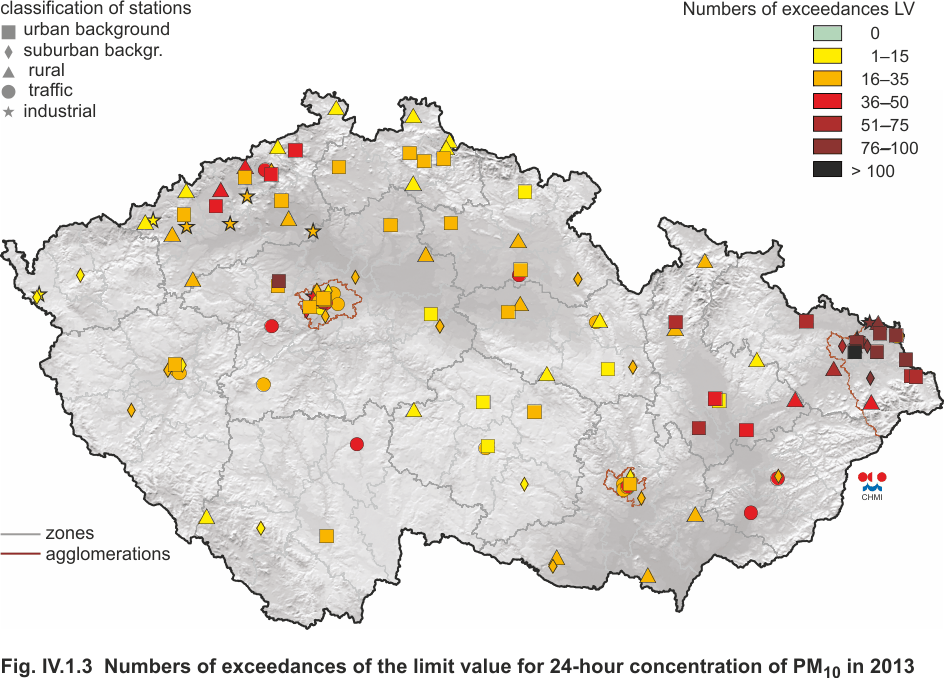
Fig. IV.1.3 Numbers of exceedances of the limit value for 24-hour
concentration of PM10 in 2013
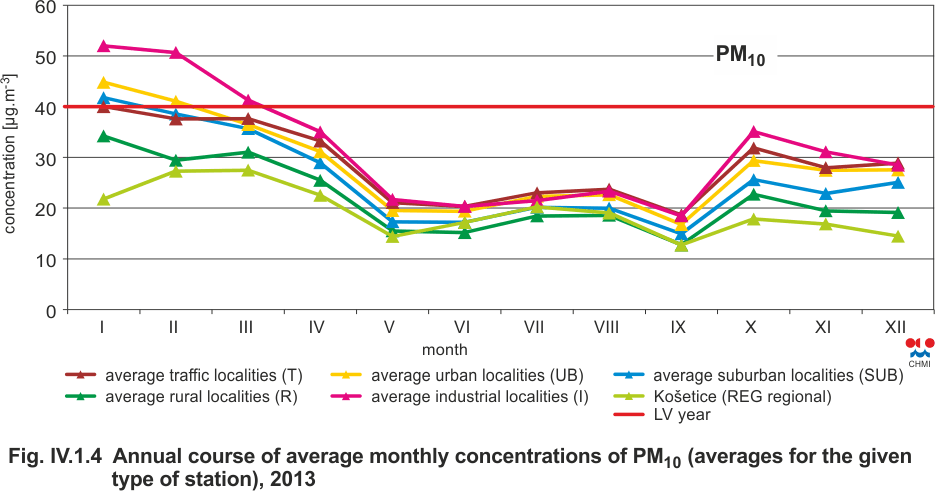
Fig. IV.1.4 Annual course of average monthly concentrations
of PM10 (averages for the given type of station),
2013
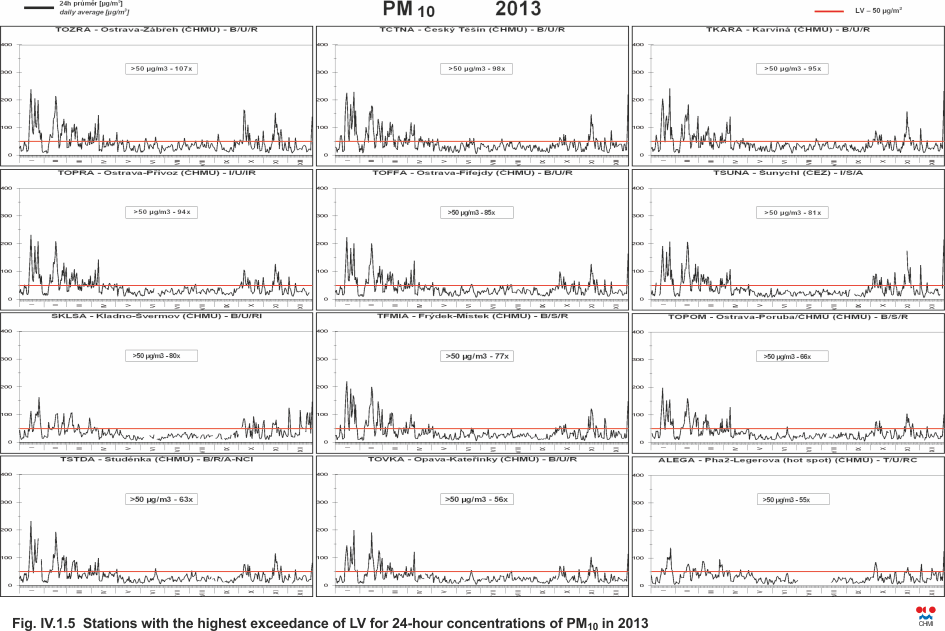
Fig. IV.1.5 Stations with the highest exceedance of LV for
24-hour concentrations of PM10 in 2013
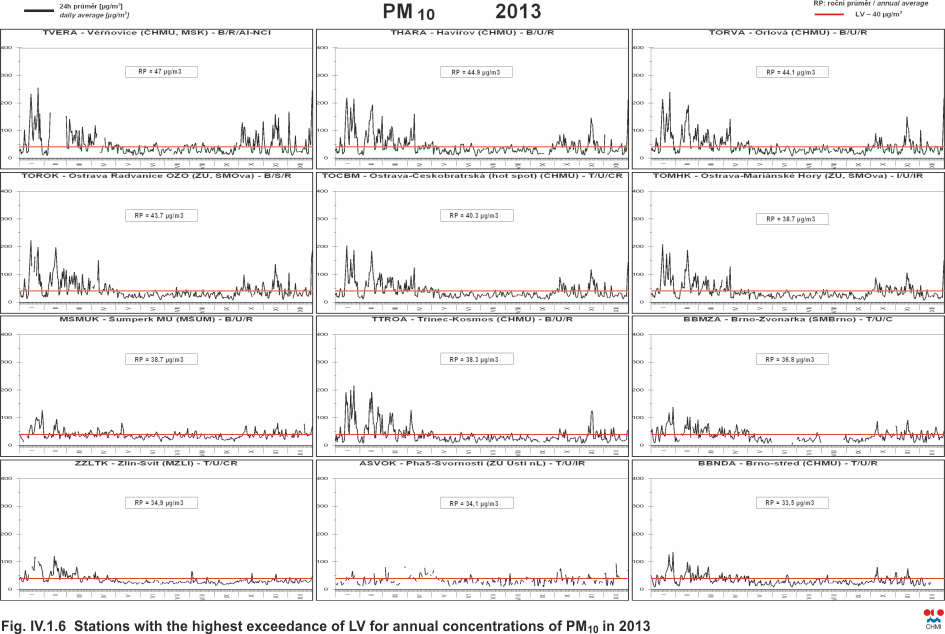
Fig. IV.1.6 Stations with the highest exceedance of LV for
annual concentrations of PM10 in 2013
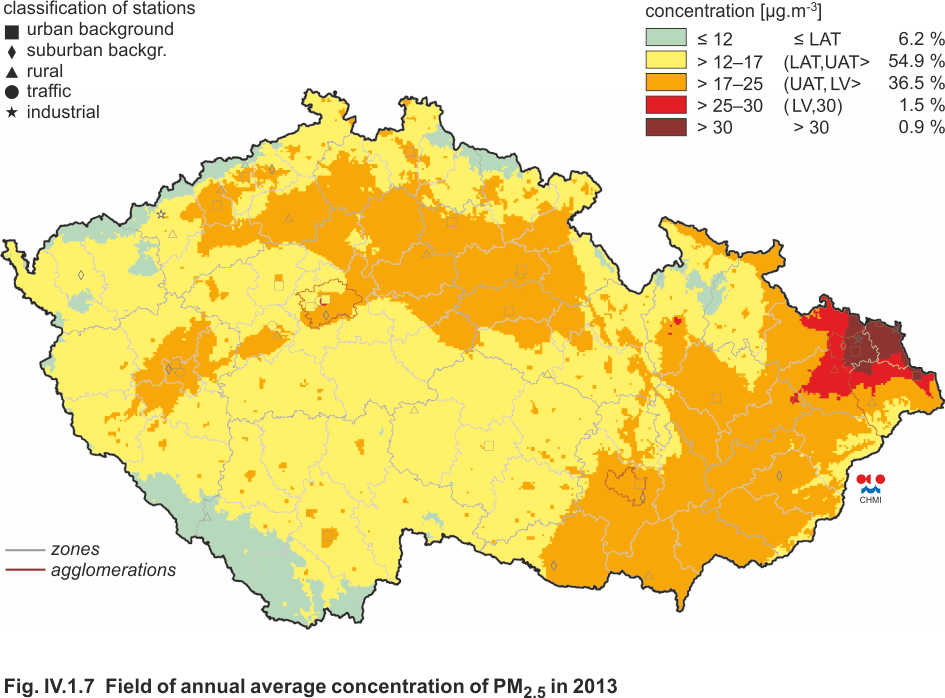
Fig. IV.1.7 Field of annual average concentration of PM2.5
in 2013
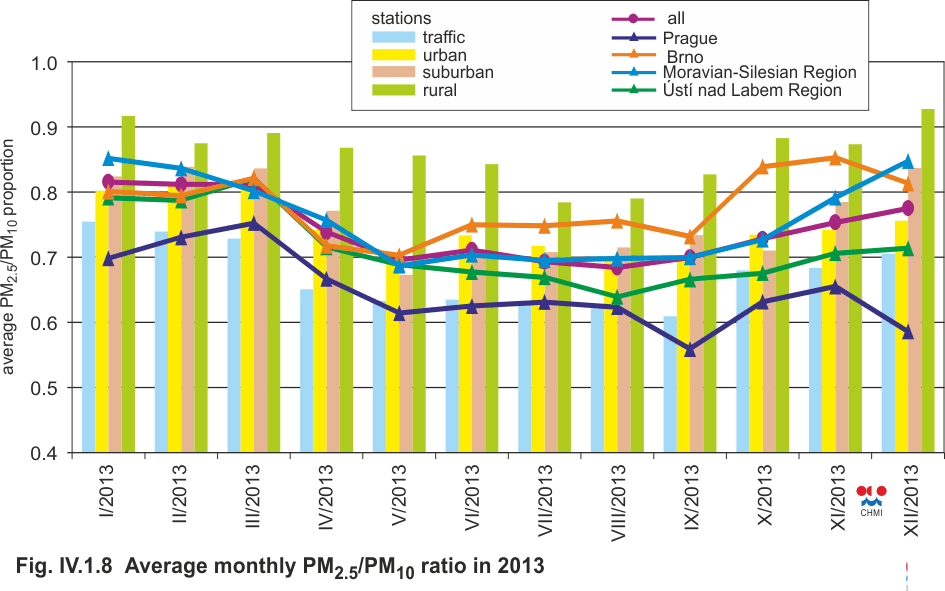
Fig. IV.1.8 Average monthly PM2.5/PM10
ratio in 2013

Fig. IV.1.9 Stations with the highest exceedance of LV for
annual concentrations of PM2.5 in 2013
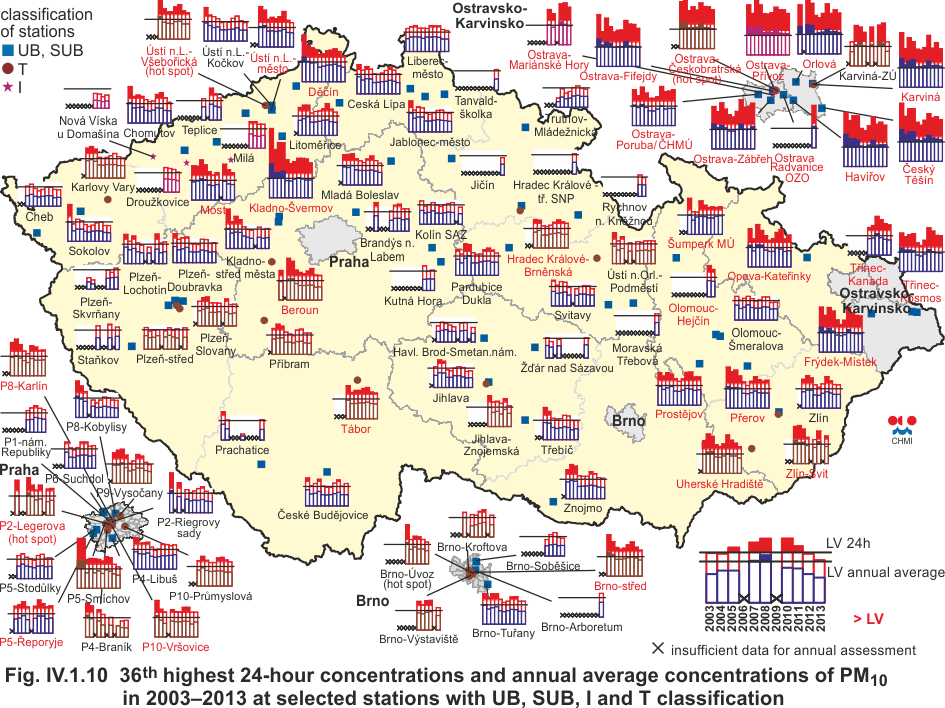
Fig. IV.1.10 36th highest 24-hour concentrations
and annual average concentrations of PM10 in
2003–2013 at selected stations with UB, SUB, I and T
classification

Fig. IV.1.11 36th highest 24-hour concentrations and annual average concentrations of PM10 in 2003–2013 at selected rural (R) stations
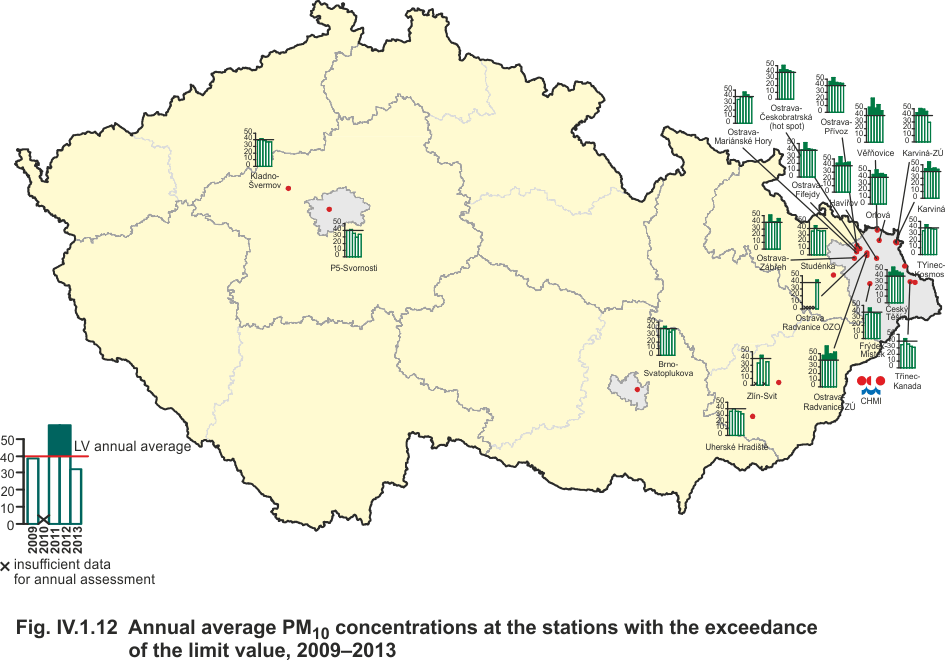
Fig. IV.1.12 Annual average PM10 concentrations at the stations with the exceedance of the limit value, 2009–2013

Fig. IV.1.13 Annual average concentrations of PM2.5 in the ambient air in 2004–2013 at selected stations
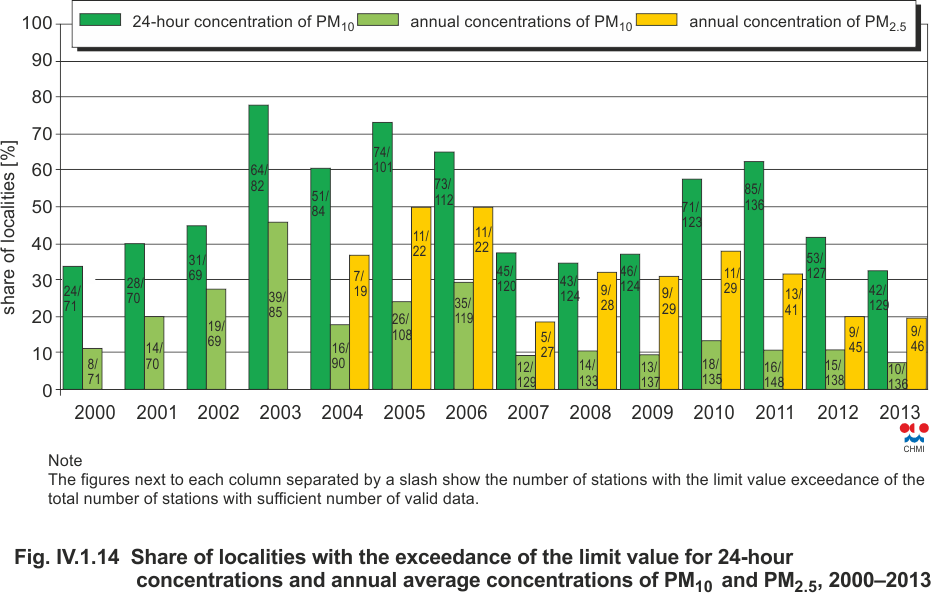
Fig. IV.1.14 Share of localities with the exceedance of the
limit value for 24-hour concentrations and annual average
concentrations of PM10 and PM2.5,
2000–2013
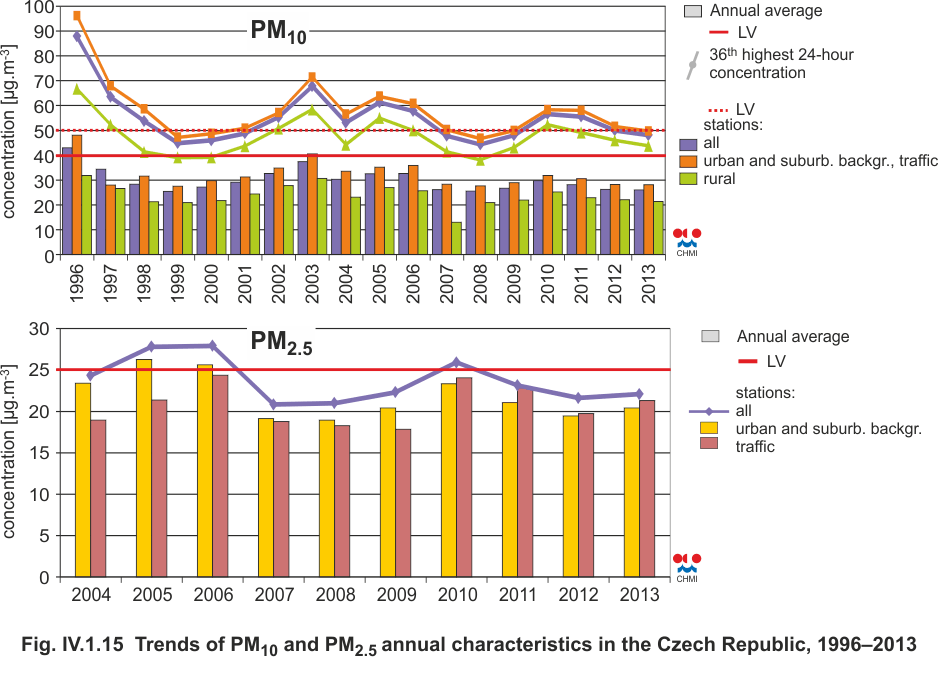
Fig. IV.1.15 Trends of PM10 and PM2.5
annual characteristics in the Czech Republic, 1996–2013

Fig. IV.1.16 Trends of selected characteristics of PM10 (index, year 1996 = 100), 1996–2013; (index, year 2000 = 100), 2000–2013 and PM2.5 (index, year 2004 = 100), 2004–2013
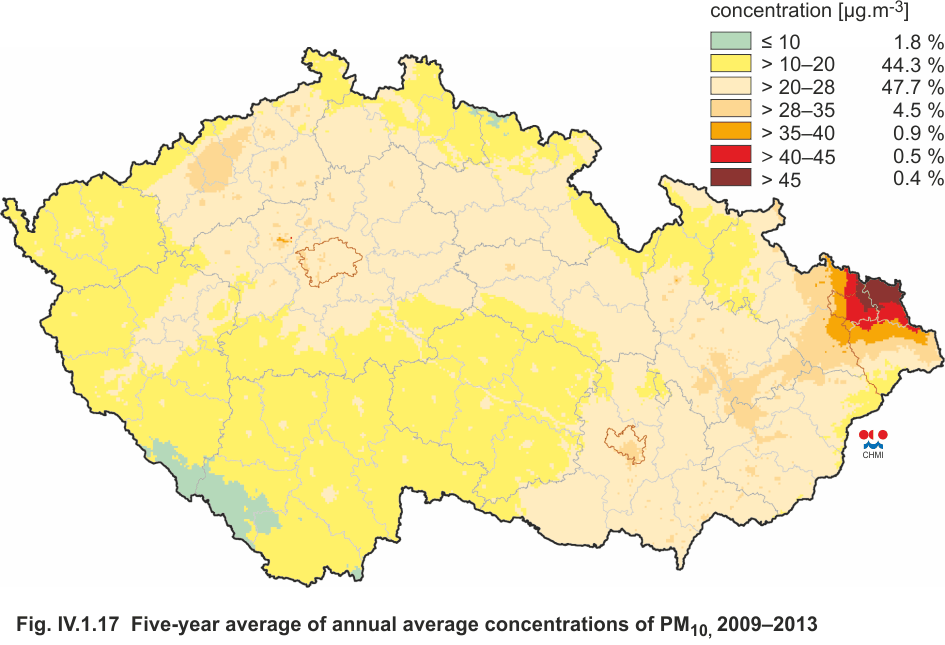
Fig. IV.1.17 Five-year average of annual average
concentrations of PM10, 2009–2013
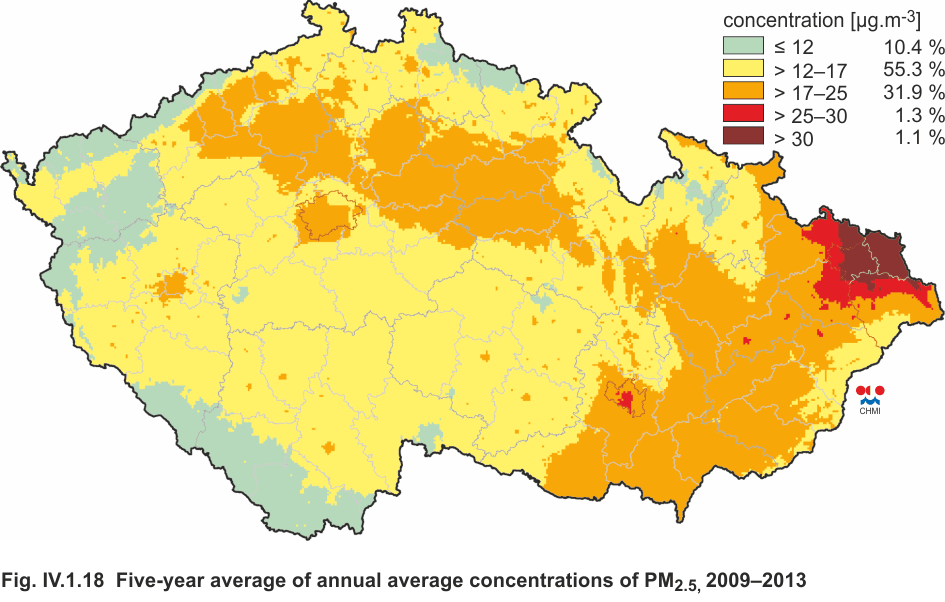
Fig. IV.1.18 Five-year average of annual average concentrations of PM2.5, 2009–2013

Fig. IV.1.19 Emissions of PM10 sorted out by NFR sectors, 2012
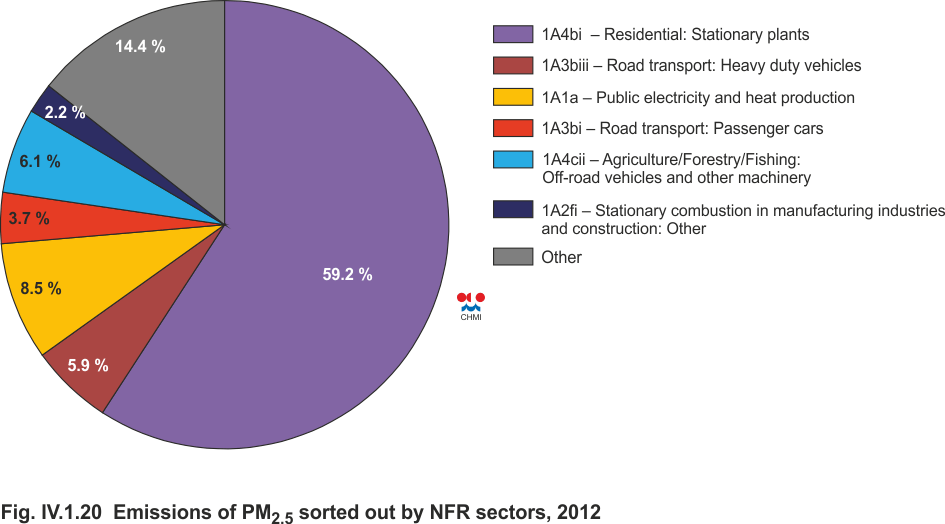
Fig. IV.1.20 Emissions of PM2.5 sorted out by NFR sectors, 2012
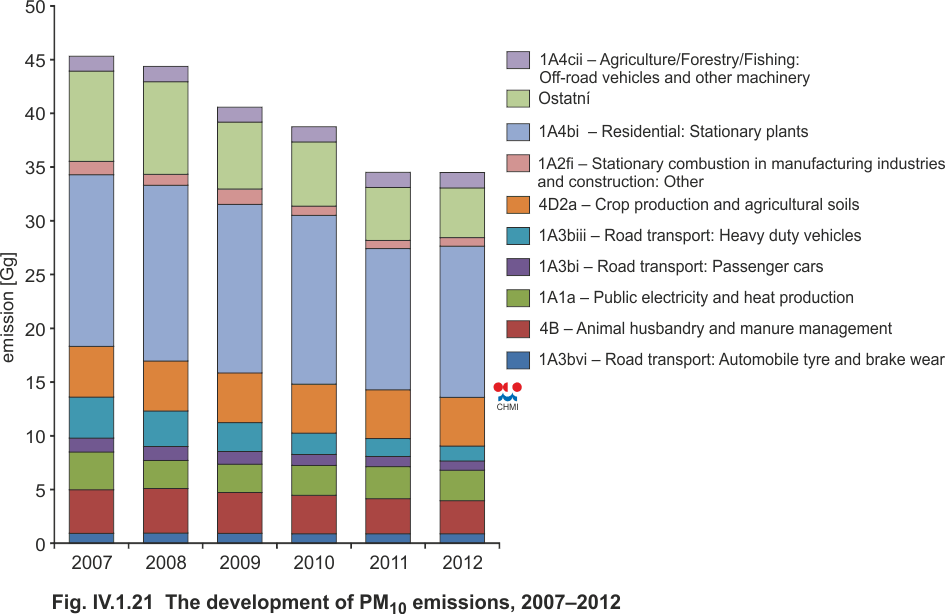
Fig. IV.1.21 The development of PM10 emissions, 2007–2012
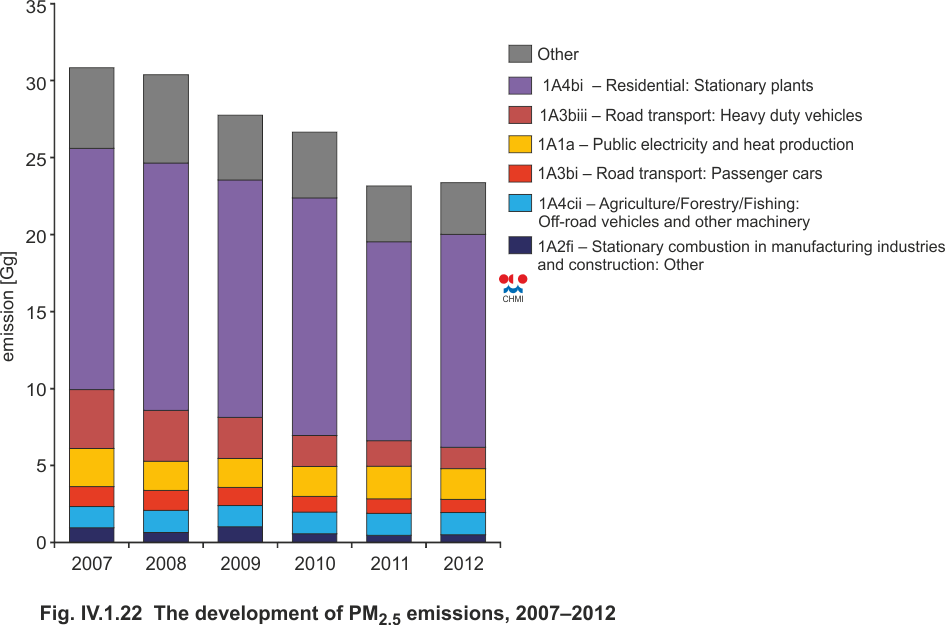
Fig. IV.1.22 The development of PM2.5 emissions,
2007–2012
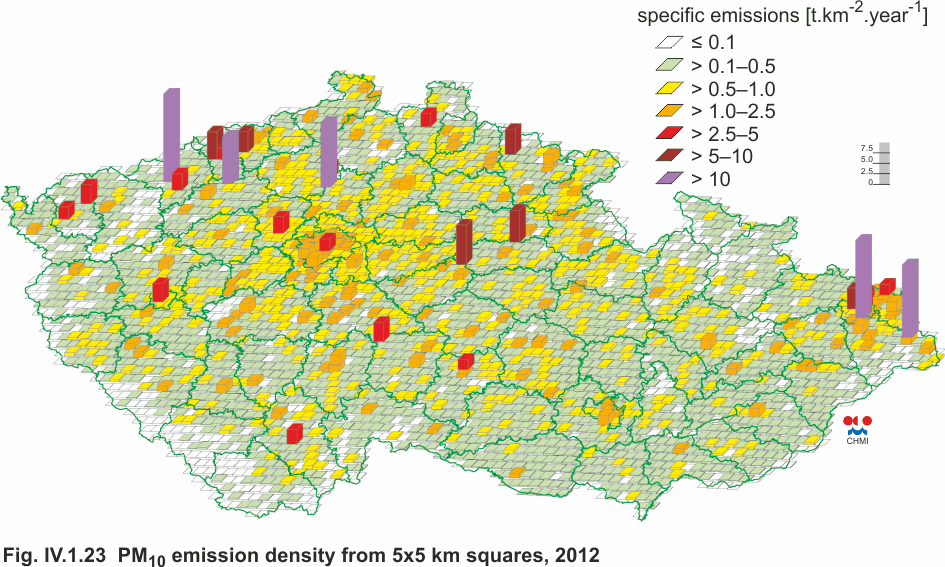
Fig. IV.1.23 PM10 emission density from 5x5 km
squares, 2012
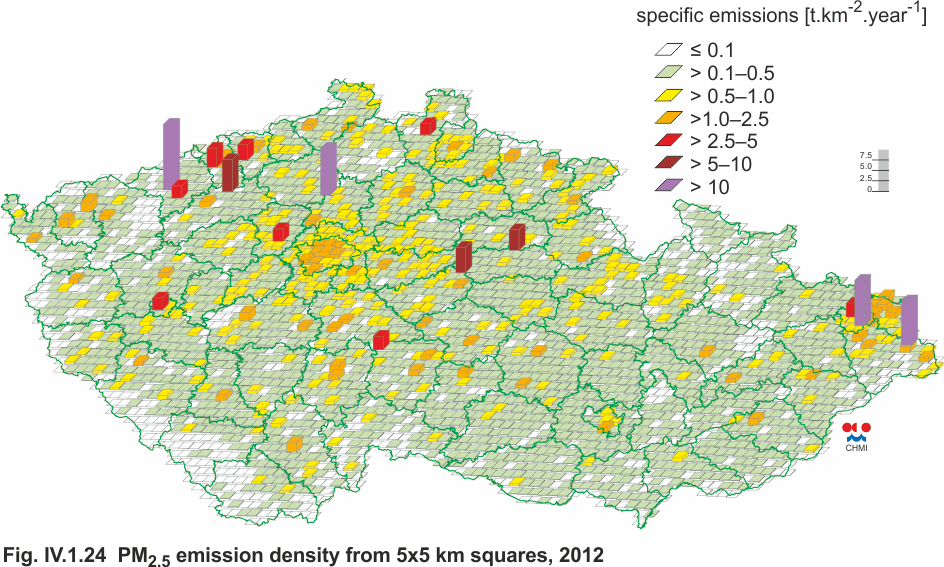
Fig. IV.1.24 PM2.5 emission density from 5x5 km squares, 2012
1Averaged for the same set of stations with measurements both in 2012 and 2013.